0 INTRODUCTION
Powder-mixed electro-discharge diamond surface grinding (PMEDDSG) is an efficient process for shaping hard materials, such as Ti-6Al-4V. It is widely used in many applications, including aerospace industries and medical implants. This process is a combination of conventional surface grinding with electrical spark machining with the presence of powder in dielectric fluid. In this paper, a PMEDDSG set-up has been designed and fabricated in house. Chen et al. [1] experimented with electrical discharge machining of Ti-6Al-4V. They explained that the removal of material in distilled water occurs due to melting, vaporization and crack propagation, whereas in kerosene, it is due to melting and vaporization. They compared the material removal rate (MRR) and electrode wear ratio in the dielectric fluid and reported the effect of the dielectric fluid on the properties of the EDM-generated surface. Choudhury [2] conducted experiments on the EDDG of high-speed steel. He described how the MRR and grinding forces affected by input machining variables, i.e. current (I), voltage (V), pulse duration (Ton) and duty cycle (DC). Koshy et al. [3] performed experiments on the EDDG of high-speed steel and explained that how the grinding force and the rate of material removal are influenced by ampere-current and the wheel revolution per
minute. Koshy et al. [4] carried out experimentation on electric discharge diamond grinding of WC-Co and explained that how the grinding force and rate of material removal was influenced by ampere-current and the on-length of the pulse. Kansal et al. [5] explained that MRR and surface roughness are affected by mixing silicon powder in the kerosene of the electric discharge machine. They selected EN-31 as a workpiece material and copper as an electrode material. Habib [6] formulated the models for MRR, the wear ratio of electrode, the gap size and surface roughness by using response surface methodology (RSM). The input machining variables were I, V and SiC % in aluminium. He performed the experiments on electrical discharge machining with an Al/Sic workpiece and copper as an electrode. Hewidy et al. [7] developed models using RSM in the wire EDM of Inconel 601 material. The input machining variables are I, duty factor, wire tension and water pressure whereas the responses are MRR, wear ratio and surface roughness. He reported that the RSM method has the advantage of interpreting the effect of each machining variable on the output response. Lin and Lin [8] applied the combined grey relational analysis-orthogonal array approach for the multi-output optimization of process parameters in electrical discharge machining of SKD11 alloy steel and reported that multi-output optimization problems
Powder-Mixed Electro-Discharge Diamond Surface Grinding
Process: Modelling, Comparative Analysis and Multi-Output
Optimisation Using Weighted Principal Components Analysis
Modi, M. - Agarwal, G.
Manoj Modi* - Gopal Agarwal
Malaviya National Institute of Technology, Mechanical Engineering Department, India
Powder-mixed electro-discharge diamond surface grinding (PMEDDSG) is an efficient process for shaping hard materials, such as Ti-6Al-4V. Modelling, comparative analysis to study the behaviour of input variables against the responses for both processes, determination of optimum combination of parameters, and studying the effect of input variables on white recast layer thickness and finally on different surface generation during the PMEDDSG processing of Ti-6Al-4V are reported in this paper. The response surface methodology was used to develop the mathematical models of both the responses. Thirty-one experiments were performed on the PMEDDSG set-up without powder-mixed dielectric fluid. Another thirty-two experiments were performed on the PMEDDSG set-up with aluminium powder-mixed dielectric fluid. The current, pulse-duration, wheel-speed, duty-cycle and powder-concentration (considered only as an input variable with the powder-mixed dielectric fluid) were taken as input parameters. The material-removal-rate (MRR) and average-surface-roughness (Ra) were measured as
responses in both the process. The weighted principal components (WPC) analysis has been applied to find an optimum setting of PMEDDSG process parameters during multi-output optimisation. A total of 18 experiments were performed according to Taguchi L18 orthogonal-array
on the PMEDDSG set-up. The optimum combination suggested by the WPC method was tested to obtain the optimum values of MRR and Ra.
The scanning electron microscopy images showed that the surface view and white recast layer thickness of machined workpieces are largely influenced by ampere-current, pulse-duration, duty-cycle, wheel-speed and powder-concentration.
can be simplified with this approach. Pearson offered principal component analysis (PCA), which was later developed by Hotelling [9]. Su and Tong [10] and Jiju [11] offered an easy and step-by-step solution based on PCA for multi-output optimisation with principal component analysis methodology. Liao [12] explained that there are some shortcomings in the PCA methodology, and used weighted principal components (WPC) method to overcome them. He suggested that the WPC approach reduces the complexity of the engineer’s judgement in comparison to the Taguchi approach. Agarwal and Modi [13] showed that effect of current and speed on the MRR in the EDDG process and reported that the MRR increases with increase in current and speed.
In this research paper, an experimental study of surface grinding in the EDDG process (with and without powder-mixed dielectric fluid) has been made. The objective of this research is to develop mathematical models of the responses, a comparative analysis to study the behaviour of input variables against the responses for both the processes, to determine the optimum combination of parameters, and studying the effect of input variables on the white recast layer thickness and on different surface generation during the PMEDDSG processing of Ti-6Al-4V. In this research work,RSM has been applied to develop the mathematical models of responses. These models were used for understanding and predicting the behaviour of input machining variables over the responses. For this purpose, thirty-one and another thirty-two experiments were conducted on an in-house-designed and fabricated PMEDDSG set-up with and without aluminium powder-mixed dielectric fluid.
Minitab software is used to develop the mathematical
models of both the responses. Optimal combinations of machining variables are calculated within the boundary of formulated mathematical models. An optimum combination of machining variables for both the responses is not suggested by this approach. To overcome this problem, weighted principal components analysis has been applied to determine an optimum setting of powder-mixed electro-discharge diamond surface grinding (PMEDDSG) process parameters during multi-output optimisation. A total of eighteen experiments were performed according to the Taguchi L18 orthogonal array on the PMEDDSG set-up. Analysis of variance (ANOVA) has been applied to determine the contribution percentage (C [%]) of different parameters during the PMEDDSG process.
1 OBSERVATIONAL METHODOLOGY
All the experiments have been conducted on an in-house-designed and fabricated PMEDDSG set-up with and without powder-mixed dielectric fluid. For this purpose, a special attachment has been designed and fabricated inside the main tank of the EDM machine: a separate acrylic transparent bathtub-like container (called the machining tank, capacity = 36 litres of dielectric fluid) was fixed on the machine table with the help of clamping bolts. In this set-up, a separate pump and stirrer assembly is fixed in the side wall of the machining tank. The pump circulates the powder-mixed dielectric fluid in the inter-electrode gap (IEG) and stirrer is used to mix the powder particles uniformly with dielectric fluid. The details of PMEDDSG set-up are depicted in Fig. 1a.
wheel are depicted in Table 1. Ti-6Al-4V has been taken as the workpiece material for experimentation. It is flat and rectangular; its size is (60×10×20 mm). The advantage of this hybrid process is that it reduces the thickness of recast layer by the grinding action due to abrasion.
Table 1. Details of bronze-diamond grinding wheel
Abrasive Diamond Concentration 75%
Diameter 100 mm Bore 32 mm
Thickness 10 mm Depth of abrasive 5 mm Bond Material Bronze Grit size 80/100
Fig. 1a) Schematic diagram of in-house-designed and fabricated powder-mixed electro-discharge diamond surface grinding set-up
Fig. 1b) Details of mechanism of removal of material in powder-mixed electro-discharge diamond surface grinding process
Eqs. 1a and b are used to calculate the MRR (mg/min) and MRR (mm³/min) for each machining process.
MRR W W
t
bm am
=( − )×1000, (1a)
MRR W W
t
bm am
= − ×
×
( )
, 1000
ρ (1b)
where Wb m and Wa m are the weights of the workpeace before and after machining, t is the machining time (45 min) and ρ is the density (4.37 gm/cm³) of workpiece material. The hardness of Ti-6Al-4V material is 32 HRC. The weight of the workpiece was measured using a high precision electronic balance (WENSAR HPB-310 model) before and after the experiment, after which the difference in weight was determined. Finally, the MRR is determined by dividing this difference in the weight of the workpiece by the machining time. Ra is measured with a Surtronic-25 Taylor Hobson surface roughness tester at a cut-off value of 0.8 mm. A digital tachometer was used for grinding wheel speed measurement (revolutions per minute (RPM)).
2 RESPONSE SURFACE MODELLING
Response surface modelling (RSM) is a combination of statistics and a mathematics approach. This approach is used to obtain the relationship between input variables and output responses. All experiments have been conducted according to central composite rotary design (CCRD).
The response surface in general is expressed by the Eq. (2).
Y a a xi i a x a x x
i n
ii i ij i j
j i i
n
= + + +
= = >
∑
∑
∑
0 1
2 1
, (2)
where, Y are output responses, a0 coefficients for the free terms, ai coefficients of linear terms, aii coefficients of quadratic terms and aij coefficients for the interaction terms. Thirty-one experiments were performed on an electro-discharge diamond surface grinding set-up.
Table 2. Value of machining variables for EDDSG process
Parameters Symbol Unit
Coded value of machining variables at different levels according to
CCRD plan
-2 -1 0 +1 +2
Current I [A] 1 3 5 7 9
Pulse on-time Ton [µs] 40 70 100 130 160
The value of machining variables involved in this experimental work is depicted in Table 2. The experimental central composite rotary design plan and the responses for the EDDSG process are depicted in Table 3.
Table 3. Experimental plan for CCRD and responses for EDDSG process
Experiment No.
Coded value of machining variables at different levels according to CCRD plan
MRR
[mm³/min] [µm]Ra
Current (I)
Pulse on-time
(Ton)
Wheel speed (WS)
Duty cycle (DC)
Exp. Eq. (3) Exp. Eq. (4)
1 0 0 0 2 0.322 0.312 5.08 5.19
2 0 0 0 -2 0.440 0.448 3.13 2.87 3 0 0 -2 0 0.268 0.270 4.62 4.75
4 0 0 0 0 0.352 0.380 3.97 4.03
5 0 2 0 0 0.502 0.490 4.13 4.22
6 -1 -1 -1 -1 0.232 0.212 3.14 2.96 7 -1 1 1 -1 0.410 0.432 2.96 2.88 8 -1 1 -1 -1 0.306 0.322 3.28 3.40 9 1 -1 1 1 0.496 0.494 4.60 4.64 10 1 1 1 -1 0.798 0.672 3.94 3.92 11 1 -1 -1 -1 0.440 0.452 3.97 4.00 12 2 0 0 0 0.712 0.732 4.97 5.07 13 0 0 0 0 0.356 0.380 3.92 4.03 14 -1 1 1 1 0.348 0.364 4.17 4.04 15 -1 -1 -1 1 0.164 0.144 4.23 4.12 16 -1 -1 1 1 0.266 0.254 3.61 3.60 17 0 0 0 0 0.308 0.380 4.12 4.03 18 1 -1 -1 1 0.384 0.384 5.31 5.16 19 0 0 0 0 0.424 0.380 4.00 4.03 20 -2 0 0 0 0.240 0.252 2.78 2.99 21 -1 1 -1 1 0.252 0.254 4.55 4.56 22 -1 -1 1 -1 0.306 0.322 2.51 2.44 23 1 1 -1 -1 0.532 0.562 4.38 4.44 24 0 0 2 0 0.450 0.490 3.67 3.71 25 1 -1 1 -1 0.534 0.562 3.33 3.48 26 1 1 -1 1 0.488 0.494 5.81 5.60 27 0 -2 0 0 0.298 0.270 3.25 3.34 28 1 1 1 1 0.592 0.604 5.19 5.08 29 0 0 0 0 0.380 0.380 3.99 4.03 30 0 0 0 0 0.368 0.380 3.91 4.03 31 0 0 0 0 0.360 0.380 4.07 4.03
The mathematical models for MRR and Ra are obtained via Minitab 14 software after eliminating the non-significant terms for the EDDSG process, and are depicted by Eqs. (3) and (4). Using Eqs. (3) and (4), the responses are calculated and are shown in Table 3, in the columns MRR (Eq. (3)) and Ra (Eq. (4)).
MRR I T WS
DC I on
= + + + −
−0 38 0 120 034.. . +0 028.0 055. 2, 0 055. (3)
R I T WS
DC T WS
a on
on
= + + − +
+4 03 0 520 58.. .−0 062. 0 22. 2 +0 052.0 26. 2. (4)
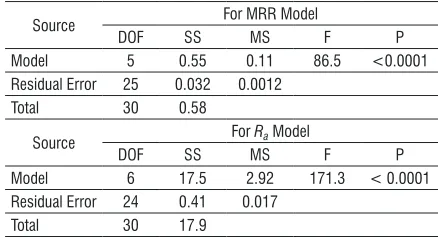
Table 4. ANOVA for MRR and Ra models without powder-mixed dielectric fluid
Source For MRR Model
DOF SS MS F P
Model 5 0.55 0.11 86.5 <0.0001 Residual Error 25 0.032 0.0012
Total 30 0.58
Source For Ra Model
DOF SS MS F P
Model 6 17.5 2.92 171.3 < 0.0001 Residual Error 24 0.41 0.017
Total 30 17.9
The ANOVA results are depicted in Table 4. It has been determined that the p-value is less than 0.05 for both models. Thus, it is concluded that the model equations of both responses are significant in describing the relationship between the input parameters and output responses. Another thirty-two experiments were performed on the PMEDDSG set-up with aluminium powder. The value of machining variables involved in this experimental work is depicted in Table 5. The experimental CCRD plan and responses for PMEDDSG process are depicted in Table 6.
Table 5. Value of all machining variables for PMEDDSG process
Parameters Symbol Unit
Coded value of machining variables at different levels according to CCRD plan -2 -1 0 +1 +2
Current I [A] 1 3 5 7 9
Pulse on-time Ton [µs] 40 70 100 130 160
Wheel Speed WS [RPM] 350 450 550 650 750 Duty Cycle DC [%] 0.59 0.63 0.67 0.71 0.75 Al Powder Conc. PC [gm/l] 1.5 2 2.5 3 3.5
Similarly, the mathematical models for MRR and Ra are obtained with the aid of Minitab 14 software after eliminating the non-significant terms for PMEDDSG process (see Eqs. (5) and (6)). Using Eqs. (5) and (6), the responses are calculated and are shown in Table 6, in the columns MRR (Eq. (5)) and Ra (Eq. (6)).
MRR I T WS
DC PC I
Al= + + on+ −
−0 51 0 160 044.. . +0 022.0 070. +0 022.0 067. 2,, (5)
R I T WS DC
PC T
aAl on
on
= + + − + +
Table 6. Experimental plan for CCRD and responses for PMEDDSG Process
Experiment No.
Coded value of machining variables at different levels according to CCRD plan
MRR
[mm³/min] [µm]Ra
Cur
rent (
I
)
Pulse on- time ( Ton
)
Wheel
speed (
WS
)
Duty cycle (
DC
)
Powder Conc. Exp. Eq. (5) Exp. Eq. (6)
1 -2 0 0 0 0 0.272 0.278 2.69 2.90 2 -1 1 1 1 -1 0.440 0.443 3.80 3.73 3 0 0 0 0 0 0.480 0.510 3.84 3.88 4 -1 -1 -1 1 -1 0.206 0.169 3.93 3.83 5 0 0 0 0 0 0.490 0.510 3.82 3.88 6 1 1 -1 1 -1 0.614 0.629 5.46 5.21 7 -1 1 -1 1 1 0.330 0.353 4.41 4.51 8 0 0 0 0 0 0.550 0.510 3.76 3.88 9 0 0 -2 0 0 0.336 0.376 4.45 4.38 10 0 0 0 0 2 0.650 0.554 4.73 4.44 11 0 0 0 0 0 0.510 0.510 3.96 3.88 12 0 0 0 0 -2 0.460 0.466 3.58 3.88 13 1 -1 -1 1 1 0.482 0.533 5.15 5.09 14 1 1 -1 -1 1 0.840 0.761 4.27 4.41 15 -1 -1 1 -1 -1 0.398 0.391 2.54 2.25 16 -1 1 -1 -1 -1 0.384 0.397 3.02 3.15 17 0 2 0 0 0 0.630 0.650 3.98 3.96 18 -1 1 1 -1 1 0.540 0.575 2.87 2.93 19 -1 -1 -1 -1 1 0.294 0.301 3.06 3.03 20 1 1 1 1 1 0.760 0.807 5.02 4.99 21 0 0 0 0 0 0.530 0.510 3.77 3.88 22 -1 -1 1 1 1 0.360 0.347 3.50 3.61 23 0 0 0 0 0 0.480 0.510 3.95 3.88 24 0 0 2 0 0 0.660 0.644 3.53 3.38 25 1 -1 -1 -1 -1 0.580 0.577 3.69 3.73 26 1 1 1 -1 -1 0.880 0.851 3.65 3.63 27 2 0 0 0 0 0.921 0.918 4.80 4.86 28 1 -1 1 1 -1 0.630 0.623 4.28 4.31 29 0 -2 0 0 0 0.374 0.370 3.13 3.16 30 0 0 0 2 0 0.405 0.422 4.88 4.96 31 0 0 0 -2 0 0.552 0.598 3.01 2.80 32 1 -1 1 -1 1 0.678 0.755 3.23 3.51
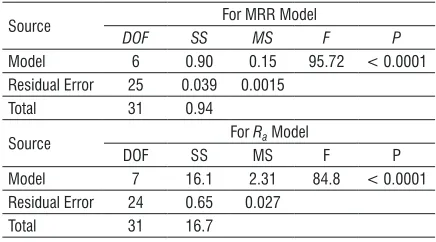
Table 7. ANOVA for MRR and Ra models with powder-mixed dielectric fluid
Source For MRR Model
DOF SS MS F P
Model 6 0.90 0.15 95.72 < 0.0001 Residual Error 25 0.039 0.0015
Total 31 0.94
Source For Ra Model
DOF SS MS F P
Model 7 16.1 2.31 84.8 < 0.0001 Residual Error 24 0.65 0.027
Total 31 16.7
The ANOVA results are depicted in Table 7. It is found that the p-value is less than 0.05 for both models. Therefore, it is concluded that model equations of both the responses are significant in describing the relationship between the input parameters and output responses.
3 ANALYSIS OF OUTCOMES AND INTERPRETATIONS (FROM MATHEMATICAL MODELS OF MRR AND Ra WITH AND
WITHOUT POWDER)
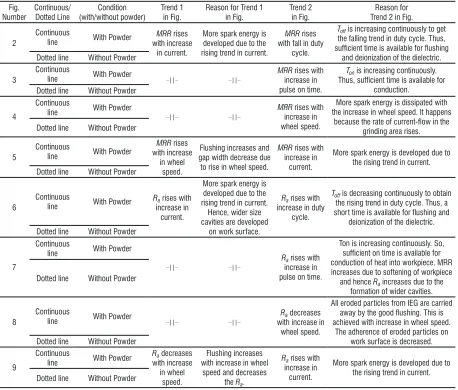
The analysis of outcomes is summarized in Table 8, which also includes the interpretations of Figs. 2 to 9.
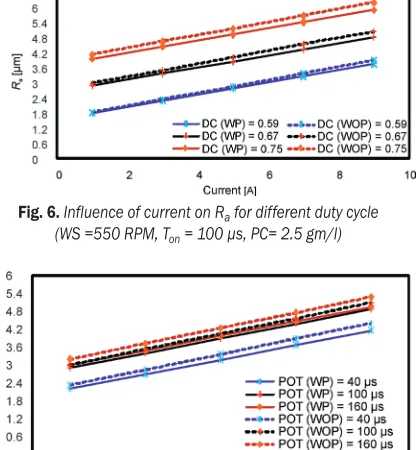
With reference to Figs. 2 to 5, the MRR is greater in the powder-mixed dielectric fluid as compared to the dielectric fluid without it. The reason for this is the occurrence of the series discharge in the IEG. These series discharges have been taken place (in addition to the spark discharge and grinding action in the EDDSG process) in the IEG due to the presence of aluminium powder in the dielectric fluid. With reference to Figs. 6 to 9, the Ra is less in powder-mixed dielectric fluid as compared to without powder-mixed dielectric fluid. The presence of aluminium powder in the dielectric fluid modified the plasma channel, i.e. it becamelarger and wider. The spark energy is equally distributed between the powder particles. Hence, the density of spark discharge is reduced, which is responsible for the formation of smaller cavities on the machined workpiece.
The optimum setting of different machining variables for the PMEDDSG and EDDSG processes depends on maximizing the MRR and minimizing the Ra; it is depicted in Table 9. These values were calculated within the boundary of formulated mathematical models. The Taguchi method is commonly used for single response optimization; it does not suggest an optimum combination of machining variables for both the responses. There are significant complications involved in multi-response optimisation as compared to single multi-response optimisation, because the higher log S value of one response (i.e. MRR) may correspond to a lower log S value for another response (i.e. Ra). Hence, an overall evaluation of log S values is needed for the multi-output optimisation. In order to overcome this problem, a Weighted Principal Components Analysis has been applied to find an optimum setting of PMEDDSG process parameters during multi-output optimisation.
EDDSG process during the machining of Ti-6Al-4V. Hence, we have applied the weighted principal components approach to find an optimum setting of the PMEDDSG process parameters during multi-output optimization with Al powder-mixed dielectric fluid. After that, SEM analysis was performed on Al powder-mixed EDDSG machined workpieces.
4 OPTIMIZATION THROUGH WEIGHTED PRINCIPAL COMPONENTS (WPC) ANALYSIS
The Principal Components Analysis (PCA) method was first proposed by Pearson and modified by Hotelling [9]. The short comes associated with the PCA method have been rectified by WPC method proposed by Liao [12]. In this method, total principal Table 8. Analysis of outcomes and interpretations of Figs. 2 to 9
Fig.
Number Continuous/ Dotted Line (with/without powder)Condition Trend 1in Fig. Reason for Trend 1 in Fig. Trend 2in Fig. Trend 2 in Fig.Reason for
2
Continuous
line With Powder with increase MRR rises in current.
More spark energy is developed due to the rising trend in current.
MRR rises with fall in duty
cycle.
Toff is increasing continuously to get
the falling trend in duty cycle. Thus, sufficient time is available for flushing
and deionization of the dielectric. Dotted line Without Powder
3
Continuous
line With Powder –||– –||–
MRR rises with increase in pulse on time.
Ton is increasing continuously.
Thus, sufficient time is available for conduction.
Dotted line Without Powder
4
Continuous
line With Powder –||– –||– MRRincrease in rises with wheel speed.
More spark energy is dissipated with the increase in wheel speed. It happens
because the rate of current-flow in the grinding area rises. Dotted line Without Powder
5
Continuous
line With Powder
MRR rises with increase
in wheel speed.
Flushing increases and gap width decrease due to rise in wheel speed.
MRR rises with increase in
current.
More spark energy is developed due to the rising trend in current. Dotted line Without Powder
6
Continuous
line With Powder Rincrease in a rises with current.
More spark energy is developed due to the rising trend in current.
Hence, wider size cavities are developed
on work surface.
Ra rises with
increase in duty cycle.
Toff is decreasing continuously to obtain
the rising trend in duty cycle. Thus, a short time is available for flushing and
deionization of the dielectric. Dotted line Without Powder
7
Continuous
line With Powder
–||– –||–
Ra rises with
increase in pulse on time.
Ton is increasing continuously. So, sufficient on time is available for conduction of heat into workpiece. MRR increases due to softening of workpiece
and hence Ra increases due to the
formation of wider cavities. Dotted line Without Powder
8
Continuous
line With Powder –||– –||–
Ra decreases
with increase in wheel speed.
All eroded particles from IEG are carried away by the good flushing. This is achieved with increase in wheel speed.
The adherence of eroded particles on work surface is decreased. Dotted line Without Powder
9
Continuous
line With Powder
Ra decreases
with increase in wheel
speed.
Flushing increases with increase in wheel
speed and decreases the Ra.
Ra rises with
increase in current.
More spark energy is developed due to the rising trend in current. Dotted line Without Powder
Table 9. Optimal setting of PMEDDSG and EDDSG variables
Process parameter
PMEDDSG Process
I Ton WS DC PC
7 130 645 0.63 2.93 3 70 650 0.65 2.4
MRR [mm³/min] 0.883
Ra[µm] 2.54
Process parameter
EDDSG Process
#I / #D [%]
I Ton WS DC
7 130 645 0.63 3 70 650 0.65
MRR [mm³/min] 0.665 24.6 (#I)
Ra[µm] 2.71 6.71 (#D)
#I: improvement in MRR and #D: decrement in Ra in PMEDDSG
Fig. 2. Influence of current on MRR for different duty cycle (WS = 550 RPM, Ton = 100 µs, PC = 2.5 gm/l)
Fig. 3. Influence of current on MRR for different pulse on-time (WS =550 RPM, DC = 0.67, PC= 2.5 gm/l)
Fig. 4. Influence of current on MRR for different wheel speed (Ton = 100 µs, DC = 0.67, PC= 2.5 gm/l)
Fig. 5. Influence of wheel speed on MRR for different current (Ton = 100 µs, DC = 0.67, PC= 2.5 gm/l)
Fig. 6. Influence of current on Ra for different duty cycle
(WS =550 RPM, Ton = 100 µs, PC= 2.5 gm/l)
Fig. 7. Influence of current on Ra for different pulse on-time
(WS =550 RPM, DC = 0.67, PC= 2.5 gm/l)
Fig. 8. Influence of current on Ra for different wheel speed
(Ton = 100 µs, DC = 0.67, PC=2.5 gm/l)
Fig. 9. Influence of wheel speed on Ra for different current
(Ton = 100 µs, DC = 0.67, PC = 2.5 gm/l)
components are used. The detailed procedure of this
Table 10. Input variables and their levels for aluminium powder-mixed dielectric fluid
Symbol Parameters Unit Level 1 Level 2 Level 3
PC Al Powder Concentration [gm/l] 1.5 3
-I Current [A] 3 7 11
Ton Pulse on-time [µs] 100 150 200
WS Wheel Speed [RPM] 450 650 850
DC Duty Cycle [%] 0.61 0.69 0.77
Table 11. L18 orthogonal array, output responses, normalised log S value and MOPI
Exp. No.
Control Factor Responses log S value Normalized log S value MOPI
PC I Ton WS DC MRR [mm³/min] Ra [µm] MRR Ra MRR Ra
1 1 1 1 1 1 0.521 2.21 -5.66 -6.89 0.00 1.00 -0.45
2 1 1 2 2 2 0.540 2.60 -5.35 -8.30 0.05 0.85 -0.35
3 1 1 3 3 3 0.660 3.20 -3.61 -10.10 0.34 0.66 -0.05
4 1 2 1 1 2 0.790 3.40 -2.05 -10.63 0.61 0.60 0.16
5 1 2 2 2 3 0.880 4.01 -1.11 -12.06 0.76 0.45 0.34
6 1 2 3 3 1 0.659 4.65 -3.62 -13.35 0.34 0.31 0.10
7 1 3 1 2 1 0.956 4.15 -0.39 -12.36 0.88 0.42 0.44
8 1 3 2 3 2 0.980 4.63 -0.18 -13.31 0.92 0.32 0.51
9 1 3 3 1 3 0.835 5.80 -1.57 -15.27 0.69 0.11 0.44
10 2 1 1 3 3 0.780 3.60 -2.16 -11.82 0.59 0.48 0.20
11 2 1 2 1 1 0.625 4.70 -4.08 -14.15 0.27 0.23 0.08
12 2 1 3 2 2 0.726 4.98 -2.78 -13.94 0.48 0.25 0.23
13 2 2 1 2 3 1.025 4.35 0.21 -12.77 0.99 0.38 0.53
14 2 2 2 3 1 0.880 5.80 -1.11 -15.27 0.76 0.11 0.49
15 2 2 3 1 2 0.760 5.40 -2.38 -14.65 0.55 0.18 0.31
16 2 3 1 3 2 0.915 4.70 -0.77 -13.44 0.82 0.30 0.44
17 2 3 2 1 3 1.035 5.90 0.30 -16.31 1.00 0.00 0.71
18 2 3 3 2 1 0.840 6.54 -1.51 -15.42 0.70 0.09 0.45
Table 12. Average MOPI values at different factor levels and ANOVA table for MOPI
Average MOPI values at different factor levels
Symbol ANOVA table for MOPI
Level 1 Level 2 Level 3 Max-Min DF SS MS F P C [%]
0.03 0.60 0.57 PC 1 0.2983 0.2983 3.76 0.070 19
-0.05 0.32 0.495 0.545 I 2 0.9564 0.4782 11.74 0.001 61
0.21 0.29 0.24 0.08 Ton 2 0.019 0.009 0.09 0.914 1.5
0.20 0.27 0.28 0.08 WS 2 0.020 0.010 0.09 0.910 1.5
0.18 0.21 0.35 0.17 DC 2 0.1035 0.0517 0.53 0.599 7
Error 6 0.1425 10
Total 17 1.5675 100
For ANOVA analysis, Minitab software is used. From Table 12, it is observed that current (> 95%
CL) and powder concentration (≤ 90% CL) are
the significant parameters. Ton, WS and DC are the non-significant parameters. It is also observed that percentage contribution C [%] of various process parameters is powder concentration (19%), pulse on-time (1.5%), wheel speed (1.5%), duty cycle (7%) and current (61%) for the responses under the
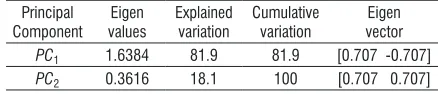
Table 13. Display the explained variation and eigenvector of each principal component
Principal Component
Eigen values
Explained variation
Cumulative variation
Eigen vector
PC1 1.6384 81.9 81.9 [0.707 -0.707] PC2 0.3616 18.1 100 [0.707 0.707]
Table 14. Result of the confirmation test
Factor Level
Initial process parameters
Optimal process parameters (WPC)
approach
PC1I1Ton1WS1DC1 PC2I3Ton2WS3DC3
MRR [mm³/min] 0.521 1.055
Ra [µm] 2.21 4.76
Fig. 10. Flow chart to calculate MOPI for WPC approach
multi-output optimization (maximization of MRR and minimization of Ra) in the PMEDDSG of Ti-6Al-4V. The optimum combination of different factors is PC2I3Ton2WS3DC3, and its confirmation experimental results are depicted in Table 14.
5 ANALYSIS OF PMEDDSG-GENERATED SURFACE
The machined surface generated through the PMEDDSG process is subject to many changes in the form of surface cavities and pits. To investigate the effect of various input parameters i.e. current, pulse-duration, duty cycle, wheel speed and powder concentration on the PMEDDSG-generated surfaces, electron scanning microscopy (SEM) is used at 500× magnification. To prepare the specimens for SEM analysis, emery paper (3/0 and 4/0) were used to grind the produced machined surfaces; after that, these surfaces were cleaned and shined by polishing and finally etched with K-AGENT (combination of eighty-eight percent pure water, ten percent nitric acid and two percent hydrofluoric acid) for 50 seconds.
The effect of current and pulse-duration on PMEDDSG of Ti-6Al-4V (with Al powder-mixed dielectric fluid) generated surfaces are depicted in Figs. 11a and b and 12a and b, respectively. It was observed from all images that the surface cavities become wider and bigger as the current or
duration increases. Increases in current or pulse-duration lead to increase in spark energy, which leads to the evacuation of more material in molten form from work surfaces. Hence, increases in current or pulse-duration is the reason for the formation of wider and bigger sizes cavities on work surface.
The effect of duty cycle on the PMEDDSG of Ti-6Al-4V generated surface (with Al powder-mixed dielectric fluid) is depicted in Figs. 13a and b. It was observed from both images that surface cavities are wider and bigger with increase in duty cycle. Pulse on-duration remains constant throughout the experiment and the duty cycle increases due to decreased pulse off-time. This means less time is available for dielectric flushing to sweep the ejected particles from the IEG and for the deionization of the dielectric. Therefore, a continuous spark takes place and Ra increases.
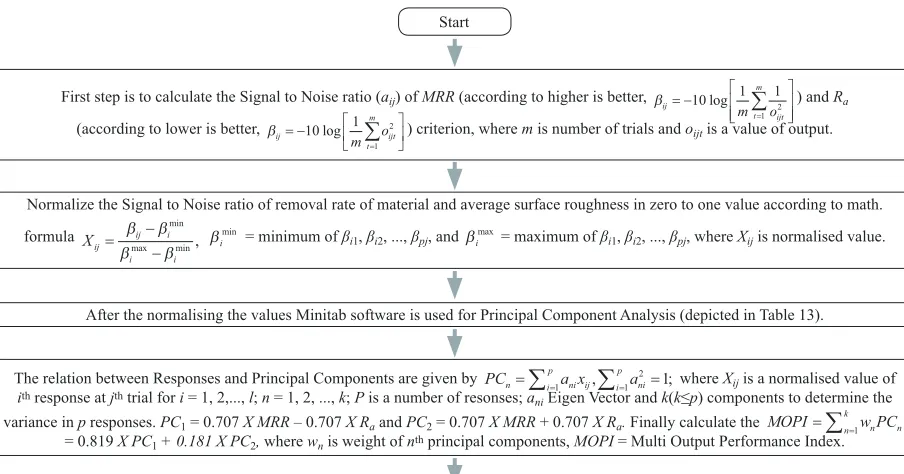
The effect of wheel speed on PMEDDSG of Ti-6Al-4V generated surfaces (with Al powder-mixed dielectric fluid) is depicted in Figs. 14a and b. It was observed from both images that the surface cavities are narrower and smaller with increase in wheel speed. Ra decreases with increase in wheel speed. The increased in-wheel speed is the reason for the efficient dielectric flushing in the IEG, which reduces the deposition of re-solidified ejected particles on a work-surface and also reduces the possibilities of arcing. Start
End
First step is to calculate the Signal to Noise ratio (aij) of MRR (according to higher is better, βij
ijt t
m
m o
= −
=
∑
10 1 12
1
log ) and Ra
(according to lower is better, βij ijt t
m
m o
= −
=
∑
10 1 2
1
log ) criterion, where m is number of trials and oijt is a value of output.
Normalize the Signal to Noise ratio of removal rate of material and average surface roughness in zero to one value according to math. formula Xij ij i
i i
= −
−
β β
β β
min
max min, βi
min = minimum of β
i1, βi2, ..., βpj, and βimax = maximum of βi1, βi2, ..., βpj, where Xijis normalised value.
After the normalising the values Minitab software is used for Principal Component Analysis (depicted in Table 13).
The relation between Responses and Principal Components are given by PCn i a xni ij a
p
ni i p
=
∑
=1∑
= 2=1 1
, ; where Xij is a normalised value of ith response at jth trial for i = 1, 2,..., l; n = 1, 2, ..., k; P is a number of resonses; ani Eigen Vector and k(k≤p) components to determine the variance in p responses. PC1 = 0.707 X MRR – 0.707 X Ra and PC2 = 0.707 X MRR + 0.707 X Ra. Finally calculate the MOPI n w PCn n
k
=
∑
=1Hence, increase in wheel speed is the reason for the formation of narrower and smaller sizes cavities on work surface.
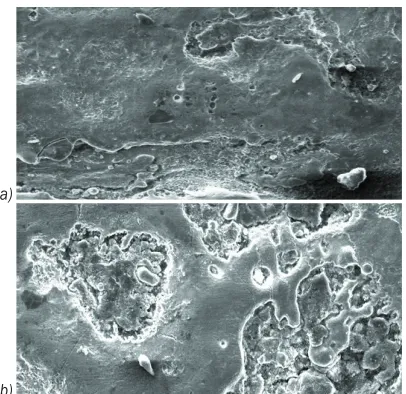
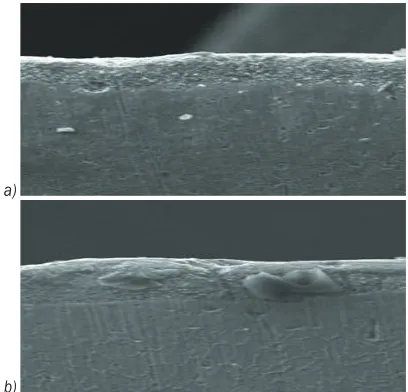
The effect of powder on the PMEDDSG of Ti-6Al-4V generated surface (with Al and without powder-mixed dielectric fluid) is depicted in Figs. 15a and b. It was observed from both images that surface cavities are smaller and smooth due to the presence of Al powder in the IEG as compared to without powder. This happened because the added powder in the dielectric fluid modified the plasma channel, i.e. it becomes larger and wider, and the spark energy is
equally distributed between the powder particles. Hence, the electrical density of spark discharge is reduced, which is responsible for the production of smaller cavities on work-surface.
It is also observed that number of cavities on the machined surfaces increases with increase in pulse-duration, duty cycle and current. Similarly, the number of cavities on the machined surfaces decreases with increase in wheel speed. A few cracks are developed on the machined surface when the stress induced by the PMEDDSG process exceeds the material tensile strength. A few pockmarks are developed on the a)
b)
Fig. 11. Influence of current on PMEDDSG-generated surface; a) I = 2 A, b) I = 10 A (WS = 550 RPM, DC = 0.80, Ton = 300 µs,
PC = 5 gm/l of Al Powder)
a)
b)
Fig. 12. Influence of pulse-duration on PMEDDSG-generated surface; a) Ton = 100 µs, b) Ton = 200 µs (WS = 550 RPM,
DC = 0.80, I = 6 A, PC = 5 gm/l of Al Powder)
a)
b)
Fig. 13. Influence of duty cycle on PMEDDSG-generated surface; a) DC = 0.70, b) DC = 0.75 (WS = 550 RPM, I = 6 A, Ton = 100 µs,
PC = 5 gm/l of Al Powder)
a)
b)
Fig. 14.Influence of wheel speed on PMEDDSG-generated surface; a) WS = 650 RPM, b) WS = 750 RPM (I = 6 A, DC = 0.80,
machined surface due to escaping of trapped gases from the re-solidified material.
6 ANALYSIS OF WHITE RECAST LAYER THICKNESS (WRLT)
If the molten material from work surface is not flushed out quickly, it will re-solidify due to the cooling effect of the dielectric fluid and adhere to the machined surface. This deposited layer is called the white recast layer.
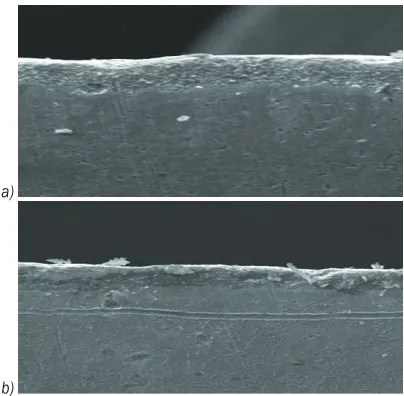
From Figs. 16a and b, it was observed that white recast layer thickness (WRLT) increases as the current
increases. The increased value of current is the reason for increase in the energy of each spark and hence raises the MRR. In addition, the eroded materials from the work surface are swept away by the dielectric and the greater volume of un-flushed molten substances in the IEG (inter electrode gap) have undergone the re-solidification process and are finally deposited on the upper surface of the workpiece.
From Figs. 17a and b, it is observed that WRLT increases with increase in the pulse on-length. The increased value of the pulse on-length is the reason a)
b)
Fig. 15. Influence of presence and absence of powder on PMEDDSG-generated surface; a) with Al powder, PC = 5 gm/l of Al
powder, b) without powder (WS = 550 RPM, I = 2 A, DC = 0.80, Ton = 300 µs)
a)
b)
Fig. 16. Influence of current on PMEDDSG-generated surface; a) I = 6 A, t = 30 µm, b) I = 10 A, t = 49 µm (Ton = 200 µs,
DC = 0.80, WS = 550 RPM, PC = 5 gm/l of Al powder)
a)
b)
Fig. 17. Influence of pulse on-duration on PMEDDSG-generated surface; a) Ton = 200 µs, t = 30 µm, b) Ton = 300 µs, t = 41 µm
(I = 6 A, DC = 0.80, WS = 550 RPM, PC = 5 gm/l of Al powder)
a)
b)
Fig. 18. Influence of wheel speed on PMEDDSG-generated surface; a) WS = 550 RPM, t = 30 µm, b) WS = 750 RPM, t = 24
for greater thermal softening of the workpiece through heat conduction and hence increases the MRR. In addition, the eroded materials from the work surface are swept away by the dielectric and a greater volume of un-flushed molten substances in the IEG have undergone the re-solidification process and are finally deposited on the upper surface of the workpiece.
From the Figs. 18a and b, it is observed that WRLT decreases with increase in wheel speed. The increase in wheel speed is the reason for efficient dielectric flushing in the IEG, which reduces the deposition of re-solidified ejected particles on a work-surface and also reduces the possibilities of arcing.
a)
b)
Fig. 19. Influence of duty cycle on PMEDDSG-generated surface; a) duty cycle = 0.80, t = 30 µm, b) duty cycle = 0.85, t = 39 µm (I = 6 A, Ton = 200 µs, WS = 550 RPM, PC = 5 gm/l of Al powder)
From the Figs. 19a and b, it is observed that WRLT increases with increasing the duty cycle. Pulse on-duration remains constant throughout the experiment and duty cycle increases due to decreased pulse off-time. This means less time is available for dielectric flushing to sweep the ejected particles from the IEG and for the deionization of the dielectric. Thus, continuous sparking takes place and a greater volume of un-flushed molten substances in IEG have undergone the re-solidification process and are finally deposited on the upper surface of the workpiece.
7 CONCLUSIONS
The following conclusions can be drawn, based on the analysis of outcomes, interpretations of Figs. 2 to 9, the optimization approach, and analysis of SEM images:
1. MRR is greater in powder-mixed dielectric fluid in comparison to dielectric fluid without it, during the PMEDDSG of Ti-6Al-4V. Some authors, i.e. Choudhury et al. [2], Koshy et al. [3] and [4], obtained the same results in cut-off grinding mode with different workpiece materials.
2. Ra is less in powder-mixed dielectric fluid in
comparison to dielectric fluid without it, during the PMEDDSG of Ti-6Al-4V.
3. The PMEDDSG is an efficient process for shaping the hard material. This process has the advantage of reducing the recast layer thickness by the grinding action due to abrasion.
4. The highest MRR is achieved when current, pulse on-time and wheel speed are at peak levels. Similarly, The highest MRR is achieved when the duty cycle is at the lowest level.
5. The highest Ra is achieved when current, pulse on-time and duty cycle are at peak levels. Similarly, The highest Ra is achieved when wheel speed is at the lowest level.
6. The best results (higher MRR and lower Ra) are obtained in the PMEDDSG of Ti-6Al-4V with Al powder-mixed dielectric fluid.
7. Surface cavities are wider and bigger with the increase in current, pulse-duration and duty cycle. Similarly, surface cavities are narrower and smaller with the increase in wheel-speed. 8. Surface cavities are smaller and smoother due to
the presence of aluminium powder in comparison to dielectric fluid without it; this is confirmed from studying the SEM images. These images were captured from specimens/workpieces operated with Al powder (powder concentration = 5 gm/l) and without aluminium powder (powder concentration = zero gm/l) during PMEDDSG process of Ti-6Al-4V.
9. White-recast layer thickness is increased by increase in current, pulse on-length and duty cycle. Similarly, white-recast layer thickness is decreased by increase in wheel speed.
11. It is observed that based on WPC approach the improvement in MRR from 0.521 to 1.055 mm³/ min, deterioration in Ra from 2.21 to 4.76 µm and overall improvement in MOPI is 0.93 have been found during the multi-output optimization in PMEDDSG of Ti-6Al-4V with Al powder-mixed dielectric fluid. These results are obtained when the optimum process parameter combination (PC2I3Ton2WS3DC3) results were compared with an initial process parameter combination (PC1I1Ton1WS1DC1)results.
12. It is observed through ANOVA analysis in the WPC approach that the percentage contribution of various process parameters is powder concentration (19%), pulse on-time (1.5%), wheel speed (1.5%), duty cycle (7%) and current (61%) for the responses under the multi-output optimization (maximization of MRR and minimization of Ra) in the PMEDDSG of Ti-6Al-4V. The most significant parameters that affect the PMEDDSG process are current and powder concentration.
8 NOMENCLATURE
C [%] Contribution percentage
CL Confidence level
DC Duty cycle
DOF Degree of freedom
EDM Electrical discharge machining
EDDG Electro-discharge diamond grinding
EDDSG Electro-discharge diamond surface
grinding
IEG Inter electrode gap
F F ratio
K-AGENT Kroll’s agent
Log S Value S/N Ratio
SS / MS Sum of squares / Mean squares
Ton [µs] Pulse on-time / Pulse-duration / POT
WP / WOP With powder / Without powder
WS Wheel speed
9 REFERENCES
[1] Chen, S.L., Yan, B.H., Huang, F.Y. (1999). Influence of kerosene and distilled water as dielectrics on the electric discharge machining characteristics of Ti– 6A1–4V. Journal of Materials Processing Technology,
vol. 87, no. 1-3, p. 107–111, DOI:10.1016/S0924-0136(98)00340-9.
[2] Choudhury, S.K., Jain, V.K., Gupta, M. (1999). Electrical discharge diamond grinding of high-speed steel. Machining Science and Technology:
An International Journal, vol. 3, no.1, p. 91-105, DOI:10.1080/10940349908945685.
[3] Koshy, P., Jain, V.K.,Lal, G.K. (1996). Mechanism of material removal in electrical discharge diamond grinding. International Journal of Machine Tools and Manufacture, vol. 36, no.10, p. 1173-1185, DOI:10.1016/0890-6955(95)00103-4.
[4] Koshy, P., Jain, V.K., Lal, G.K. (1997). Grinding of cemented carbide with electrical spark assistance.
Journal of Materials Processing Technology, vol. 72, no. 1, p. 61-68, DOI:10.1016/S0924-0136(97)00130-1. [5] Kansal, H.K., Sehijipal S., Kumar, P. (2005). Parametric
optimization of powder mixed electrical discharge machining by response surface methodology. Journal of Materials Processing Technology, vol.169, no. 3, p. 427-436, DOI:10.1016/j.jmatprotec.2005.03.028. [6] Habib, S.S. (2009). Study of the parameters in
electric discharge machining through response surface methodology approach. Applied Mathematical Modelling, vol. 33, no. 12, p. 4397-4407, DOI:10.1016/j.apm.2009.03.021.
[7] Hewidy, M.S., El-Taweel, T.A., El-Safty, M.F. (2005). Modelling the machining parameters of wire electrical discharge machining of Inconel 601 using RSM, Journal of Materials Processing Technology, vol. 169, no. 2, p. 328-336, DOI:10.1016/j.jmatprotec.2005.04.078. [8] Lin, J.L., Lin, C.L. (2002). The use of orthogonal
array with grey relational analysis to optimize the electrical discharge machining process with multiple performance characteristics. International Journal of Machine Tools & Manufacture, vol. 42, no. 2, p. 237-244, DOI:10.1016/S0890-6955(01)00107-9.
[9] Hotelling, H. (1933). Analysis of a complex of statistical variables into principal components. Journal of Educational Psychology, vol. 24, no. 6, p. 417, DOI:10.1037/h0071325.
[10] Su, C.T., Tong, L.I. (1997). Multi-response robust design by principal component analysis, Total Quality Management, vol. 8, no. 6, p. 409-416, DOI:10.1080/0954412979415.
[11] Antony, J. (2000). Multi-response optimization in industrial experiments using Tagchi’s quality loss function and principal component analysis,
Quality and Reliability Engineering International,
vol. 16, no. 1, p. 3-16, DOI:10.1002/(SICI)1099-1638(200001/02)16:1<3::AID-QRE276>3.0.CO;2-W. [12] Liao, H.-C. (2006). Multi-response optimization using
weighted principal component, International Journal of Advanced Manufacturing Technology, vol. 27, p. 720-725, DOI:10.1007/s00170-004-2248-7.