0 INTRODUCTION
The burning of fossil fuels has been recognized as the main cause of serious environmental issues, including the greenhouse effect, ozone layer depletion and acid rain [1]. Renewable fuels, such as wind, solar, compressed air, etc., are used as obvious solutions [2]. With respect to environmental protection, Shafiee and Topal believe that oil and gas reserves may be diminished in 2042; this enhances the competition in the field of renewable energy vehicles [3]. Because of its low cost, safe maintenance, easy access, recyclability, higher energy storage density and long lifespan, compressed air energy storage will be an advanced and rapidly developing field in the future. The flow characteristics of compressed air in equipment have been studied [4] to [6].
As important equipment in the compressed air energy storage system, the compressed air engine (CAE) is utilized to convert the energy stored as compressed air into mechanical energy. Furthermore, the CAE has been used in many fields, e.g. pneumatic systems, vehicles, cryogenic engineering, and vacuum machinery. At the beginning of the 20th century, the
CAE began to be used to power mining locomotives in the United States and Europe [7]. However, the energy efficiency and output power of the CAE are limited, which restricts its application and popularization [8].
To improve energy the efficiency and output power of CAE, Motor Development International (MDI), a banner company in the field of CAE, has developed a set of novel CAEs over the previous ten years [9]. Ahmed proposed that steam be replaced by double-acting steam, and the reciprocating motion of the piston be governed through flywheel using
a solenoid valve [10]. Maghoub and Craighead developed the idea of controlling the gas inlet and outlet of the piston-type pneumatic motor to meet the requirements of driven components by either a PID or H-bridge control method [11]. Huang et al. put forward a hybrid pneumatic-power system that was able to ensure that the internal-combustion engine could work at its optimal condition [12]. Pirc et al. presented a universal model to analyses the energy system in full detail [13]. Dovjak et al. analysed energy use for the cooling environment [14]. Hammadi et al. used a sequentially coupled approach to optimize power modules [15]. In order to investigate the design method of the CAE, multi-objective optimization was used to obtain the relation of maximum specific work with engine power and engine structure parameters [16].
However, thus far, all the studies on the CAE have been based on the analysis of certain parameters, so it is difficult to maintain the CAE working at optimized conditions with load variation.
In this paper, firstly, based on the working principles of the piston CAE, a mathematical model was established. Next, through the simulation analysis, the influences of the bore-to-stroke ratio, intake pressure and valve lift on the performance of the engine were obtained. Finally, an improved NSGA-II algorithm was introduced to the optimization study on the piston CAE. This research can be referred to in the design optimization of the piston CAE and provided a method for the optimization study.
Optimization of the Energy Efficiency
of a Piston Compressed Air Engine
Yu, Q. – Cai, M. – Shi, Y. – Fan, Z. Qihui Yu – Maolin Cai – Yan Shi* – Zichuan Fan
Beihang University, School of Automation Science and Electrical Engineering, China
To improve the energy efficiency and output power of the piston compressed air engine (CAE), a mathematical model of its working process was set up. With the use of the MATLAB/Simulink software for simulation, the influences of the bore-to-stroke ratio, intake pressure and valve lift on the performance of the engine were obtained for the analysis of the energy efficiency and the output power. Moreover, to optimize the energy efficiency of the engine with the given output power, an improved NSGA-II was introduced, and a series of optimization intake pressures and valve lifts was obtained. When the output power value is about 2 kW, the intake pressure and the intake valve lift can be set to 1.99 MPa and 9.99 mm, the energy efficiency is highest: 31.17%. Finally, that the improved NSGA-II is superior to NSGA-II in proximity and diversity has been proved. This research can be referred in the optimization of the piston CAE and provides a method for the energy efficiency optimization study.
1 WORKING PRINCIPLES OF THE PISTON CAE
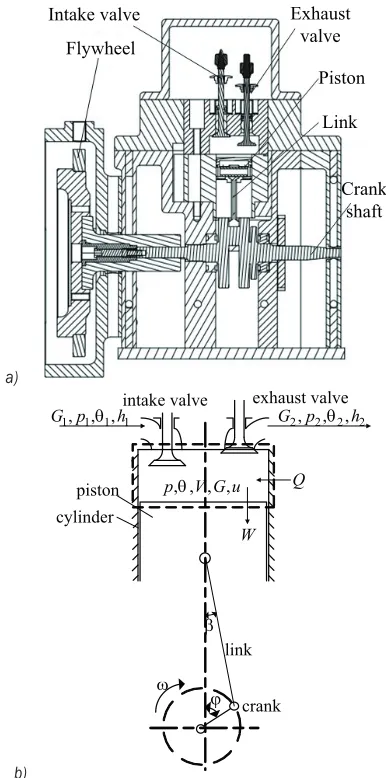
As shown in Fig. 1, the piston CAE consists of an intake valve, an exhaust valve, a piston, a cylinder, a link, and a crank. It is obvious that working process of the piston CAE is a thermodynamic process composed of the intake and the exhaust processes.
1. The intake process: when piston reaches its top dead centre (TDC), the intake valve opens at the beginning of the engine cycle, the compressed air flows into the cylinder, and the intake valve closes entirely at the crank angle of 100°, leaving 80° for isentropic expansion. During this process, the exhaust valve stays closed, and the piston is pushed from the top dead centre (TDC) toward the bottom dead centre (BDC) by the charged compressed air, producing the power stroke. The downward movement of piston produces work while the compressed air flows into the cylinder during the intake process, and even after the intake valve closes during the isentropic expansion process [17].
2. The exhaust process: The exhaust valve opens when the piston reaches the BDC. During the process, the intake valve remains closed. The piston moves from the BDC toward the TDC to discharge the compressed air from the cylinder. The cylinder pressure during the exhaust process is always greater than the ambient pressure to facilitate discharging.
2 MODELLING AND SIMULATION OF THE PISTON CAE
2.1 Mathematical Modelling of the Piston CAE
The engine cylinder can be considered to be a thermodynamic system that is composed of a cylinder cover, piston head and cylinder wall; to facilitate this research, the following assumptions were made: 1. The working fluid (air) of the system follows all
ideal gas laws.
2. There is no leakage in the working process. 3. The flow of air moving into and out of the
cylinder is a stable one-dimensional flow.
4. The viscous friction force on the piston of the compressed air engine is neglected.
The energy equation can be illustrated by the following equation:
d
d mC
S hG
h G p dV
d uG v
a
c θ
ϕ
α ϕ θ θ
ω ω
ω ϕ ω
= − − +
+ − −
1 2
1 1
[ ( )( )
]. (1)
a)
Intake valve Exhaust valve
Piston Link
Crank shaft Flywheel
b)
ϕ β
ω
intake valve exhaust valve
piston cylinder
link
crank
Q
W
1, , ,1 1 1
G p θ h G p2, , ,2θ2 2h
, , , ,
p V G uθ
Fig. 1. The thermodynamic analysis diagram of the compressed air engine; a) structure of the piston CAE, b) configuration of the
piston CAE
The full mathematical process about Eq. (1) can be obtained in Appendix A.
Assuming that the compressed air velocity is proportional to the average piston speed UP, and heat transfer coefficient a can be expressed by the following equation [18]:
a= V Rp DS p Up
−
− 0 1129 4
0 2 3
0 8 0 8 0 594
. ,
.
. . .
π θ (2)
Up= V Rp DS n
⋅ 4
30 1 3 π
/
/ . (3)
dm
dt =G. (4)
The flow equation for the air flow through a restriction can be written as follows [19] and [20]:
G when p p k Ap k R k when p p L H k k H H k k L H = ≤ + + − + − , , 2 1 2 1 1 1 1 θ >> + − − − + 2 1 2 1 1 2 1 k Ap k k R p p p p k k H H L H k L H k k ( ) θ ( ) ( )
. (5)
Where the subscripts H and L stand for the upstream and downstream of the compressed air, respectively. The adiabatic exponent κ was set to 1.4.
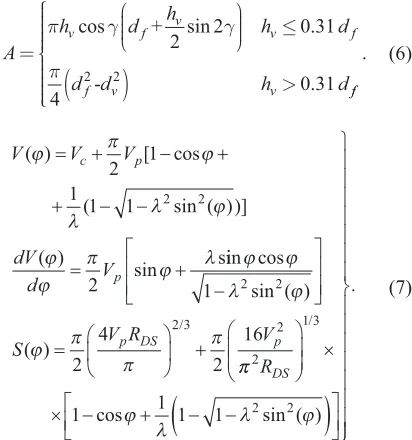
The intake valve and exhaust effective areas are dependent on the cam profile, which can be expressed by the following equation:
A h d
h h d
d d h d
v f v v f
f v v
=
≤
(
)
>π γ γ
π
cos sin .
. +
-2 2 0 31
4 2 2 0 31 ff
. (6)
V V V
dV
d V
c p
p
( ) [ cos
( sin ( ))]
( ) sin s
ϕ π ϕ λ λ ϕ ϕ ϕ π ϕ λ = + − + + − − = + 2 1
1 1 1
2
2 2
iin cos sin ( )
( ) / ϕ ϕ λ ϕ ϕ π π π 1 2 4 2 16 2 2
2 3 2
− = +
S V Rp DS Vp
ππ ϕ λ λ ϕ 2 1 3 2 2
1 1 1 1
RDS × × − +
(
− −)
/cos sin ( )
. (7)
The structure equation and motion equation can be given by the following equations:
The full mathematical process of Eq. (7) can be obtained in Appendix B.
The state equation can be illustrated by the following equation:
p Vc c=m Rc θc. (8)
Thereafter, the objectives and comparisons are made with energy efficiency and output power, whose definitions are summarized as following equations:
η = W
p Vs slnp ps a, (9)
Pe T n= e⋅ ⋅ ⋅
30
9550 π , (10)
where
Te=
∫
pdV2π . (11)
2.2 Simulation Research of the Piston CAE
From the discussion above, it can be found that working characteristics of the engine are determined by 13 parameters as mentioned above. The initial values of the 13 parameters are shown in Table 1, bore-to-stroke ratio, valve lift, intake pressure are variables. Simulation were performed using the software MATLAB.
Table 1. Engine specifications
Parameter Value
Intake pressure (single-cylinder) 1,000,000 Pa
Atmosphere pressure 100,000 Pa
The clearance volume 3e–5 m³
Intake valve open 0°
Intake valve close 100°
Intake valve lift 6 mm
Exhaust valve lift 8 mm
Exhaust valve open 180°
Exhaust valve close 300°
Bore-to-stroke 1
Displaced volume 100 ml
Cylinder wall temperature 293 K
Engine speed 800 rpm
2.3 Gas state Variations of the Cylinder
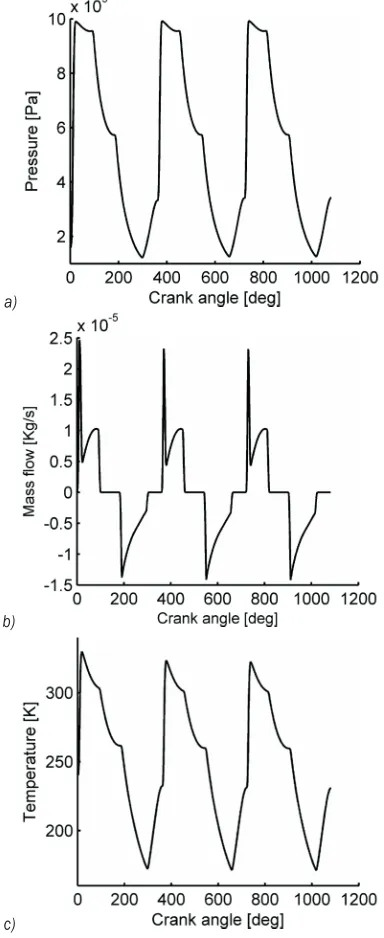
The main dynamic characteristics of the CAE were obtained by analysing the mathematical model using MATLAB/Simulink. The pressure, mass flow and temperature curves of compressed air in the cylinder can be shown in Figs. 2a to c, respectively.
slight increase follows. Meanwhile, the pressure of the cylinder rapidly increases to the intake pressure, after a slight decrease, the pressure of the cylinder drops dramatically. At this time, because of expansion of the compressed air in the cylinder, the temperature of the cylinder drops from its peak.
a)
b)
c)
Fig. 2. Simulation curves of the cylinder; a) pressure; b) mass flow; and c) temperature
When the piston leaves its TDC and the intake valve is closed at a 100° crank angle, compressed air stops flowing into the cylinder, so the mass flow of compressed air drops to zero. Depending on its
expansion, the compressed air in the cylinder keeps driving the piston until the piston arrives to its BDC. Meanwhile, the pressure and temperature of the cylinder drops dramatically.
When the piston reaches its BDC and the outtake valve opens at a 180° crank angle, the compressed air is discharged from the cylinder, and the mass flow decreases from its top. Meanwhile, the pressure and temperature of the cylinder drops to their lowest levels.
When the piston leaves its BDC and the outtake valve is closed at a 300° crank angle, compressed air stops being discharged from the cylinder, so the mass flow of compressed air drops to zero. Depending on the inertia of the flywheel, the piston compresses the air in the cylinder, then the pressure and temperature of the cylinder increase slowly.
The engine revolves and repeats the process discussed above; mechanical power can be output continuously.
From Fig. 2c, it is obvious that the temperature of the cylinder can reach 231 K, which may ice up in cool, moist climates, so a heat exchanger must be used.
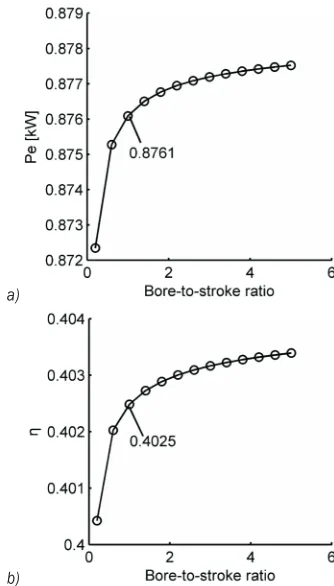
2.3.1 Influences of the Bore-to-Stroke Ratio
The bore-to-stroke ratio, as one of the main geometrical parameter, plays the most prominent role on performance of the piston CAE. The output power and the energy efficiency of the compressed air engine were obtained at various bore-to-strokes ratios.
The relationship of the performance (i.e. output torque power, Pe, and energy efficiency, η) and the bore-to-stroke ratio of the engine are shown in Fig. 3.
When the bore-to-stroke ratio is smaller than 1, the output power and the energy efficiency increase sharply to 0.8761 kW and 40.25%, respectively, with an increase in the to-stroke ratio. When the bore-to-stroke ratio is greater than 1, the output power and the energy efficiency increase slowly with an increase in the bore-to-stroke ratio.
a)
b)
Fig. 3. a) Output power and b) energy efficiency of the CAE at different bore-to-stroke ratio
a)
b)
Fig. 4. The output power and the energy efficiency of the CAE at different intake pressure
2.3.2 Influences of the Intake Pressure
Intake pressure is an critical parameter, which determines the air mass flow of the engine, and is vital for improving the performance of the engine. For the CAE, the intake pressure can be adjusted according to the loading system. The influence of the intake pressure on the performance of the engine can be obtained through simulation and analysis, and the influence of the intake pressure on the energy efficiency and the output power can be described in Fig. 4.
As shown in Fig. 4, with an increase in the intake pressure, the output power increases; however, the energy efficiency decreases. Thus, a higher intake pressure can increase the output power of the piston CAE, but decrease the energy efficiency of the piston CAE. That is because the compressed air in the cylinder cannot expand sufficiently.
2.3.2 Influences of the Valve Lift
The valve lift is another important parameter that greatly affects the air mass flow. The influence of the valve lift on the energy efficiency and the output power can be illustrated in Fig. 5.
a)
b)
As shown in Fig. 5, with an increase in the valve lift, the output power increases; however, the energy efficiency decreases. So, a bigger valve lift can increase the output power of the piston CAE, but decrease the energy efficiency of the piston CAE. That is also because the compressed air in the cylinder cannot expand sufficiently.
3 MULTI-OBJECTIVE OPTIMIZATION BY IMPROVED NSGA-II
In real operations, the performance of the engine needs to be adjusted to cope with demands of the loading system. To achieve a given output power and high energy efficiency, the intake pressure and the valve lift can be optimized, which is a typical multi-objective engineering optimization.
In this paper, two optimization objectives, higher output power and higher energy efficiency, have been considered. As discussed above, it is obvious that the energy efficiency decreases with the increase of the output power. The objectives in this paper is to maximize the output power and the energy efficiency, so a single optimization solution will not serve this purpose, as these objectives are conflicted in nature. Furthermore, the output power of the engine depends on its speeds and road conditions. As a conclusion, the performance optimization of the engine requires a multi-objective optimization.
3.1 The Improved NSGA-II
The genetic algorithm (GA) is a powerful, general-purpose optimization tool, widely used to solve optimizing problems in the mathematics, engineering, etc. GA works with a range of feasible solutions; therefore, it can be used in multi-objective optimization problems to obtain a number of solutions simultaneously. NSGA-II, proposed by Kalyanmoy, is a fast and state-of-the-art multi-objective GA [21]. The crossover and mutation operators remain as usual, but selection operator works differently from that of a simple GA. Selection is done with the help of a crowded-comparison operator, based on ranking (according to non-domination level), and crowding distance. The crowding distance is briefly explained below [22].
The crowding distance is crucial to population selection. The individuals are selected based on the rank and the crowding distance. The crowding distance can be calculated by following equations:
P i P i f P i f
P i f P i f
dis
[ ] ( [ ] [ ] )
( [ ] [ ] ),
= + ⋅ − − ⋅ +
+ + ⋅ − − ⋅
1 1 1 1
1 2 1 2 (12)
where, P[i]dis is the crowding distance of individual i, P[i]·fis the function value of the individual i with the sub-goal f ;
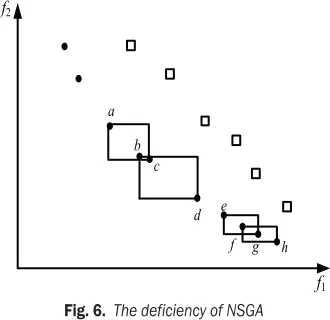
The calculation method above fails to maintain good diversity from Eq. (12). Some poor diversity individuals may be kept. The problem can be expressed by Fig. 6.
As shown in Fig. 6, the crowding distance of individual b and c is small, but both b and c are relatively far away from the other individuals. If the crowding distance of individual b and c is calculated with NSGA-II method, both individual b and c will be reserved, or both are eliminated. However, in the improved NSGA-II method, either individual b or c is reserved. In the same case, individual e, f and g are eliminated with NSGA-II method. However, these individuals are useful in diversity. Therefore, the NSGA-II plays a significant role in calculating the crowding distance.
f1
f2
b a
c
d e f g h
Fig. 6. The deficiency of NSGA
To guarantee a good diversity of the individual point, the following questions must be solved.
1. What is the definition of the threshold value about adjacent individuals?.
2. Which individual is selected when the adjacent individual distance is less than the threshold value?
Firstly, the minimum and the maximum extreme endpoints are found in current elitist sorting. Then the distance of the two extreme end points are calculated which indicated by dmax. The threshold value can be
written by:
δ = × d
num max ,
2 (13)
where, num is the number of individual.
f1
f2
0
n a
b c
d e
Fig. 7. The crowding distance calculation and individual selection
As shown in Fig. 7, if the Euclidian distance between the individual a or b is less than or equal to the threshold value, adjacent individual c and d are found, and the centre point e, between c and d, can be obtained. If the distance between a and e is less than e and b, the individual b is deleted.
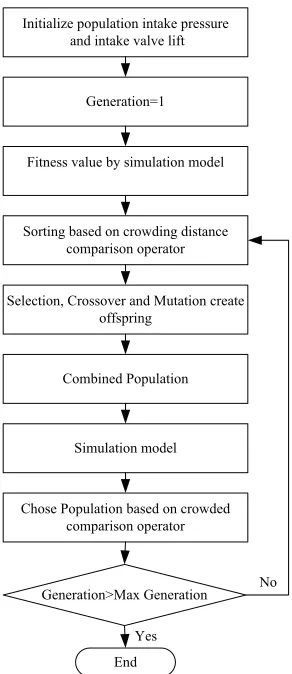
Initialize population intake pressure and intake valve lift
Generation=1
Fitness value by simulation model
Sorting based on crowding distance comparison operator
Selection, Crossover and Mutation create offspring
Combined Population
Chose Population based on crowded comparison operator
Generation>Max Generation
End Simulation model
No
Yes
Fig. 8. Flow chart of parameters optimization process based on NSGA-II
3.2 Optimization of the Piston CAE Performance Using the Improved NSGA-II
To optimize the piston CAE with the improved NSGA-II, the fitness value and the objective function values should first be provided.
Therefore, there is a need for a function or equation, which relates the decision variable with the objective. In the present study, objectives are maximization of the output power and energy efficiency. Because the bore-to-stroke ratio and the valve timing are constant values in the CAE-operated piston, the decision variables are the intake pressure and the intake valve lift. Based on the improved NSGA-II algorithm, the relationship of the objectives and the decision variables can be obtained through analysis and simulation of the mathematical model using MATLAB/Simulink.
The flow chart of the improved NSGA-II is shown in Fig. 8.
3.3 Results and Analysis
In this paper, the objectives are to maximize the output power and the energy efficiency. However, the NSGA-II algorithm is used to calculate the minimization of the inverse of the output power and the energy efficiency. Thus, in order to convert the two objectives to minimization, the functions should be modified, which are given below.
Objective 1 = –Pe . (14) Objective 2 = –η . (15) The range and the step length of the two decision variables (i.e. the intake pressure and the intake valve) are different.
In this paper, the range of the intake pressure is between 1 and 3 MPa; the range of the intake valve lift is between 3 and 10mm.
2 kW, the intake pressure and the intake valve lift can be set 1.99 MPa and 9.99 mm respectively, the energy efficiency is highest at 31.17%.
The non-dominated solution set, obtained over the entire optimization procedure, is shown in Fig. 9. It is obvious that the formation of the Pareto-optimal front determines the final set of solutions. Since none of the solutions in the Pareto-optimal front is absolutely better than any others, anyone of them is an acceptable solution. The best choice of one solution is determined by the requirement output. From optimal combination of parameters in Table 3, the intake valve lifts value distribute from 9 to 10 mm, while the intake pressure value varies between the maximum value and minimum value. Therefore, regulating intake pressure is a major method to meet variable speeds and road conditions. Appropriate adjustment of the intake valve lift can improve energy efficiency.
Fig. 9. Improved NSGA-II Pareto-optimal set
To validate the performance of the improved NSGA-II, Generational Distance (GD) is introduced to estimate the algorithm convergence performance [23]:
GD
popsize i di
popsize
= 1
∑
= 21 , (16)
where, popsize is the number of vectors in the set of non-dominated solutions found thus far, di is the Euclidean distance (measured in objective space) between each of the nearest member of the Pareto-optimal set. It is clear that when the value of GD is 0, all the elements generated are in the Pareto-optimal set. Therefore, any other values will indicate how “far” we are from the global Pareto front of our problem.
Schott [24] proposed a metric to measure the range variance of neighbouring vectors in the non-dominated vectors. The metric is defined as:
SP
popsize i d di
popsize =
−
∑
=(
−)
1 1
2
1 , (17)
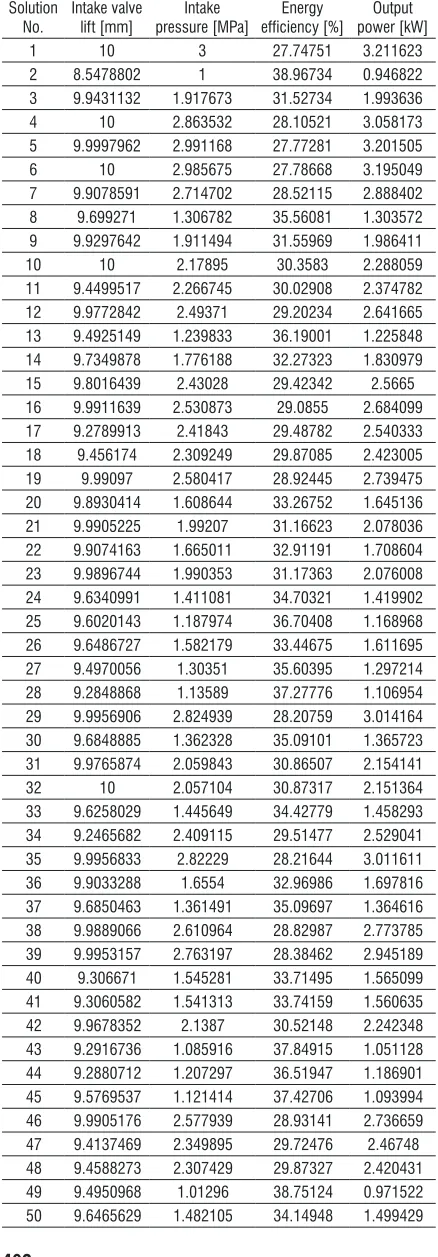
Table 3. Optimal combination of parameters
Solution No.
Intake valve lift [mm]
Intake pressure [MPa]
Energy efficiency [%]
Output power [kW]
1 10 3 27.74751 3.211623
2 8.5478802 1 38.96734 0.946822
3 9.9431132 1.917673 31.52734 1.993636
4 10 2.863532 28.10521 3.058173
5 9.9997962 2.991168 27.77281 3.201505
6 10 2.985675 27.78668 3.195049
7 9.9078591 2.714702 28.52115 2.888402 8 9.699271 1.306782 35.56081 1.303572 9 9.9297642 1.911494 31.55969 1.986411
10 10 2.17895 30.3583 2.288059
11 9.4499517 2.266745 30.02908 2.374782 12 9.9772842 2.49371 29.20234 2.641665 13 9.4925149 1.239833 36.19001 1.225848 14 9.7349878 1.776188 32.27323 1.830979 15 9.8016439 2.43028 29.42342 2.5665 16 9.9911639 2.530873 29.0855 2.684099 17 9.2789913 2.41843 29.48782 2.540333 18 9.456174 2.309249 29.87085 2.423005 19 9.99097 2.580417 28.92445 2.739475 20 9.8930414 1.608644 33.26752 1.645136 21 9.9905225 1.99207 31.16623 2.078036 22 9.9074163 1.665011 32.91191 1.708604 23 9.9896744 1.990353 31.17363 2.076008 24 9.6340991 1.411081 34.70321 1.419902 25 9.6020143 1.187974 36.70408 1.168968 26 9.6486727 1.582179 33.44675 1.611695 27 9.4970056 1.30351 35.60395 1.297214 28 9.2848868 1.13589 37.27776 1.106954 29 9.9956906 2.824939 28.20759 3.014164 30 9.6848885 1.362328 35.09101 1.365723 31 9.9765874 2.059843 30.86507 2.154141
32 10 2.057104 30.87317 2.151364
where,
d f x f x
f x f x i j
i j
i j
i j
= −
+ −
=
min ( ) ( )
( ) ( ) , ( , , ,...,
1 1
2 2
1 2 nn), (18)
d is the mean of the crowding distance.
In the same situation, the performance of the improved NSGA-II had been compared with the NSGA-II by the use of evaluating indicators above. The result is shown in Table 4.
Table 4. Performance compared
GD SP
NSGA-II 0.029876 0.31241
Improved NSGA-II 0.022276 0.17367
It is obvious that the improved NSGA-II is superior to NSGA-II in proximity and diversity.
4 CONCLUSIONS
In this paper, a mathematical model of the working process of the piston CAE was proposed. The working characteristics of the piston compressed air engine were obtained. To achieve the given output power and optimization energy efficiency of the CAE, the improved NSGA-II method was introduced, and the influences of the bore-to-stroke ratio, intake pressure and valve lift on the performance of the engine were obtained. The conclusions are summarized as follows: 1. The improved NSGA-II can be used in the
optimization of the piston engine, and it is superior to NSGA-II in proximity and diversity. 2. When the bore-to-stroke ratio is smaller than
1, the output power and the energy efficiency increase sharply to 0.8761 kW and 40.25% respectively, with an increase in the bore-to-stroke ratio. When the bore-to-bore-to-stroke ratio is greater than 1, the output power and the energy efficiency increase slowly with an increase in the bore-to-stroke ratio.
3. With an increase in the intake pressure or the valve lift, the output power increases, however the energy efficiency decreases. However, regulating intake pressure is a major method to meet variable speeds and road conditions, appropriate adjustment of the intake valve lift can improve energy efficiency.
4. When the output power value is about 2 kW, the intake pressure and the intake valve lift can be set
1.99 MPa and 9.99 mm respectively, the energy efficiency is highest, 31.17%.
This research can be referred in the optimization of the piston CAE and provided a method for the optimization study.
5 ACKNOWLEDGMENT
The research work presented in this paper is financially supported by a Grant (51205008) of the National Natural Science Foundation of China.
6 APPENDIX A
According to the first law of thermodynamics, the energy equation can be expressed as:
dU dt
Q
dt h mdt h mdt W dt =δ − 2δ 2+ δ −δ
1 1 . (A1)
The heat capacity of the engine body made of metal is much greater than that of the air, so the temperature of the internal walls can be considered to be constant. The heat transfer is:
δQ dt=α ϕ θ α ϕ θS( )∆ = S( )( a−θ)). (A2)
The internal energy of gas can be expressed as: dU d mu= ( )=mdu udm+ . (A3) For ideal air, it can be yielded as:
du C d= v θ. (A4)
Substituting Eq. (A4) to Eq. (A3) yields:
dU mC d= v θ+udm. (A5) The work done by the compressed air is described by:
dW p dV= c . (A6)
Substituting Eq. (A2) to (A6) into Eq. (A1) yields:
d
dt mC aS hG
h G p dV
dt uG
v a
c
θ = ϕ θ −θ − +
+ − −
1
2
1 1
[ ( )( )
], (A7)
where,
δdtm G δm
dt G h h G dmdt
1
1 2 2 2
The relationship time and angle can be described by:
ω=d dt. (A8)ϕ
Substituting Eq. (A.8) into Eq. (A.7) yields:
d
d mC
S hG
h G p dV d uG v
a
c
θ ϕ
α ϕ θ θ
ω ω
ω ϕ ω
= − − +
+ − −
1 2
1 1
[ ( )( )
]. (A9)
7 APPENDIX B
Fig. 10 shows the piston-crank mechanism.
piston
β
TDC
x y
D
r L
ϕ
Fig. 10. The piston-crank mechanism
From the piston-crank geometry, the piston displacement, y, is given by:
y r L L= + − cosβ−rcos ,ϕ (B1) where β can be expressed as
β=sin−1rsin .ϕ
L (B2)
Substituting Eq. (B2) into Eq. (B1) yields: y r= − +
(
− −)
1 cosϕ 1 1 1 2sin2 ,
λ λ ϕ (B3)
where,
λ =r L. (B4)
The volume can be described by:
V( )ϕ =Vc+πD y2 4. (B5) The relationship between crank radius r and stroke S is expressed as:
Sr=2 .r (B6)
Substituting Eq. (B3) and (B6) into Eq. (B5) yields:
V( )ϕ =Vc+π2Vp1−cosϕ+λ1 1 1
(
− −λ2sin2ϕ)
,(B7) whereVp=π4D S2 r. (B8) The total heat transfer area, S(φ) , is described by: S
( )
ϕ =Ah+Ap+πDy, (B9) where, Ah is the heat transfer area of cylinder head, Ap is the heat transfer area of the piston.In there,
Ah =Ap=π D
4 2. (B10)
Substituting Eq. (B10) and (B3) into Eq. (B9) yields:
S( ) D DSr[ cos
sin .
ϕ π π ϕ
λ λ ϕ
= + − +
+
(
− −)
2 2 1
1 1 1 2
2 2 (B11)
The bore-to-stroke ratio is expressed as:
RDS=D Sr. (B12)
Substituting equations (B12) and (B8) into equation (B11) yields:
S V R V
R
p DS p
DS
( )
cos
/ /
ϕ π
π
π π ϕ
λ
=
+
×
× − +
2 4
2 16
1 1
2 3 2
2 1 3
11− 1− 2 2
(
)
λ sin ( ) .ϕ (B13)
8 NOMENCLATURE
A Effective area [m²]
Ah The area of cylinder head [m²] Ap The heat transfer area of piston [m²]
Cv Specific heat at constant volume [718 J/kg·K] df The diameter of the flow channel [m]
dv The diameter of the valve stem [m] G Air mass flow [kg/s]
h Specific enthalpy [J/kg] hv The valve lift [m] k Specific heat ratio
n Crank speed [rad/s] p Pressure [Pa] Pe Output power [kW] r Crank radius [m]
R Gas constant=287 J/[kg·K] RDS Bore-to-stroke ratio S Heat transfer area [m²] Sr The stroke of cylinder [m] Te The effective output torque [N·m] u Specific thermodynamic energy [J/kg] Up The average speed of piston [m/s] V Volume [m³]
Vc The clearance of cylinder [m³] Vp Engine displacement [m³] W Work done per cycle [J] y Piston displacement [m]
α Heat transfer coefficient [W/m²·K] β The angle of link and crank [rad] θ Temperature [K]
ω Crank speed [rad/s] φ Crank angle [rad] η Efficiency
δ The threshold value
γ The cone angle of the valve sealing [°] λ The ratio of crank and link
Subscripts a Atmosphere c Inside cylinder H Upstream L Downstream s Supply 1 Intake 2 Exhaust
9 REFERENCES
[1] [1] Veziroglu, T. N., Sahin, S. (2008). 21st century’s energy: hydrogen energy system. Energy Conversion and Management, vol. 49, no. 7, p. 1820-1831, DOI:10.1016/j.enconman.2007.08.015.
[2] Li, Y., Chen, H., Zhang, X., Tan, C., Ding, Y. (2010). Renewable energy carriers: Hydrogen or liquid air/nitrogen?. Applied Thermal Engineering, vol. 30, no. 14-15, p. 1985-1990, DOI:10.1016/j. applthermaleng.2010.04.033.
[3] Shafiee, S., Topal, E. (2009). When will fossil fuel reserves be diminished? Energy Policy, vol. 37, no.1, p.181-189, DOI:10.1016/j.enpol.2008.08.016.
[4] Bergant, A., Kruisbrink, A., Arregui, F. (2012). Dynamic behavior of air valves in a large-scale pipeline apparatus. Strojniški vestnik - Journal of Mechanical Engineering, vol. 58, no. 4. p. 225-237, DOI:10.5545/ sv-jme.2011.032.
[5] Vukčević, V., Werner, A., Degiuli, N. (2012).
Application of smoothed particle hydrodynamics
method for simulating incompressible laminar flow. Transactions of Famena, vol. 36, no. 4, p. 1-13. [6] Dudić, S.P., Ignjatović, I.M., Šešlija, D.D., Blogojević,
V.A., Stojiljković, M.M. (2012). Leakage quantification
of compressed air on pipes using thermovision. Thermal Science, vol. 16, Suppl. 2, p. 555-565, DOI:10.2298/ TSCI120503191D.
[7] Gairns J.F. (1904). Industrial locomotives for mining, factory, and allied uses. Part II.-Compressed air and internal combustion locomo-tives. Cassier’s Magazine, vol. 16, p. 363-377.
[8] Creutzig, F., Papson A., Schipper, L.K., Kammen, D.M. (2009). Economic and environment evaluation of compressed air cars. Environmental Research Letters, vol. 4, no. 4, p. 044011, DOI:10.1088/1748-9326/4/4/04011.
[9] MDI Enterprises S.A. (2013). from http://www.mdi.lu/ english/, accessed on 2013-08-13.
[10] Afzal, A. (2011). A pilot compressed air engine. Energy & Environment, vol. 22, no. 8, p. 1105-1113, DOI:10.1260/0958-305X.22.8.1105.
[11] Mahgoub, H.M., Craighead, I.A. (1995). Development of a microprocessor-based control system for a pneumatic rotary actuator. Mechatronics, vol. 5, no. 5, p. 541-560, DOI:10.1016/0957-4158(95)00025-Z. [12] Huang K.D., Tzeng S.C., Ma, W.P. et al., (2005).
Hybrid pneumatic-power system which recycles exhaust gas of an internal-combustion engine. Applied Energy, vol. 82, no. 2, p. 117-132, DOI:10.1016/j. apenergy. 2004.10.006.
[13] Pirc, A., Sekavčnik, M., Mori, M. (2012) . Universal
model of a biomass gasifier for different syngas compositions. Strojniški vestnik - Journal of Mechanical Engineering, vol. 58, no. 5. p. 291-299, DOI:10.5545/sv-jme.2011.101.
[14] Dovjak, M., Shukuya, M., Krainer, A. (2012). Exergy analysis of conventional and low exergy systems for heating and cooling of near zero energy buildings. Strojniški vestnik - Journal of Mechanical Engineering, vol. 58, no. 7-8, p. 453-461, DOI:10.5545/sv-jme. 2011.158.
[15] Hammadi, M., Choley, J.Y., Penas, O., Louati, J., Rivière, A., Haddar, M. (2011). Layout optimization of power modules using a sequentially coupled approach. International Journal of Simulation Modelling, vol. 10, no. 3, p. 122-132, DOI:10.2507/IJSIMM10(3)2.183. [16] Liu, L., Yu, X.L., Hu, J.Q. (2009). Air powered engine
design based on Pareto Frontier. Journal of Zhejiang University (Engineering Science), vol. 43, no. 1, p.123-127, DOI:10.3785/j.issn.1008-973X.2009.01.24. (in Chinese)
[17] Huang, C.Y., Hu, C. K., Yu, C.J., Sung, C.K. (2013). Experimental investigation on the performance of a compressed-air driven piston engine. Energies, vol. 6, no. 3, p.1731-1745, DOI:10.3390/en6031731.
with compressed air. Applied Thermal Engineering, vol. 51, no. 1-2, p. 662-669, DOI:10.1016/j. applthermaleng.2012.10.013.
[19] Cai, M.L. (2007). The flow characteristics of pneumatic components. Hydraulic Pneumatic and Sealing, vol. 27, no. 2, p. 44-48. (In Chinese).
[20] Shi, Y., Cai, M.L. (2011).Working characteristics of two kinds of air-driven boosters. Energy Conversion and Management, vol. 52, p. 3399-3407, DOI:10.1016/j. enconman.2011.07.008.
[21] Kalyanmoy, D. (2002). A fast and elitist multi-objective genetic algorithm: NSGA-II. Transactions on Evolutionary Computation, vol. 6, no. 2, p. 182-197, DOI:10.1007/3-540-45356-3_83.
[22] Atashkari, K., Nariman-Zadeh, N. Gölcü, M., Khalkhalia, A., Jamalia, A. (2007). Modeling and
multi-objective optimization of a variable valve-timing spark-ignition engine using polynomial neural networks and evolutionary algorithms. Energy Conversion and Management, vol. 48, no. 3, p. 1029-1041, DOI:10.1016/j.enconman.2006.07.007.
[23] Van Veldhuizen, D.A., Lamont, G.B. (1998). Evolutionary computation and convergence to a Pareto front. Late Breaking Papers at the Genetic Programming 1998 Conference, University of Wisconsin, Madison, p. 221-228.