in the population sciences published by the Max Planck Institute for Demographic Research Konrad-Zuse Str. 1, D-18057 Rostock · GERMANY www.demographic-research.org
DEMOGRAPHIC RESEARCH
VOLUME 19, ARTICLE 23, PAGES 855-906
PUBLISHED 01 JULY 2008
http://www.demographic-research.org/Volumes/Vol19/23/ DOI: 10.4054/DemRes.2008.19.23
Research Article
Romania:
Childbearing metamorphosis within
a changing context
Cornelia Mure
ş
an
Paul-Teodor H
ă
r
ă
gu
ş
Mihaela H
ă
r
ă
gu
ş
Christin Schröder
This publication is part of Special Collection 7: Childbearing Trends and Policies in Europe (http://www.demographic-research.org/special/7/)
© 2008 Mureşan et al.
1 Introduction 856
2 Trends in fertility 857
2.1 Main developments in birth and fertility 860
2.1.1 Parenting and family size 864
2.1.2 Postponement of childbirth 865
2.1.3 Longitudinal (cohort) perspective 868
2.2 Fertility differentials and determinants 872
2.2.1 Risk patterns for first union, pregnancy, birth, abortion and for second birth
873
2.2.2 Level and timing of first and second births 875
3 Proximate determinants of fertility 880
3.1 Marriage patterns, cohabitation, divorce, and separation, 1985–2004
880
3.1.1 Marriage patterns 880
3.1.2 Cohabitation 882
3.1.3 Divorce 884
3.2 Contraception 884
3.3 Induced abortion: impact on fertility decline and influencing factors 885
3.3.1 Impact of abortion on first birth 887
3.3.2 Impact of abortion on second birth 888
4 Important societal conditions and their impact on fertility and the family
889
4.1 Economic development 890
4.1.1 The socialist regime of Romania 890
4.1.2 Economic evolution 891
4.1.3 Structure of the economy 891
4.1.4 Employment 893
4.1.5 Poverty and living standards in Romania 893
4.2 Changes in social conditions 894
4.3 Values and attitudes toward the family 895
5 Family policies and their impact on fertility behavior and family formation
897
5.1 Family benefits 898
5.2 Maternity leave and childcare 898
5.3 Housing 900
6 Discussion 900
7 Acknowledgements 902
Romania:
Childbearing metamorphosis within a changing context
Cornelia Mureşan1
Paul-Teodor Hărăguş2
Mihaela Hărăguş3
Christin Schröder4
Abstract
In 1989, the socialist regime in Romania collapsed and the state’s coercive pro-natalist policy ended. Since then, fertility has gone through major changes, namely, a massive reduction in fertility and important structural changes: birth postponement, an end to universal childbearing, and the emergence of non-marital births. Family formation has been postponed, but a pattern of early marriage still persists compared to other European countries. Although unmarried cohabitation is rising, it is rarely seen as an alternative to marriage. Modern contraceptive methods are being used increasingly, but traditional contraceptive methods continue to be widespread. Abortion, which was re-legalized in 1989 and made available after two decades of prohibition, has been practiced extensively ever since, especially after first birth. Romanians in 2004 continue to have a universal preference for parenting. However, the preference for the two-child family has declined and the desire for a larger family has become the exception. The transformation of the socialist regime into a democratic society with a market economy generated a socio-economic crisis, and the majority of social benefits have therefore been oriented towards alleviating poverty. Other social policies, including those affecting the family, were redefined. However, fewer funds were made available than for those geared to promote economic development or reduce poverty and, as a consequence, their impact on childbearing has been small.
1 Babeş-Bolyai University, Cluj, Romania. E-mail: [email protected] 2 Babeş-Bolyai University, Cluj, Romania. E-mail: [email protected] 3 Babeş-Bolyai University, Cluj, Romania. E-mail: [email protected]
1. Introduction
In recent decades, all European countries have experienced a similar development in fertility timing and level, namely, childbearing postponement and decreasing fertility. The decline of fertility is most pronounced in the former socialist countries. In the early 21st century these countries had by far the lowest fertility rates compared to other
European countries (Council of Europe 2003). Romania experienced a sharp decline of fertility after 1990. This is not surprising, as the former socialist regime (1967–1989) had applied strong coercive pro-natalist policies to maintain extraordinarily high levels of fertility. The fall of that regime in 1989 also spelled the end of socialist family policies, and a sharp decrease of fertility followed. At the present time, a typical Romanian couple will have one or two children, and the trend is toward single-child families. Although most couples desire to have children, only a few decide to have more than one. Among the higher birth orders we find the strongest decline. However, with a total fertility rate (TFR) of 1.3 children per woman from 1995 onwards, fertility rates seem to have stabilized over the last ten years.
In postponement of childbearing, the formerly socialist countries (especially Romania, Bulgaria, and the countries of the former Soviet Union [FSU]) have the lowest mean maternal age at childbirth. Although Romania and other FSU countries still have a pattern of early childbearing, the country experienced a moderate but continuous increase of maternal age at birth in recent years. Today, Romania is characterized by the postponement of first and second births, especially in the most fertile age group. At the same time, there are only weak signs that postponed births might be recuperated at higher ages.
Romania’s proportion of non-marital births, although rapidly increasing, is about average in Europe. Countries like Estonia or Sweden have the highest rates of non-marital births (56%), followed by Bulgaria, Denmark, and France; the lowest rates are reported by Greece, Italy, and Poland (Council of Europe 2003).
The aim of this contribution is to provide an overview of recent fertility trends (Section 2) and of the proximate determinants of childbearing behavior, such as family formation patterns (marriage, cohabitation, and divorce) and the use of contraceptives and abortions (Section 3). We describe the role of economic and societal changes, and values and attitudes towards the family in Romania (Section 4), followed by a review of family policies and their impact on fertility behavior and family formation (Section 5). The chapter concludes with a summary and brief discussion of the need for a demographic policy in Romania.
2. Trends in fertility
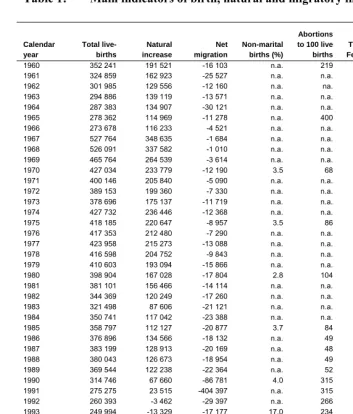
Table 1: Main indicators of birth, natural and migratory increase, and fertility Calendar year Total live- births Natural increase Net migration Non-marital births (%) Abortions to 100 live births Total Period Fertility Rate Period mean age at birth
1960 352 241 191 521 -16 103 n.a. 219 2.34 26.7
1961 324 859 162 923 -25 527 n.a. n.a. 2.18 26.3
1962 301 985 129 556 -12 160 n.a. na. 2.04 26.2
1963 294 886 139 119 -13 571 n.a. n.a. 2.01 26.1
1964 287 383 134 907 -30 121 n.a. n.a. 1.96 26.2
1965 278 362 114 969 -11 278 n.a. 400 1.91 26.1
1966 273 678 116 233 -4 521 n.a. n.a. 1.90 26.0
1967 527 764 348 635 -1 684 n.a. n.a. 3.67 26.7
1968 526 091 337 582 -1 010 n.a. n.a. 3.64 26.9
1969 465 764 264 539 -3 614 n.a. n.a. 3.20 26.8
1970 427 034 233 779 -12 190 3.5 68 2.90 26.7
1971 400 146 205 840 -5 090 n.a. n.a. 2.67 26.5
1972 389 153 199 360 -7 330 n.a. n.a. 2.55 26.4
1973 378 696 175 137 -11 719 n.a. n.a. 2.44 26.3
1974 427 732 236 446 -12 368 n.a. n.a. 2.70 26.2
1975 418 185 220 647 -8 957 3.5 86 2.60 26.0
1976 417 353 212 480 -7 290 n.a. n.a. 2.55 25.9
1977 423 958 215 273 -13 088 n.a. n.a. 2.57 25.8
1978 416 598 204 752 -9 843 n.a. n.a. 2.52 25.7
1979 410 603 193 094 -15 866 n.a. n.a. 2.48 25.5
1980 398 904 167 028 -17 804 2.8 104 2.43 25.2
1981 381 101 156 466 -14 114 n.a. n.a. 2.36 25.3
1982 344 369 120 249 -17 260 n.a. n.a. 2.17 25.1
1983 321 498 87 606 -21 121 n.a. n.a. 2.07 25.0
1984 350 741 117 042 -23 388 n.a. n.a. 2.27 25.2
1985 358 797 112 127 -20 877 3.7 84 2.31 25.3
1986 376 896 134 566 -18 132 n.a. 49 2.40 25.5
1987 383 199 128 913 -20 169 n.a. 48 2.39 25.6
1988 380 043 126 673 -18 954 n.a. 49 2.31 25.5
1989 369 544 122 238 -22 364 n.a. 52 2.20 25.3
1990 314 746 67 660 -86 781 4.0 315 1.84 25.0
1991 275 275 23 515 -404 397 n.a. 315 1.58 24.5
1992 260 393 -3 462 -29 397 n.a. 266 1.50 24.4
1993 249 994 -13 329 -17 177 17.0 234 1.44 24.3
1994 246 736 -19 365 -16 268 18.3 215 1.41 24.4
1995 236 640 -35 032 -21 217 19.7 212 1.34 24.6
1996 231 348 -54 810 -19 473 20.7 197 1.30 24.8
1997 236 891 -42 424 -13 345 22.2 147 1.32 24.9
1998 237 297 -31 869 -5 629 23.0 114 1.32 25.1
1999 234 600 -30 594 -2 516 24.1 111 1.30 25.3
2000 234 521 -21 299 -3 729 25.5 110 1.31 25.5
2001 220 368 -39 235 1 029 26.7 116 1.27 25.8
2002 210 529 -59 137 -1 572 26.7 118 1.26 26.0
2003 212 459 -54 116 -7 406 28.2 106 1.27 26.2
Table 1: (continued)
Source: NIS (2001, 2005a, 2005b). For total period fertility rate and total cohort fertility rate series we used CE (2005). For cohort
mean age at birth we used Ghetău (1997b).
Birth cohort Total Cohort Fertility Rate Cohort mean age at birth
1935 2.38 26.8
1936 2.37 26.8
1937 2.37 26.8
1938 2.38 26.7
1939 2.41 26.7
1940 2.43 26.5
1941 2.44 26.3
1942 2.42 26.1
1943 2.47 25.9
1944 2.43 25.7
1945 2.44 25.6
1946 2.39 25.4
1947 2.39 25.3
1948 2.46 25.2
1949 2.50 25.1
1950 2.45 25.1
1951 2.36 25.2
1952 2.31 25.2
1953 2.28 25.1
1954 2.27 25.1
1955 2.28 25.0
1956 2.26 24.9
1957 2.24 24.8
1958 2.22 24.7
1959 2.18 24.6
1960 2.15 24.5
1961 2.10 24.4
1962 2.06 24.3
1963 2.02 24.2
1964 1.97 24.1
1965 1.91 24.2
1966 1.81 24.3
1967 1.71 24.4
1968 1.64 24.6
1969 1.62 24.8
1970 1.61 24.9
2.1 Main developments in birth and fertility
The population of Romania (21.7 million in 2004) has been declining since 1990. This development is mainly due to an imbalance between the number of births and the number of deaths. In addition, Romania has consistently experienced negative net migration. Meanwhile life expectancy increased: by 1997 it reached 67.7 years for men and 75.1 years for women. Table 1 shows the distribution of natural and migratory components of population increase, while Figure 1 depicts total births and deaths over the period 1961–2004, as well as births by birth order. These data reveal the impact of the pro-natalist policies imposed by the socialist regime from 1967 to 1989. After the regime collapsed, however, family policies became ineffective for a number of reasons, including inflation that caused a decline in the real value of child allowances. Moreover, the end of the socialist regime marked the beginning of important changes in childbearing behavior. Birth numbers began to fall steeply, stabilizing briefly only in 1995–2000. Then, the years 2001–2002 brought another decline, followed by a reversal in 2003 and 2004. Overall, between 1989 and 2004 the birth rate slumped by 41%. From 1992 onwards, the number of deaths exceeded the number of births (Figure 1). As regards the deficit of births, we observe that it differs by birth order. Comparing 2004 data to those of 1989, the highest difference is found among higher-order births (3+); in 2004 we find 67% fewer higher-order births; 40% fewer second-order births, and 22% fewer first-order births.
Figure 1: Total births by birth order and total deaths, period 1961–2004
0 100 000 200 000 300 000 400 000 500 000 600 000
1961 1966 1971 1976 1981 1986 1991 1996 2001
Birth order 1 Birth order 3+
Total deaths Total live-births
Birth order 2
Immediately after 1989, the total (period) fertility rate (TFR) started to decrease dramatically. The average number of births a woman would have in her lifetime declined by 1 child, from 2.2 in 1989 to 1.3 in 2004 (Figure 2a), followed by the stabilization of the TFR at 1.3 births per woman after 1995. The stabilization was due to a change in the age pattern of childbearing rather than less steeply declining rates of cohort fertility. Evidence for this development is found in the sinuous evolution of the mean age at childbearing and the decrease of total cohort fertility rate. Although the latter decrease was not as strong as the decline of the TFR, actual numbers declined steadily. First, the mean age at childbearing fell from a maximum of 25.6 years in 1987 to a minimum of 24.3 years in 1993. From 1993 onwards, Romanian women tended to postpone childbirth, and every year the mean age at birth increases by 0.2 years. The period and the cohort mean age at birth both have a U-shape (Figure 2b and Table 1).
The unusual “rejuvenation” in childbearing started in the mid-1980s and lasted until 1993. However, it had two episodes: The first was triggered by the pro-natalist policy, which pressured young women to anticipate births. The second episode was characterized by a continuing decrease in the mean age at birth as a result of declining higher-order births. This development continued for another three years after 1989 and was mainly due to declining higher-order births, which usually took place at later ages under the pro-natalist policy.
The total fertility rate of second-order births almost halved between 1985 and 1993 (from 0.73 children per woman in 1985 to 0.38 in 1993) and that of higher-order (three or more children) fell even more (from 0.67 children per woman in 1985 to 0.28 in 1993; see Figure 3a for more details.) Figure 3b shows cohort fertility by birth order and confirms that the decline of third and higher-order fertility has been long-lasting and persistent. Every cohort born after 1944 made a 1% to 10% lower contribution to the total cohort fertility rate of third-order birth than the previous cohort. Second-order cohort fertility decreased more slowly than higher-order fertility, whereas first-order fertility remained almost unchanged: 85% to 93% of women belonging to the 1944– 1967 birth cohorts experienced a first birth. Although we observe a long-term stabilization of the TFR (over the past ten years), it seems that the decline in cohort fertility has not yet come to an end, and there is no indication that it will come to an end soon.5
5 Using a methodology based on recent developments in Total Cohort Fertility, together with the Cumulated
Figure 2a: Total (period) fertility rate and completed fertility rate lagged by the average age at childbearing (cohorts 1935-1971)
0.0 0.5 1.0 1.5 2.0 2.5 3.0 3.5 4.0
1960 1965 1970 1975 1980 1985 1990 1995 2000
Bi
rt
h pe
r w
o
m
a
n
Total fertility rate
Completed fertility rate
Source: CE (2005).
Figure 2b: Period mean age at childbearing and cohort mean age at childbearing lagged by the average age at childbearing
(cohorts 1935-1971)
22.5 23.0 23.5 24.0 24.5 25.0 25.5 26.0 26.5 27.0 27.5
1960 1965 1970 1975 1980 1985 1990 1995 2000
Age of
m
o
th
er
Period mean age at birth Cohort mean age at birth
Figure 3a: Total (period) fertility rates by birth order, 1970-2004
0.0 0.2 0.4 0.6 0.8 1.0 1.2
1970 1974 1978 1982 1986 1990 1994 1998 2002
Period
Bir
ths
pe
r w
o
m
a
n
TFR1
TFR2
TFR3+
Source: Calculations of the author based on NIS (2001, 2005b)
Figure 3b: Completed (cohort) fertility rates by birth order, 1944-1967
0.0 0.2 0.4 0.6 0.8 1.0 1.2
1944 1948 1952 1956 1960 1964
Cohort
B
ir
ths pe
r wom
a
n
CF1 CF2 CF3+
2.1.1 Parenting and family size
Continuing with a longitudinal perspective, we see that the decision to become a parent has become more widespread, whereas the preference for a large family size has decreased (see Figure 4, based on census data). Childlessness declined from 15 to 20% among birth cohorts born before the Second World War to 10% among those born after the war. The proportion of women with one child increased in all birth cohorts except those born during the Second World War. Women born in 1921 were the first to adopt the two-child model, which has become the most common family size since then. However, especially among the younger birth cohorts a new tendency has emerged: an increasing number of single-child families (among women born after the Second World War) and a slight rise in childlessness (among women born after 1960). Younger birth cohorts have not yet completed their reproductive period, and although, theoretically, they would be able to recuperate their postponed births, this is very unlikely to happen, as cultural norms do not encourage childbirth at later ages.
Figure 4: Distribution of women by parity, 1915-1965 cohorts
0.00 0.05 0.10 0.15 0.20 0.25 0.30 0.35 0.40 0.45 0.50
1915 1920 1925 1930 1935 1940 1945 1950 1955 1960 1965
Pe
rce
n
ta
ge
childless
1 child 2 children
4+ children
3 children
2.1.2 Postponement of childbirth
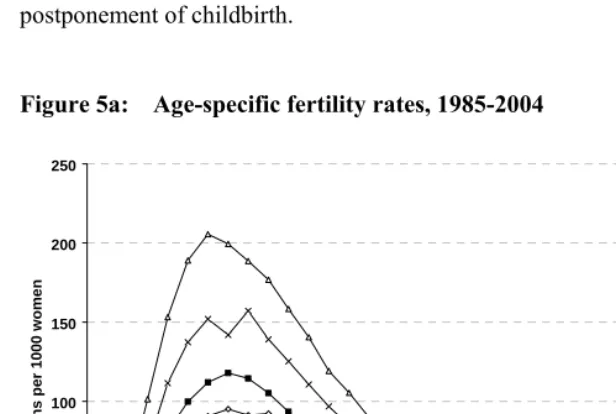
As regards the age patterns of fertility, age-specific fertility rates reveal that important changes have taken place (Figure 5a). Until 1995, we observe a reduction in fertility level among all age groups. Between 1995 and 2000, this reduction affected only mothers aged 18–25 (the most fertile ages in Romania). At the same time, fertility rates increased at all ages above 25. This trend continued, so that by 2004 fertility patterns had changed profoundly: Whereas for many years 21- to 22-year old women tended to be the driving force of fertility, now women aged 25 were those with the highest fertility rates. To sum up, Romania has definitely begun to experience a trend towards postponement of childbirth.
Figure 5a: Age-specific fertility rates, 1985-2004
0 50 100 150 200 250
15 20 25 30 35 40 45
Mother's age
Birt
hs per
1000
wome
n
1985 1990 1995 2000 2004
Source: NIS (2001, 2005a).
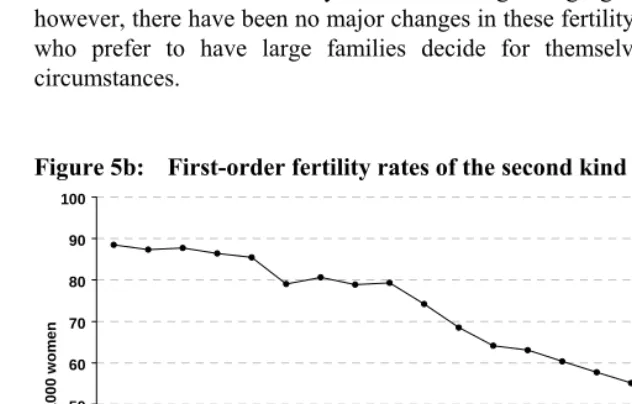
throughout most of the period 1985–2004. A continuous reduction is notable also among the youngest age group, women aged 15–19. The fertility reduction of women aged 25–29 lasted only until 1990. After that, it continuously reverted. By 1999 it had surpassed the fertility of women aged 15–19. After 1995, first-birth period fertility rates had started to increase also for women older than 30.
Second-order fertility rates (Figure 5c) of the 20–24 age group sharply declined. The reduction started to lose its pace only in 1991. For women aged 25–29, it came to a halt after 1994. In fact, in 1998 for the first time, second-order fertility rates were higher among this age group than among younger ones, where the latter showed instead a continuous decline. Following a reduction in fertility until 1993, period fertility rates have increased constantly for the age group 30–34. In 2004 they reached almost the same levels as those reached by women aged 20–24. Thus their fertility was twice as high as 10 years earlier. From 2000 onwards, even women older than 35 experienced higher second-order fertility.
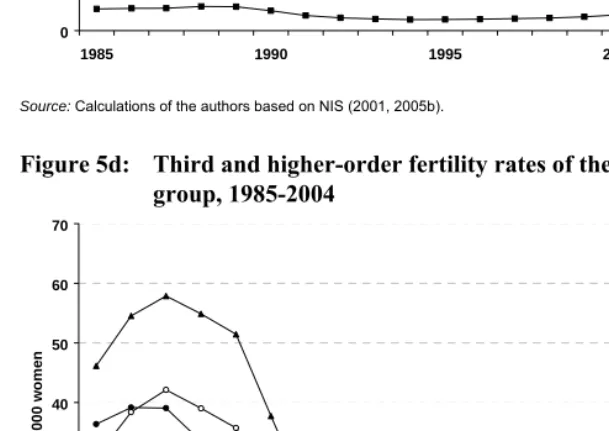
As to third- and higher-order period fertility rates (Figure 5d), we observe that between 1989 and 1993 they declined among all age groups. In the past ten years, however, there have been no major changes in these fertility rates. It seems that women who prefer to have large families decide for themselves, regardless of external circumstances.
Figure 5b: First-order fertility rates of the second kind by age group, 1985-2004
0 10 20 30 40 50 60 70 80 90 100
1985 1990 1995 2000
Bir
ths per 100
0
w
o
me
n
15-19 20-24 25-29 30-34 35-39
Figure 5c: Second-order fertility rates of the second kind by age group, 1985- 2004 0 10 20 30 40 50 60 70
1985 1990 1995 2000
Bi rt hs per 10 00 w o m e n 15-19 20-24 25-29 30-34 35-39
Source: Calculations of the authors based on NIS (2001, 2005b).
Figure 5d: Third and higher-order fertility rates of the second kind by age group, 1985-2004 0 10 20 30 40 50 60 70
1985 1990 1995 2000
Birt h s pe r 10 00 w o me n 15-19 20-24 25-29 30-34 35-39 40-44
2.1.3 Longitudinal (cohort) perspective
Up to now we have shown a cross-sectional perspective, observing the immediate effect of period on fertility age patterns. Behavioral changes, however, are revealed only from a longitudinal (cohort) perspective. Several age-parity cohort fertility rates are shown in Figures 6a–6f6. The birth cohorts of 1960 and 1965 completed their family formation
mainly before the change of regime (in 1990, these women were aged 30 and 25, respectively). Their age-specific first-order fertility rates (Figure 6a) are almost identical. Differences emerge among women born in 1970. These women have a less sharp first-order fertility pattern (in their 20s), and they also differ strongly from younger cohorts born after 1975, whose curve has a much flatter shape. Changes in the age patterns of second-order births set in from the 1965 birth cohort onwards (Figure 6b). These women experienced fewer second births in their late 20s than older generations. This shift can be attributed to the change in the socio-political regime, which now allowed for modern contraceptives and abortion. Women born after 1970 underwent almost their entire reproductive period under a new political regime. These women have evidently postponed second birth (see the less evident peak, which is reduced to half in the fertility pattern in Figure 6b), as they tend to realize some of the births they postponed in their early years of adulthood.
However, the metamorphosis of fertility toward later childbearing hardly compensates for the postponed births of earlier ages, especially as regards second births. Figure 6c displays the cumulative progression rate to first birth. About 90% of women born in 1960 experienced the transition to first birth. Taking a look at the 1965 and 1970 generation, we assume that they will reach this level too. The younger generations, however, will need to display higher recovery rates since their cumulated progression rate to first birth has been much lower than the corresponding rates of older generations. The postponement of second birth among the 1965 generation will apparently not be recuperated; fewer than 60% of women of this generation had a second child in their late 30s, compared with almost 70% of women from the earlier generation (Figure 6d). For those born after 1975, recuperation will even be harder. Though these women have enough time for recuperation, one has to consider that the delay is substantial and that according to the Romanian culture, births tend to occur at an early age.
Figures 6e and 6f display the differences between cohorts of cumulative progression rates to first and second birth, showing more clearly the extent to which postponement is widespread. Compared to women born in 1960, recuperation is
practically impossible, for first births among the cohorts born after 1970, and for second birth among those born after 1960.
Figure 6a: Age-specific fertility rates, first births, birth cohorts 1960, 1965, 1970, 1975, and 1980
0.00 0.02 0.04 0.06 0.08 0.10 0.12 0.14
15 20 25 30 35 40 45
Age
A
ge-spec
ific
fe
rt
ilit
y
ra
te
1960 1965 1970 1975 1980
Figure 6b: Age-specific fertility rates, second births, birth cohorts 1960, 1965, 1970, 1975, and 1980
0.00 0.01 0.02 0.03 0.04 0.05 0.06 0.07 0.08
15 20 25 30 35 40 45
Age A ge-spec ific fe rt ilit y ra te 1960 1965 1970 1975 1980
Source: Observatoire Démographique Européenne.
Figure 6c: Cumulative progression rate to first birth, birth cohorts 1960, 1965, 1970, 1975, and 1980
0.0 0.1 0.2 0.3 0.4 0.5 0.6 0.7 0.8 0.9 1.0
15 20 25 30 35 40 45
Age P rop ort ion of w ome n hav ing a f irst bi rt h 1960 1965 1970 1975 1980
Figure 6d: Cumulative progression rate to second birth, birth cohorts 1960, 1965, 1970, 1975, and 1980
0.0 0.1 0.2 0.3 0.4 0.5 0.6 0.7 0.8
15 20 25 30 35 40 45
Age Pr opo rti on of w om e n ha vi ng a seco nd b irt h 1960 1965 1970 1975 1980
Source: Observatoire Démographique Européenne.
Figure 6e: Cumulative change in first birth progression rate by age, birth cohorts 1960, 1965, 1970, 1975, and 1980 (benchmark cohort 1960)
-0.4 -0.3 -0.2 -0.1 0.0
15 20 25 30 35 40 45
Age C umul ati ve abso lu te c hang e 1960 1965 1970 1975 1980
Figure 6f: Cumulative change in second birth progression rate by age, birth cohorts 1960, 1965, 1970, 1975, and 1980 (benchmark cohort 1960)
-0.4 -0.3 -0.2 -0.1 0.0
15 20 25 30 35 40 45
Age
Cu
m
ul
ati
ve ab
sol
ute
chan
ge
1960 1965 1970 1975 1980
Source: Observatoire Démographique Européenne.
2.2 Fertility differentials and determinants
In Romania, surveys enabling the study of the impact of micro-level mechanisms on fertility are sparse and rather limited. One exception is the Reproductive Health Survey 2004 (RHS 2004),7 in which the sample of 4441 women aged 15–44 allows us to study the influence of several proximate determinants on fertility as well as fertility differentials between individuals with different characteristics.
For our analysis we apply life-table analysis as well as proportional hazard regression. For the latter we use piecewise constant models, using both first birth and second-birth risks as dependent variables. Whereas life-table analysis allows for the study of fertility levels and timing differentials by factors, regression analysis enables us to measure the relative risks of individuals with different characteristics to experience a given event, while controlling for other factors.
2.2.1 Risk patterns for first union, pregnancy, birth, abortion and for second birth
Figure 7 indicates the hazard rates of first and second-order childbearing. We display also the risk patterns of other events such as transition to first union, first pregnancy, and first abortion, since they usually tend to have an influence on the birth pattern. All rates were estimated on a monthly basis, and represent the behavior of all 4441 respondents. Women in the RHS reported on every pregnancy they experienced throughout their life, regardless of whether pregnancy resulted in a live birth, a miscarriage, or an abortion. Since we observe similar patterns regarding first union, pregnancy, and birth, we assume that all three events are strongly related to each other and they are almost universal. Examining the cumulated percentage of these events, we find that 96% of all women experienced a first union, 93% a first pregnancy, and 89% a first birth. Women in their 20s face the highest risk of all three events. Second birth-risks are much lower by contrast: About 64% of all women experienced transition to second birth throughout their reproductive lifetime. Figure 7 also shows abortion risks – another factor that influences fertility. The abortion curve is flatter: 48% of all women had at least one abortion during their reproductive period.
Figure 7: Occurrence / exposure rates for first union, first pregnancy, first birth, first abortion, and second birth
0.00 0.05 0.10 0.15 0.20 0.25
15 17 19 21 23 25 27 29 31 33 35 37 39 41 43
Age
First union First pregnacy First birth First abortion Second birth
In the event-history model, we use the following covariates: period, human capital, and culture and norm proxies. We also control for union, fertility regulation, birth cohort,8 and for age group. We divide each period into four intervals, corresponding to
our findings based on macro data analysis. The period before 1990 was characterized by the coercive pro-natalistic policies of the socialist regime; the 1990–1994 period evidenced a sudden drop in fertility; the 1995–1999 period was marked by the onset of structural changes, and the 2000–2004 period by massive structural changes.
We decided to integrate human capital proxies because in several fertility theories they represent an important factor, especially with regard to economic approaches. In the analysis of fertility differentials among women with different characteristics, we use the level of education, working status, and socio-economic level as a proxy for human capital. For our event-history model, however, it is impossible to measure the impact of these factors because they were recorded at the time of the interview only. Thus, the RHS provides no information on the history of these events. Since these proxies do not suit the purpose of a causal analysis when reported as a time-constant variable instead of a time-varying one, we had to exclude these factors (see Kravdal 2004).
The proxies of culture and norms, instead, are considered to be more stable throughout life. Thus we use area of residence, religiosity, and region as time-constant covariates in our hazard regression models. In the grouping of Romanian regions, we apply the NUTS-2 classification, which divides Romania into eight regions (see Map 1). These regions were defined only at the end of the 1990s; however, they provide an adequate division of the 42 administrative units of Romania. The classification accounts not only for ecological differentiation, but also for historical, socio-economic, and demographic differences (Sandu 1996, 2000). Cultural differentiations within the country are rooted in Romanian history: In 1918 the country was formed9 from three
historical regions, called “provincii,” which were mainly under the influence of the Ottoman Empire (South, South-West, part of the South-East, Bucharest), the Austro-Hungarian Empire (North-West, West, and Center), and the Tsarist Russian Empire (North-East, part of the South-East).
8 The variable birth cohort used in our analysis does not interfere with period and age variables, because it is
set by other criteria than just the passage of time. The only aim of the three categories of this variable is to differentiate the very special so-called ‘forced born’ from the other cohorts born before or after 1964–1974, as we describe later in Section 3.3. Although we control for birth cohort, it is not correlated with the five-year group period and age variables.
Map 1: Romanian regions according to NUTS-2 classification
2.2.2 Level and timing of first and second births
Table 2: First and second birth level and timing life-table indicators, by categories
First birth Second birth
Factor and category
Cumulative % of those who ever had the event Median age Number of cases Cumulative % of those who ever had the event Median age Number of cases Period ***
before 1990 20.6 965 22.0 467
1990-1994 22.1 799 24.5 397
1995-1999 22.8 679 25.2 397
2000-2004 24.4 541 27.3 378
Total 21.8 2984 24.5 1639
Workforce status ***
working 88 24.3 2511 55 33.9 1810
not working 92 21.6 1930 78 25.5 1174
Total 89 23.2 4441 64 29.2 2984
Socio-economic level ***
low 93 21.0 1445 80 25.2 1100
middle 85 23.6 1604 62 30.4 1038
high 91 25.3 1392 47 . 846
Total 89 23.2 4441 64 29.2 2984
Educational level ***
no upper 92 20.5 1637 83 24.6 998
upper secondary 90 23.5 2257 58 31.2 1700
post-secondary 81 29.2 547 38 . 286
Total 89 23.2 4441 64 29.2 2984
Church attendance
at least once a 91 23.2 1712 65 29.2 1148
less than once a
month or never 88 23.2 2723 63 29.2 1832
Total 89 23.2 4435 64 29.2 2980
Area of residency ***
urban 86 24.8 2486 53 35.7 1478
rural 93 21.6 1955 75 26.5 1506
Total 89 23.2 4441 64 29.2 2984
Region ***
North-East 91 22.8 718 74 27.8 496
South-East 86 23.2 585 61 30.2 396
South 91 22.3 737 63 28.3 529
South-West 95 21.8 515 69 25.8 397
West 89 23.1 378 57 29.8 260
North-West 89 23.3 496 66 30.0 323
Center 86 24.2 553 63 31.2 348
Bucharest 84 27.4 459 43 . 235
Total 89 23.2 4441 64 29.2 2984
First union ***
never in union 20.8 29 24.2 10
before birth 22.2 2581 24.5 1545
after birth 19.8 374 21.4 84
Table 2: (continued)
First birth Second birth
Factor and category
Cumulative % of those who ever had the event
Median age
Number of cases
Cumulative % of those who ever had the event
Median age
Number of cases
before 1967 93 22.2 888 70 27.0 823
1967-1974 (‘forced 89 23.2 1617 59 31.2 1400
1975 and after 71 24.3 1936 54 28.8 761
Total 89 23.2 4441 64 29.2 2984
First abortion ***
never aborted 22.3 1670 24.8 848
before birth 23.6 277 25.6 360
after birth 21.0 1016 21.1 46
Total 21.8 2 24.9 125
Source: Calculations of the authors based on RHS 2004 data. *** Highly significant, p < 0.001.
Women who tend to postpone childbirth and decide less often for children are those who are working, have a higher educational degree, and occupy a middle position in the socio-economic strata. Religiosity (here measured by church attendance) does not have a significant effect on primo-fertility. By contrast, women living in rural areas become mothers more often (93% compared to 86% of women in urban areas) and do so earlier in life: on average three years earlier than women living in urban areas. Significant differences are found regarding the impact of region on fertility. Women from the North-East or South-West regions of Romania tend to have first births earlier than other women and do so in higher proportions. Bucharest shows the lowest and latest primo-fertility. For about 99% of women, being in some form of union is a pre-condition for having a first child. Since the RHS does not offer information on the form of union (marriage vs. cohabitation) we cannot study non-marital births. Nevertheless, women who formed their first union after the first birth generally were younger than other mothers (by about two and a half years). These very young women, of whom 50% were not yet in their 20s, contributed strongly to the increasing trend towards non-marital birth.10
When controlling for the impact of all factors in a regression analysis, a somewhat modified picture emerges. Table 3 indicates the relative risks for the transition to first and second birth, as well as first abortion. The period 1990–1994 serves as the basis for comparison, as these years witnessed the onset of changes in the fertility pattern. In the case of primo-fertility, the significant changes occurred only five years after the change
10 Since the sample size of women who experienced a non-marital birth is too small in the RHS, we were not
of the political regime. At that time, first-order fertility dropped significantly—by 14%. This decline held for the period 2000–2004. Interestingly, both the periods “before 1990” and 1990–1994 seem to have had the same effect on the transition to first birth. We assume that these results are due to the fact that women of older age groups partly compensated for decreasing birth-intensities of younger age groups, and thus we controlled for the age-effect in our model. Furthermore, living in rural areas increases the risk of first birth by 28% compared to women living in urban areas. Women belonging to the North-East, South-West, or the West region of Romania have higher risks than women of the Center region. Bucharest continues to have the lowest first-birth risk, 16% lower than in the Center region. “Being in a union” remains one of the best explanatory variables. The highest risk for first birth is during the first or second year of union. Compared to women who are in their first two years of union, those who are in their third or fourth year of union have a 19% lower risk for first birth; women who are in the fifth or sixth year of union have a 48% lower risk; and those who are in union for more than seven years have a 69% lower risk. Women not in any union are least likely to have a first birth.
Table 3: Relative risks of first birth, second birth, and first abortion
First birth Second birth First abortion
Factor and category
Hazard
Ratio Sig.
Hazard
Ratio Sig.
Hazard
Ratio Sig.
Period
before 1990 1.00 0.960 1.31 0.002 0.67 0.000
1990-1994 1 - 1 - 1 -
1995-1999 0.86 0.010 0.77 0.001 0.78 0.002
2000-2004 0.80 0.004 0.91 0.375 0.57 0.000
Church attendance
at least once a month 1 - 1 - 1 -
less than once a month or never 1.00 0.913 1.06 0.285 1.31 0.000
Area of residency
urban 1 - 1 - 1 -
rural 1.28 0.000 1.74 0.000 0.91 0.123
Region
North-East 1.18 0.017 1.37 0.001 1.06 0.610
South-East 1.14 0.075 1.02 0.837 1.76 0.000
South 1.13 0.075 1.02 0.870 1.22 0.066
South-West 1.30 0.000 1.31 0.006 2.50 0.000
West 1.17 0.055 1.08 0.489 1.54 0.000
North-West 1.14 0.087 0.98 0.856 0.84 0.198
Center 1 - 1 - 1 -
Bucharest 0.84 0.043 0.90 0.453 1.97 0.000
Years since union formation
no union so far 0.04 0.000 0.13 0.000 0.42 0.000
during 1st or 2nd year of union 1 - 1 - 1 -
during 3rd or 4th year of union 0.81 0.000 2.55 0.000 0.84 0.032
during 5th or 6th year of union 0.52 0.000 1.59 0.000 0.53 0.000
during 7th and higher year of 0.31 0.000 1.02 0.872 0.40 0.000
Age group
15-19 0.91 0.232 1.09 0.459 0.73 0.006
20-24 1.20 0.002 1.24 0.003 1.08 0.317
25-29 1 - 1 - 1 -
30-34 0.74 0.008 0.63 0.000 0.72 0.004
35-44 0.27 0.000 0.15 0.000 0.58 0.002
Years since first birth
0-1 0.36 0.000
2-3 1 -
4-5 1.51 0.000
6+ 1.01 0.897
Birth cohort
before 1967 1.16 0.012 1.15 0.090 0.83 0.031
1967-1974 (‘forced born’) 1 - 1 - 1 -
1975 and after 0.99 0.921 0.91 0.307 1.23 0.025
Event experienced Abortion exp. Abortion exp. Birth exp.
no 1 - 1 - 1 -
yes 0.97 0.646 0.86 0.016 3.57 0.000
LR chi2(23) = 6476.40 LR chi2(26) = 2514.91 LR chi2(23) = 1272.38
Prob > chi2 = 0.0000 Prob > chi2 = 0.0000 Prob > chi2 = 0.0000
The regression analysis (Table 3) provides evidence that every period after 1990 has significantly lower second-birth risks. Compared to the period before 1990, in 1990–1994 the relative risk for a second birth is 31% lower. And in contrast to the period 1990–1994, the risk in bearing a second child in the period 1995–1999 decreased by 23%. However, in the 2000–2004 period women had the same risk for a second birth as in 1990–1994. Again, we find that religiosity has no significant effect. Regarding area of residence, our model reveals that women coming from rural areas have a 74% higher propensity to have a larger family than their urban counterparts. This difference between urban and rural women is remarkably higher than in the first model, where we analyzed the transition to first birth (here, rural women had a 28% higher risk for the first birth compared to urban women). As found also for first birth, the North-East and the South-West are the most fertile regions. However, when considering second births, the differences between the Center region and Bucharest, or the West region, which were observed for first-order birth, disappear. Furthermore, the second child does not usually arrive very soon after union formation. After giving birth for the first time, women tend to wait four to five years to have a second birth.
3. Proximate determinants of fertility
3.1 Marriage patterns, cohabitation, divorce, and separation, 1985–2004
As in other European societies, the Romanian crude marriage rate decreased during the last two decades, declining from 7.1 per 1,000 (7.1‰) in 1985 to 5.9‰ in 2002. In 2004, however, the country recorded an increase in marriages up to 6.6‰. The total female first-marriage rate (below age 50) also fell. Between 1985 and 2002, it decreased from 0.89 to 0.66, though rising to 0.74 in 2004. Even today, the Romanian marriage pattern is characterized by early transition to marriage, by a relatively high level of persons who choose a marital union, by stability (a low divorce rate and a very low proportion of higher-order divorce), and by low levels of ultimate celibacy.
3.1.1 Marriage patterns
indicating that conception precedes marriage. However, these figures are biased, as we have to take into account that in recent years the number of births, the proportion of never-married persons, as well as the number of non-marital births markedly increased, with the latter reaching almost 30% in 2004. On the one hand, these women, who tend to be rather young, do not contribute to the mean age at first marriage. On the other hand, they contribute to the mean age at first birth (Mureşan and Rotariu 2000). Considering the proportion of women who have their first child inside (first) marriage, we notice that postponement is indeed taking place – the proportion of women who have a child during the first two years of marriage decreased from 61% in 1993 to 46% in 2004 (NIS 2005a). The interval between age at first marriage and age at first birth is much more pronounced in urban areas than in rural regions (in 2004, 46% of the population of Romania lived in rural areas).
Figure 8: Mean age of women at first birth and first marriage
20 21 22 23 24 25 26
1985 1990 1995 2000
Me
an
a
g
e
First birth
First marriage
3.1.2 Cohabitation
Today, Romania is characterized by a combination of a high proportion of non-marital births and a very low level of cohabitation. Non-marital births increased from 4% in 1985 to almost 30% in 2004 (see Figure 9), whereas the number of persons older than 15 who were cohabiting was fewer than 5% in 2002 (the first census records of cohabitation). Although the level of cohabitation is underestimated, it indicates that in Romania cohabitation does not account for modern behavior. Cohabitation is seen as a prelude to marriage rather than an alternative to marital union. According to RHS 2004 data, cohabitation is widespread among women with a lower education (31% of those with primary education cohabit compared to 2% of those with a university degree), among unemployed women (7% compared to 4% of employed women), among women with a lower economic status (11% compared to 2% of those with a high socio-economic status), and among women from rural areas (7% compared to 4% in urban areas). This trend holds for all age groups. As regards ethnicity, 36% of Roma cohabit, compared to 4% of Romanians and 11% of Hungarians.11 The proportion of female
Roma in the sample is very small (slightly less than 2%); however, these women tend to be unemployed. In addition, they usually have a lower educational and socio-economic status, independent of their living arrangement (marriage or informal union).
Our estimates based on the national survey Demography and Lifestyle of Romanian Women 2004 12 indicate that marriage is still more attractive to Romanian
women than cohabitation. Among women who have a non-resident partner, 42% wish to marry within the next two years, compared to 29% who wish to enter cohabitation. Cohabitation and childbearing outside the marital context are not seen as an alternative to marriage, and the large proportion of non-marital births shows, rather, that there is room for improvement in contraceptive education. Modern contraceptive methods might have been used insufficiently and inefficiently. Our interpretation is that a high number of non-marital births were probably not planned. According to data coming from the RHS 2004, the proportion of unintended births among women’s last live birth was 27% (11% mistimed and 16% unplanned), i.e., twice as high overall as reported in the 1999 RHS (8% mistimed and 4% unplanned). The proportion of unplanned pregnancies resulting in abortion declined by 50% between 1999 and 2004, whereas in the RHS 1999, 88% of women whose last pregnancy within the past five years ended in
11 The sample is representative of the whole Romanian population above age 18. According to the 2002
census, the distribution of ethnic groups among the Romanian population is 89.8% Romanian, 6.9% Hungarian, 1.8% Roma, and 1.5% other minorities.
12 The national survey Demography and Lifestyle of Romanian Women 2004 contains information on 1956
abortion declared that this pregnancy was unplanned (Şerbănescu et al. 2001), and in the RHS 2004, 42% of women in that situation made the same response.
Figure 9: Percentage distribution of births by mother’s civil status
0% 20% 40% 60% 80% 100%
1985 1990 1995 2000 2004
Marital Extra-marital
Source: CE (2004) for the period 1985-2000 and NIS (2005b) for 2004.
Our estimates based on the national survey Demography and Lifestyle of Romanian Women 2004 13 indicate that marriage is still more attractive to Romanian
women than cohabitation. Among women who have a non-resident partner, 42% wish to marry within the next two years, compared to 29% who wish to enter cohabitation. Cohabitation and childbearing outside the marital context are not seen as an alternative to marriage, and the large proportion of non-marital births shows, rather, that there is room for improvement in contraceptive education. Modern contraceptive methods might have been used insufficiently and inefficiently. Our interpretation is that a high number of non-marital births were probably not planned. According to data coming from the RHS 2004, the proportion of unintended births among women’s last live birth
13 The national survey Demography and Lifestyle of Romanian Women 2004 contains information on 1956
was 27% (11% mistimed and 16% unplanned), i.e., twice as high overall as reported in the 1999 RHS (8% mistimed and 4% unplanned). The proportion of unplanned pregnancies resulting in abortion declined by 50% between 1999 and 2004, whereas in the RHS 1999, 88% of women whose last pregnancy within the past five years ended in abortion declared that this pregnancy was unplanned (Şerbănescu et al. 2001), and in the RHS 2004, 42% of women in that situation made the same response.
3.1.3 Divorce
Although since 1989 we have observed changes in marriage patterns, the situation is entirely different for divorce. Not only is the (crude) divorce rate low compared to other European countries (1.5‰ in 2002), but we also find that the rate has shown no tendency to increase since the fall of the socialist regime after which a radical change in divorce legislation was introduced. With some minor annual oscillations, the divorce rate has stood around 1.5‰ since 1980. In general it is argued that several characteristics of Romanian society discourage people from choosing divorce (Rotariu 2000, 2003). The housing crisis and the general economic situation of Romania make it difficult to choose divorce. Moreover, Romanians face higher psychological costs of divorce than people in other European countries, as ”not being married” (any longer) is considered to be negative by society. Couples living in rural areas have a 2–3 times lower divorce rate than couples living in urban areas – the specific way of rural life causes several constraints that complicate the decision to divorce.
3.2 Contraception
Until 1990, the reproductive behavior of Romanian women was characterized by the prohibition by the socialist government on the use of modern contraception and family planning programs. Induced abortion (although being illegal) and traditional contraceptive methods – yet without sex education – were the only possibilities to control family size. In 1990, after 23 years of prohibition, abortion was re-legalized and family planning programs were established as well. As a consequence, important changes in the use of contraceptive methods took place.
contraception. Both represent a high level of unmet need for family planning. In 1999 as well as in 2004 we find a similar level of unmet need for modern contraception among women who live in a union. According to the RHS 2004 Synthetic Report, this level is as high as 40%, one consequence being the high proportion of abortions in Romania (Philipov and Dorbritz 2003).
Table 4: Contraception status of women at reproductive age, RHS 1993, 1999,
and 2004
1993 1999 2004
Modern methods 10.0% 23.3% 33.9%
Condom 3.0% 7.7% 13.1%
Pill 2.3% 6.5% 12.7%
IUD 2.5% 4.9% 4.4%
Sterilized 1.0% 1.9% 1.8%
Other 0.5% 2.3% 1.9%
Traditional methods 30.5% 24.7% 24.2%
Using no methods 59.5% 51.8% 41.9%
Source: RHS 2004 Synthetic Report.
3.3 Induced abortion: impact on fertility decline and influencing factors
Although we observe decreasing abortion rates, the level of abortion continues to be high and characteristic of Romania’s present fertility pattern. The Romanian age pyramid is evidence of the impact abortion has had on fertility (Mureşan 1996). In 1990, when free abortion was re-legalized, there were more than three abortions to one live birth. Only in 2004, fourteen years after the re-legalization, did this ratio fall below one abortion per live birth.
We analyzed the reciprocal impact of abortion and fertility between the 1970s and the early 2000s. We used RHS data14 and calculated hazard regression models of first
birth and first abortion. According to the percentage distribution of both events (Figure 10b), three groups of women dominate the sample: women who experienced at least
one birth, but no abortion; women who experienced at least one abortion; and women who neither experienced childbirth nor abortion. The groups are almost the same size. This distribution resembles the distribution of women who used traditional contraception, modern contraception, and who did not rely on any contraceptive methods at the time of interview (Figure 10a). Although these contraceptive practices are common among all ages, we suggest that, at least at the beginning of sexual life, abortion is seen as a substitute for failed traditional contraceptive methods.
Figure 10a: Contraception status of women at reproductive age, RHS 2004
Traditional methods
24% Condom
13%
IUD 4% Pill
13%
Sterilised 2%
Using no methods
42% Other modern methods
2%
Figure 10b: Percentage distribution by first birth and first abortion, RHS 2004
Both experienced,
birth then abortion
23%
Both experienced, abortion then
birth 6%
No birth, no abortion, so
far 29%
No birth so far, abortion experienced
3% Birth
experienced, no abortion
so far 39%
Source: Calculations of the authors based on RHS 2004.
3.3.1 Impact of abortion on first birth
cohort covariate. These birth cohorts were twice as large as the cohorts before 1967. The sudden increase in births in 1967 was due to the strict prohibition of abortion, which had been available free until then. As a consequence, this cohort faced over-crowded kindergartens and schools, an over-subscribed labor market as well as an unbalanced marriage market. We expect that this different kind of socialization had a negative effect on their fertility.
Looking again at the differentials in mothers’ median ages at first birth and second birth, we take into account their experiences with abortion (see last row of Table 2, the “First abortion” factor). Women who had an abortion before first birth (9% of mothers) ”gained” more than 2.5 years in childlessness compared to women who decided in favor of an abortion after birth (34% of the mothers); compared to those women who never experienced an abortion, they gained 1.3 years in childlessness (56% of mothers). Abortion before second birth results in a postponement effect of 4.5 years on the median age at second childbirth, compared to women who chose abortion to regulate their fertility after second birth only. Compared to women who never decided for abortion, the former gained almost one year. Controlling for all important proximate determinants or explanatory factors on fertility (Table 3), we find that an early induced abortion (i.e. before any birth) has no significant effect on first birth.
3.3.2 Impact of abortion on second birth
In first abortions we distinguish between women who chose abortion after at least one childbirth and those did so before any birth. The relative risks estimated by the proportional hazard regression model (Table 3, last column) show the effect of birth and of other proximate determinants or explanatory factors on first abortion.
The 1990–1994 period, in which abortion was re-introduced, indicates the greatest risk of abortion. Gradually, from one period to the next the risk decreases by about 20%. Women with frequent church attendance have a significantly lower risk of experiencing an abortion (by 31%). Living in a rural area has only a weak influence on the abortion risk. The effect of region, however, is very pronounced. The South-West (with its maximum relative risk of 2.50), Bucharest (1.97), the South-East (1.76), and the West (1.54) have a significantly higher abortion risk than the Center and North-East regions. Findings show that abortion in the first two years of first union is very common, and is indeed, twice as high as after the fourth anniversary. These results confirm our initial hypothesis that abortion works as a substitute for modern contraceptives at the beginning of sexual life. Women aged 20–29 have the highest risk to decide for abortion. As regards the “forced born” cohort, these women have a 17% higher risk to experience abortion than women born earlier. Compared to women who belong to the youngest birth cohort, the “forced born” cohort has a 23% lower risk to abort. Thus, we find no extraordinary results as regards this birth cohort, as they occupy a middle position in an increasing trend towards the use of abortion. However, we find that the effect of giving birth on abortion is very high, even higher than the effect of abortion on second childbirth. Women who have given birth have a 3.57 times higher risk of abortion compared to women who have not yet had a child. Women who have had an abortion first have the same risk in giving first birth than women who have not experienced abortion, but they have a 14% lower risk of second birth.
4. Important societal conditions and their impact on fertility and the
family
in studies on several other former socialist countries, i.e., with regard to family formation and conditions of young people. The economic decline, rising unemployment, and falling economic activity rates are also reflected at the individual level, where people suffer reductions in household income and living standard. As a consequence of these economic constraints, couples might opt for both postponing childbirth and limiting the number of children they want to have (Macura 2000).
4.1 Economic development
4.1.1 The socialist regime of Romania
By the end of the Second World War, Romania was characterized by an agrarian economy. Levels of both industrial employment and female labor-market participation were low. Between 1930 and 1948 the proportion of people living in rural areas declined only marginally, from 79% to 76% (National Institute of Statistics 2001). Upon its takeover, the socialist regime pursued a modernization plan that aimed at turning the country into an industrial society. All other aspects of political, economic, and social life were secondary to this goal. In the first years, the proportion of GDP invested in development reached high levels. As a consequence, Romania witnessed the formation of a universal health care system and the development of mass education and urbanization (based on forced migration from rural areas). In fact, in 1985 the distribution of the rural and urban population was more or less balanced. However, the means used by the socialist regime were not democratic. Private ownership of the means of production was abolished, and the market economy was replaced by a centralized, planned economy. We find evidence for this when looking at wage policies, where the socialist regime committed itself to the principle of egalitarian revenue. Although income varied in different sectors of the economy, differences within one sector were small. This policy was not the result of economic considerations, but of the ideological assumptions of the regime. Heavy industry, such as the mining and energy industry, was seen as the sector most important for the Romanian economy; hence, socialist Romania developed an oversized industrial sector, with higher incomes in the corresponding occupations.
We also find evidence for the leading role of industry when looking at the educational system. While participation in education increased,15 the educational
system itself was mainly designed to supply the requirements of an industrial economy, ignoring other aspects of social and economic life.
In the following years, Romania witnessed rapid industrialization expressed in the creation of single-industry areas and agricultural collectivization. More and more peasants became employees. These changes finally led to the demise of the traditional rural family and household model.
The early 1970s are often referred to as “the period of the socialist welfare state.” Real income grew constantly during this period, and life expectancy at birth reached a maximum of 70 years – a level that was reattained only several decades later. However, real income started to decline, slowly but constantly, as a result of inflation. The Romanian socialist economic regime was autarkic, as national production supplied 95% of the internal market of goods.
4.1.2 Economic evolution
Although in Romania the transition from the socialist regime to a society based on democracy and market economy bears similarities to the transitions of other former socialist countries, the changes in Romania were unique.
One major effect the transformation had on the local economy was the steep decline of the GDP: Between 1988 and 1992, real GDP declined by 30%. The period after 1992 witnessed uneven growth as well as decline (OPPG Ro 2004). Between 1994 and 1995 the GDP experienced a rebound, which was followed by a period of recession (1997–1999). This recession was mainly caused by the onset of structural economic changes. Between 2000 and 2005 the development of the GDP was characterized by a stable growth of 5% on average, and similar growth is forecast for future years. In 2004 the European Commission incorporated Romania, according the country the status of a “functional market economy,” a status that recognized the advances made by the country in areas such as economic stability. Yet, the inflation rate (CPI index) remains a constant political and economic concern, and for several years (1992–1994 and 1997), the CPI index went into triple digits. It has fallen below 10% only since 2004.
4.1.3 Structure of the economy
Since 1990 economic development has followed a sinuous path, often described by analysts as a period of “boom-and-bust” with major fluctuations in production. Although economic policy aimed at reducing the economic deficit (in Romania income per capita is about 30% of that in the EU-15 countries), recent political decisions, such as on the pace of economic reforms or attitudes towards foreign capital, had rather negative effects on the economic development of the country. The proportion of people working in the industrial sector has declined constantly since 1990. The same trend accounts for the proportion of industry’s GVA to GDP. Compared to heavy industry (a male-dominated sector), light industry (a female-dominated sector) in the early 1990s witnessed a retrenchment, which until 1996–1997 led to a rise in female unemployment rates. Then the phenomenon reversed; heavy industry (mining, metallurgy) was downsized and light industry (e.g., the clothes, shoes, and food industry) re-grew. As a consequence, unemployment among men increased, whereas unemployment rates for women decreased. However, according to economic prognoses, light industry, a traditional sector in Romania that propels export and industry output, will also suffer from the adverse effects of current economic development (Dăianu 2001; SAR 2005).
The employment situation in Romania is rather peculiar. Since 1990 the agricultural sector, which in Romania is characterized by a high level of employment, has been growing constantly. Analysts suggest that the massive re-organization of the Romanian economy pushed people who previously worked in the industrial sector into the agricultural sector. In this respect, the agricultural sector has become an “employer of last resort.” These changes occurred while the sector suffered low levels of investment,16 low levels of productivity and mechanization, and high fragmentation of
arable land (Dumitru et al. 2004). In general, the agricultural sector consists of rural households that own small patches of fertile land, which are cultivated by non-paid family members. In most cases, agrarian production is used for private consumption only (93% of the agricultural workforce are self-employed and family workers).
The services sector experienced the most positive development, where the proportion of total investment rose from 20% in 1990 to 50% in 2001, and pushed GDP growth. Thirty-six percent of the total workforce are employed in the services sector, and taken together with the construction sector, these two sectors account for 55% of GDP. However, compared to total employment, the proportion of services sector jobs remained at the same level.
4.1.4 Employment
At the time of the regime change, about 5% of the workforce was unemployed (Zamfir et al. 1994). By 1999 the figure had risen to about 11%, then fell to about 6% in 2004 (NIS 2005b). The decrease in unemployment figures was more the result of migration than of job creation policy or measures. At least two million people – other estimates suggest a figure of about four million – left Romania to search for jobs outside the country. The Romanian job market is characterized by declining job opportunities and steep decreases in real wages.
Unemployment rates in urban areas are lower compared to rural areas, possibly due to the absorption of the workforce into the agricultural sector. This might hide real unemployment. At 18% in 2001, unemployment is highest among the younger generation, i.e. people aged 15–24 (NIS 1996–2003). High rates are also found among those above age 40. People between 25 and 40 years of age are the most active in the workforce.
Although unemployment rates are lower among women (in 2004, 7% of women and 9% of men searched for a job), labor-force participation rates by gender reveal that women have lower participation rates (52% of all women participate in the labor force compared to 64% of men). Yet their rates are rising. In 2004, 20% of the female labor force worked as “unpaid family workers” in the agricultural sector. This compares to a mere 7% of men. In Romania female employment rates are related to increasing female participation in education. Since more women than men attend higher education, these women are not available on the labor market. This in part and the number of women who are housewives (about 2.5 million according to NIS, 2003) might account for the gender differences in the Romanian unemployment rate.
4.1.5 Poverty and living standards in Romania