University of New Orleans University of New Orleans
ScholarWorks@UNO
ScholarWorks@UNO
University of New Orleans Theses and
Dissertations Dissertations and Theses
5-15-2009
Measuring Accessibility and Explaining Trends in Commute Mode
Measuring Accessibility and Explaining Trends in Commute Mode
Choice in Washington, D.C. from 1970 - 2000
Choice in Washington, D.C. from 1970 - 2000
Jonathan Ryder
University of New Orleans
Follow this and additional works at: https://scholarworks.uno.edu/td
Recommended Citation Recommended Citation
Ryder, Jonathan, "Measuring Accessibility and Explaining Trends in Commute Mode Choice in
Washington, D.C. from 1970 - 2000" (2009). University of New Orleans Theses and Dissertations. 955. https://scholarworks.uno.edu/td/955
This Thesis is protected by copyright and/or related rights. It has been brought to you by ScholarWorks@UNO with permission from the rights-holder(s). You are free to use this Thesis in any way that is permitted by the copyright and related rights legislation that applies to your use. For other uses you need to obtain permission from the rights-holder(s) directly, unless additional rights are indicated by a Creative Commons license in the record and/or on the work itself.
Measuring Accessibility and Explaining Trends in Commute Mode Choice in Washington, D.C. from 1970 – 2000
A Thesis
Submitted to the Graduate Faculty of the University of New Orleans In partial fulfillment of the Requirements for the degree of
Master of
Urban and Regional Planning Land Use and Environment
By
Jonathan P. Ryder
Table of Contents
List of Figures... iii
List of Tables... iii
Abstract ... iv
Keyword... iv
1. Introduction ... 1
Research objectives... 2
Project Area ... 2
Research Questions ... 3
2. Methodology... 5
Level of Analysis... 5
Data Sources... 5
Basis for Analysis and Model Type... 6
GIS Data Acquisition... 7
GIS Attribute Creation and Location Analysis ... 7
Land Use Analysis and Creation of proxy variables ... 10
Census Data Acquisition ... 12
Statistical Analysis... 13
Intended Results... 14
3. Literature Review... 16
Overview of Trends in Commuting and Land Use Over the Past Century... 17
The Transit City ... 17
The Automobile City... 18
Problems Associated with Land Use and Transportation ... 20
Proposed Solutions... 23
Conclusion of Literature Review... 25
Restatement of Research Questions... 26
4. Discussion... 29
Results of Analysis ... 29
Model #1: Transit Use in 2000 ... 30
Model #2: Transit and Non-Motorized Transportation Use in 2000 ... 32
Model #3: Change in Transit Use, 1970-2000... 34
Model #4: Change in Transit and Non-Motorized Transportation Use, 1970-2000 ... 35
5. Conclusions ... 37
Explaining Commute Trip Mode Choice... 37
Limitations on Research... 39
Further research ... 40
Policy implications... 42
Bibliography... 45
Vita... 48
List of Figures
Figure 1: Output of GIS Analysis... 8Figure 2: Change in Non-automotive Commuting ... 9
Figure 3: Population Change in Washington DC, 1970-2000 ... 10
Figure 4: Change in Minority population and Transit Use, 1970-2000... 13
Figure 5: The Transit City... 18
Figure 6: Percent of Household Income Spent on Transportation ... 22
List of Tables
Table 1: Model Summary... 13Table 2: Variables... 15
Table 3: Mode Used to Commute to Work, US and Washington DC, 2000 ... 16
Table 4: Transport Cost Categories ... 21
Table 5: Adjusted R2 of Final Models ... 29
Table 6: Adjusted R2 of Variable Category Models... 30
Table 7: Transit, 2000... 31
Table 8: Transit + Non-Motorized Transportation, 2000 ... 33
Table 9: Transit, 1970-2000 ... 35
Abstract
This study attempts to find a correlation between commuting modes in Washington DC and characteristics of the city and the people that they serve. It investigates why some census tracts have experienced increases in the commuting share of alternative transportation, such as public transit, walking, and bicycling, while others haven’t.
Findings demonstrate that demographic variables such as percent Hispanic and foreign born were the strongest predictors of change in commute mode share followed by distance to train station. Land use variables demonstrated weak correlations with variations in mode share due most likely to a lack of density gradient within the study area. The creation of variables to determine land use mix by census tract posed technical challenges as well.
Recommendations include policy addressing rising demand for more diverse transportation systems be implemented and further research be conducted on creating more accurate land use variables to include in the model.
Keywords
1. Introduction
Many factors affect which mode of transportation a person chooses to commute to work. A person whose home and work are far apart is more likely to travel to work in a car. Driving to work is also more likely if the person lives in an area with few transportation choices. On the other hand, a person living in an area where home and work are in close proximity, and where many options exist to connect the two, is more likely to use some other mode than a car. So how is that choice connected to the characteristics of the person and their environment?
Currently, there is a large body of research devoted to mode choice and there are many
approaches and explanations as to why one mode is selected over another. While one approach focuses on the effects of land use, another uses demographic variables. Still others show that transportation mode choice is simply a function of market forces (supply and demand). This study explores a combination of these in its attempt to explain mode choice in the District of Columbia (DC).
as means to get to work. A fourth variable found to be important in predicting mode choice is land use and use mix. While the effects of land use are still debated, it is an important factor to include in any analysis or policy decision (Ming, 2004). For this study, a true variable reflecting land use was not obtained, however, proxy variables were generated and will be discussed further below.
Research objectives
While it seems intuitive that commute mode choice trends in metropolitan areas would show more people using transit, walking, and bicycling, it is important to quantify what causes those trends. This project builds upon research conducted by Dr. John Renne in which trends in census data and case studies were used to determine the effectiveness of Transit Oriented Developments (TODs) in promoting an automobile-free lifestyle. Where that research was focused on TODs in urban areas across the United States, this research will focus on a single urban area, Washington DC, and study the change in mode share at the tract level over a thirty year period. The research will look at specific social, economic, and geographic variables and attempt to determine their correlation to mode choice.
Project Area
ranked as the second most congested city in terms of daily travel in “rush hour” conditions) (TCRP#102, 2004). It has the nation’s oldest, post World War II rapid transit system that was built to “specifically incorporate a goal of shaping regional growth in addition to fighting congestion and improving transit” (TCRP#102, 2004) which is administered by the Washington Metropolitan Area Transit Authority (WMATA), a regional transportation authority controlling bus and rail transit in the District, Maryland, and Virginia.
Washington DC is also a case study of the evolution of the American city. As it has developed, housing and industry has spilled from its boundaries into the previously rural land in the two neighboring states. Today, there are several major residential and employment centers encircling the city. While the majority of people living in the area still commute to work in or near the city by car, DC has a large percentage of commuters (nearly 48% in 2000) that use public transit and non-motorized travel modes. This study attempts to find out why this trend exists.
Research Questions
Two research questions will be addressed in this analysis: RQ #1
Why have some Census tracts within Washington DC experienced a decline in transit commute trips from 1970 to 2000 while others have not?
! Hypothesis: Areas with a high percentage of non-native residents yield higher transit use. ! Hypothesis: Proximity, frequency, and reliability of transit and land-use mix encourage
! Hypothesis: Socioeconomic variables have a stronger effect on mode choice than does urban form characteristics (such as density, distance to transit and city center, land use, node/link density).
RQ #2
What is the correlation between urban form characteristics (such as density, distance to transit and city center, land use, node/link density) and mode choice?
• Hypothesis: As land use mix increases, the mode share for automobiles and vehicle ownership will decrease.
• Hypothesis: As the node/link ratio (connectivity) increases, walking and biking mode shares will increase.
2. Methodology
In order to address the research questions stated above, a combination of qualitative and quantitative analyses were used. First, GIS shapefile and US Decennial Census datasets were collected for the Census Tracts that make up the District of Columbia. Second, GIS analysis was conducted using ESRI ArcMap 9.2 and ArcInfo 9.2 software. Third, regression analysis was conducted using SPSS statistical software. The results of these analyses are presented in the Conclusions section of this paper.
Level of Analysis
While Census data on population, housing, and socioeconomic characteristics are available at the census block level; census tract level data was used for this project. In some areas, such as rural or exurban, this level of analysis might not be appropriate because the tracts are far too large to conduct project level analysis (Johnson et al, 2004). However, in the case of the District of Columbia the tract areas roughly correspond to neighborhood areas and provide a scale detailed enough to produce meaningful results.
Data Sources
database. Additionally, the author created data during analysis such as percent change attributes and GIS layers showing proximity to Metrorail stations.
Basis for Analysis and Model Type
Before discussing the results of the analyses preformed in this study, it is important to understand how and why the models were developed. The two main inspirations for the creation of the model used here were based on the research done by Blumenburg and Evans (2008) and of Frank and Pivo (1994). In their analysis, Bumenburg and Evans compared tract-level data on
immigrant and foreign-born population to transit use data in San Francisco. They used two models: one used to control for geographic variation, and another to predict change over a thirty-year period. Similarly, this study utilizes tract-level census data in a static model and another analyzing change between 1970 and 2000.
The second resource used in formulating the model used here came from research conducted by Frank and Pivo (1994) in which they modeled the effects of urban form characteristics (density and land use mix) and non-urban form variables (income, gender, age, level of service) on travel behavior in the State of Washington. Similarly, in that study non-urban form factors were used as a control so that the effects of urban form characteristics could be seen.
GIS Data Acquisition
GIS shapefile data was downloaded from the District of Columbia Online GIS Clearinghouse
and was also provided by the Washington Area Bicyclists Association (WABA). Datasets
collected from the District include Metrorail and Metrobus line and point files, streets, sidewalks,
and land use. Also, a Central Employment Area polygon was downloaded that is being used as a
proxy for a central business district layer. Bike lane, signed bike route, and multiuse trail
shapefiles were provided by WABA. Shapefile data from The District was provided in a GCS
North American 1983 coordinate system and projected using NAD 1983 StatePlane Maryland
FIPS 1900. The data is referenced in meters. Layers that were not in the same coordinate
system were projected to match that of the District data.
All layers were added to a single project in ArcMap 9.2. Data tables containing US Census
tract-level data were then added to the project. Using the table join function, census attribute tables
were joined to the Census Tract TIGERline file downloaded from the US Census website.
Additional attributes were created within the tracts attribute table during analysis.
GIS Attribute Creation and Location Analysis
First, a census tract centroid layer was created using ArcMap 9.2. Next, using the Select by
Location query tool, attributes were added to the Census Tract layer. These include: number of
bus stops, length of street, bike facilities, and sidewalks, distance to the CBD, and area. A
Buffer analysis was also done to create .25, .5, and 1-mile buffers around all Metrorail stations
ArcInfo 9.2 was used to analyze the data using the Proximity Toolset from the Toolbox. A Near
Point analysis was conducted using the Census Tract Centroid and Metrorail point layers. This
tool creates a new table showing the linear distance between the input variable (Metrorail
Stations) and the layer selected for analysis (census tracts). This attribute data was then added to
the Census Tract layer attribute table.
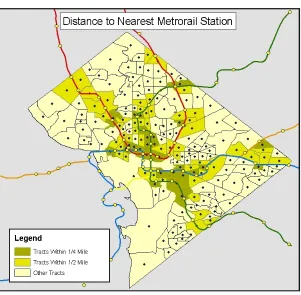
Figure 1 shows the results of the creation of Tract Centroids point layer and the proximity
analysis of census tracts that have their centroid within ! or " mile of a Metrorail station.
Figure 1: Output of GIS Analysis
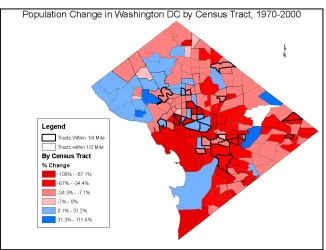
This layer was then overlaid on two layers showing change in population and change in
changes in the patterns of population and non-automotive travel. The results are shown in Figures 2 and 3 and suggest that the majority of census tracts in the District experienced a decline in non-automotive commute trips and in population. However, these figures show average results for each tract and do not account for differences in population density across tracts.
Figure 3: Population Change in Washington DC, 1970-2000
Land Use Analysis and Creation of Proxy Variables
GIS software was also used in an attempt to create a land use layer that could be used in
As proxy for this layer, Arcview 3 GIS software and Microsoft Access cross-tab analysis were used to create two derived variables to represent land use, a “parcel density” variable and total residential percentage in a tract”. The approach for creating a parcel density variable was to divide the total number of parcels by the area. Parcel Density is an indication of urban form and structure and it is assumed that were there are more parcels per square kilometer there will be a more dense urban area, higher population, and more residential land uses. It can also be assumed that areas with a higher parcel density would generate more trips. However, this method creates an average density and does not account for open areas like water or parks.
In order to improve the models and incorporate land use variables, it was suggested that the residential area as a percent of total area be used as a weighing factor. One such alternative measure suggested by Barnes (2001) is weighted density. Weighted density is calculated by computing the density of each census tract then assigning each a weight based on its percentage of the total population. This discounts large, sparsely populated census tracts, and gives extra weight to densely populated tracts. A discussion of weighted density was found on Austin Contrarian, a website devoted to zoning and land use issues of Austin, Texas.
Census Data Acquisition
US Decennial Census data was collected for each of the 188 tracts that make up the District of Columbia. Census tracts were chosen as the unit of analysis for three reasons: First, this research
builds upon previously conducted research in which the census tract was used as the unit of analysis; Second, census tracts offer a resolution fine enough to perform neighborhood level
analysis; and Third, tracts are the minimum unit of analysis maintained by Geolytics
Neighborhood Change Database (NCD), the program used to download the multi-census dataset.
Population characteristics were taken from a tract level census attribute dataset containing Summary File 3 (SF-3) data that was received from Dr. John Renne. This data contained
statistics from the 1970, 1980, 1990, and 2000 Decennial Census that had been rectified to the 2000 census tract boundaries. TIGERline shapefiles of the census tracts within the District of Columbia were downloaded from the US Census Bureau website. This layer was joined with the
Figure 4: Change in Minority population and Transit Use, 1970-2000
Statistical Analysis
Statistical analysis was conducted using SPSS for Windows statistical software and Microsoft
Excel. Census attribute data from the 1970, 1980, 1990, and 2000 census were used during
analysis. Four models were created which can be seen in Table 1.
Table 1: Model Summary
Model Time Period Dependent variable
#1 2000 Transit Use
#2 2000 Non-Automobile Transportation
#3 1970-2000 Change in Transit Use
#4 1970-2000 Change in Non-Automobile Transportation
The models used in this analysis follow closely those used by Blumenburg and Evans in their
recent analysis of the effects of foreign-born populations on transit use in San Francisco (2008).
In their model, economic, location, and demographic characteristics (specifically, percentage of
foreign born population) were used to forecast transit use. That study used Integrated Public Use
Microdata Series (PUMS) of the US Census as the data source. PUMS data was used because it
is the best source of information on travel of immigrants in California (Blumenburg and Evans,
2008). However, it was found that PUMS data lacks two very important variables that are
important to travel mode choice: transit service and coverage. The model used in this study
includes both of these variables for rail and bus as well as for bicycle facilities. Both static and
longitudinal analyses were conducted using the variables listed in the Table 2 below.
Intended Results
It is hypothesized that the census tracts that have a higher percentage of workers who commute
to work using public transit or non-motorized modes will also be areas in which the population is
more likely to be foreign born or minority, rent their home and not own a car. Further, such
areas will also have denser, diverse land use patterns, have better transport infrastructure, and be
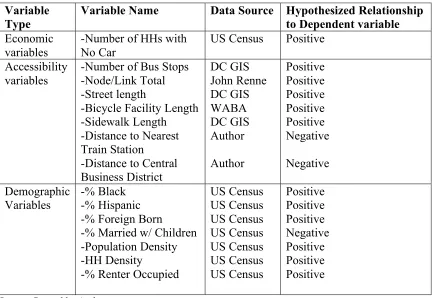
Table 2: Variables
Variable
Type Variable Name Data Source Hypothesized Relationship to Dependent variable Economic
variables
-Number of HHs with No Car
US Census Positive
Accessibility variables
-Number of Bus Stops -Node/Link Total -Street length
-Bicycle Facility Length -Sidewalk Length -Distance to Nearest Train Station
-Distance to Central Business District DC GIS John Renne DC GIS WABA DC GIS Author Author Positive Positive Positive Positive Positive Negative Negative Demographic Variables -% Black -% Hispanic -% Foreign Born
-% Married w/ Children -Population Density -HH Density
-% Renter Occupied
US Census US Census US Census US Census US Census US Census US Census Positive Positive Positive Negative Positive Positive Positive
3. Literature Review
In 2003, the Urban Land Institute published Ten Principles for Successful Development around
Transit (Dunphy et al. 2003). They stated:
In the early years of the 20th century, transit dominated travel in cities – and, by necessity, development was clustered near transit. In fact, transit and land use were so closely connected that private transit operators often developed real estate and used the profits to subsidize transit operations. By the close of the 20th century, however, the automobile had become the dominant means of travel in urban centers… Recently, however, new trends have emerged that favor cities, transit, and development around transit (p. iv).
Yet today the automobile still remains the mode of choice for a vast majority of travelers. In fact,
nearly 76% of all commute trips in 2000 were made driving alone in a car or other vehicle.
Table 3: Mode Used to Commute to Work, US and Washington DC, 2000
United States District of Columbia
Number Percent Number Percent
Total: 128,279,228 100.00% 260,884 100.00%
Car, truck, or van: 112,736,101 87.88% 128,775 49.36%
Drove alone 97,102,050 75.70% 100,168 38.40%
Carpooled 15,634,051 12.19% 28,607 10.97%
Motorcycle 142,424 0.11% 202 0.08%
Public transportation: 6,067,703 4.73% 86,493 33.15%
Bicycle 488,497 0.38% 3,035 1.16%
Walked 3,758,982 2.93% 30,785 11.80%
Other means 901,298 0.70% 1,664 0.64%
Worked at home 4,184,223 3.26% 9,930 3.81%
Source: 2000 US Census, SF-3 Data Table P30
In Washington DC, the percent of commuters that use public transit (33.15%) is very high
compared to the national average, but is still much lower than the total percent of commuters
traveling in an automobile. Before it is determined why this trend exists, an examination of the
Overview of Trends in Commuting and Land Use over the Past Century
Over the last 100 years, the American City has developed from a manufacturing and job center, to a hub of commerce, culture, and population in a sea of suburban and rural land. Today,
however, the city has lost some of its prominence as the social center of the community. This shift began in the late 1800s with the spread of mass transit and the invention of the automobile.
Prior to the implementation of commuter trains and the ubiquity of the automobile, people either lived and worked in the city or lived and worked on a farm. However, around the turn of the century, new breakthroughs in transportation made it possible for workers to live outside of the
urban center and travel in for work.
The Transit City
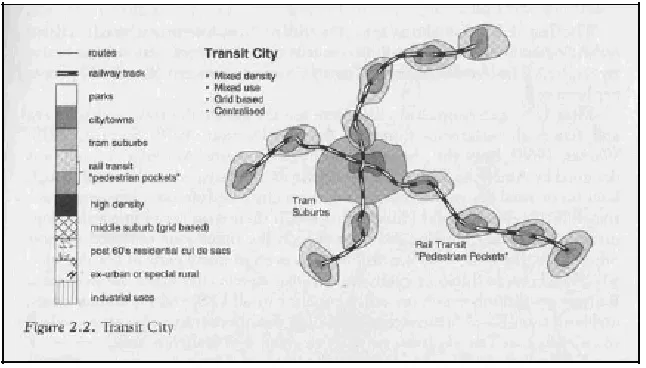
From around 1860 until World War II (WWII), the spread of transit changed the face of the city (Newman and Kennedy, 1999). Similar to the system depicted in Figure 5, train lines extending
from the urban core into the surrounding rural areas made it possible for workers to live outside the crowded urban core and travel in for work. New satellite residential centers popped up on
the fringe of the urban center as developers focused new construction around the train stations. However, these rural dwelling centers remained compact and dense allowing workers to walk to transit from their homes. This pattern may be seen as the first Transit Oriented Development
Figure 5: The Transit City
Source: Newman and Kenworthy, 1999
Until World War II, the majority of Americans still lived in a rural, agrarian culture. Between
1910 and 2000 the percentage of the population living in metropolitan areas (which includes
urban and suburban areas) grew from 28.4% to 80.3%, a nearly two-and-a-half-fold growth.
During this period the makeup of metropolitan areas was also changing as the percentage of
people living in suburbs grew from 7.1% to 50% of the total population, a growth factor of 21
(TCRP#123, 2008).
The Automobile City
During WWII, rural workers streamed into cities to fill positions at shipyards, armament
factories, and jobs in other wartime industries. After the war, soldiers returning from Europe and
the Pacific joined this population boom. As the “Baby Boomer” generation returned to form a
new post-war life, demands for housing forced the expansion of dwelling centers away from the
legislation made it possible for manufacturers to produce affordable houses and automobiles and for the average American to afford the purchase of both.
Similarly, the highway-building policies during the Eisenhower administration created an endless network of roads that allowed for easy, long distance travel. While this trend of
expansion allowed for the middle class to achieve the “American dream” of owning a home, it created an environment that was not conducive to the mass transportation systems that were in place. The widely spaced homes and poorly connected streets of suburban subdivisions put
transit services out of reach and residents were thus forced to rely on their cars for travel.
As workers moved further from their places of employment and began to reap the benefits of suburban life, employers began to follow suit. From the end of WWII until 2000, manufacturing
jobs declined in cities from 70% to 50%. By the 1970s and 1980s, major office parks were being
built at highway interchanges and on old farmland while downtown business centers became less
and less competitive with suburban, auto-oriented malls. Employers discovered cost savings in
building one-story production plants on cheap land in the suburbs compared to vertical buildings
in cities (Pucher, 2004). As jobs and houses moved into the suburbs, walking and transit became
archaic as most trips necessitated automobiles. By 2001, 86.4 percent of all trips made by
Americans were in an automobile. The journey-to-work by transit decreased from 12.6 percent
in 1960 to only 4.7 percent in 2000, while automobile commute trips increased from 66.9 to 87.9
Planners have supported this trend of reliance in the automobile over the last few decades with
policies that were put in place that facilitated automobile travel through vehicle-focused land use
and urban form policies. However, the wide streets, isolated land uses and low densities that
encourage automobile use have only further impeded walking, cycling, and transit use. Another
factor that drives auto and discourages other modes of transportation is the under-represented
costs associated with driving. The most expensive costs, including payments for vehicle
ownership, maintenance, insurance, and registration, are paid in fixed lump sums while variable
costs, including gasoline and occasionally parking and toll charges, are typically a fraction of the
overall cost. Thus, once a person buys a car there is an incentive to drive more to reduce the
marginal cost per dollar spent on the car (Renne, 2005).
Problems Associated with Land Use and Transportation
Such reliance on the automobile has contributed towards many of the problems faced by
Americans today. The true costs of auto travel - financially, environmentally, and logistically –
are now being realized. Still, there are many costs associated with any mode of transportation
that is not accounted for in estimating the true price of travel.
In 2006, the Victoria Transportation policy institute conducted a transportation cost and benefit
analysis that identified 20 costs associated with transportation (see Table 4). Some of these are
monetary such as construction and maintenance of vehicles and roadways. Others, such as
pollution, congestion, and transport diversity, are non-monetary and are often not accounted for
It was concluded in the study that the high use of automobiles for travel in the US is due to the
under-pricing of vehicular travel. While drivers feel the costs of ownership, congestion, and
time spent commuting they are immune to external cost such as pollution and the disconnecting
effect that roadways can have on neighborhoods.
Table 4: Transport Cost Categories !"#$%% &'#()*+$*",% !"#$%&"'()*"+,#$-' '.$/"0'%1,2,'13'1)*$*4'5'6"#$%&"7' !"#$%&"'(-"+52$1*'' !5+$58&"'6"#$%&"'%1,2,9'$*%&:0$*4'3:"&9'1$&9'2$+",9'21&&,'5*0',#1+2;2"+<'-5+=$*4' 3"",7' (-"+52$*4'>:8,$0$",'' .$*5*%$5&',:8,$0$",'31+'-:8&$%'2+5*,$2',"+6$%",7' ?+56"&'?$<"'' ?#"'65&:"'13'2$<"':,"0'31+'2+56"&7' @*2"+*5&'A+5,#'' A+5,#'%1,2,'81+*"'0$+"%2&B'8B'2+56"&"+,7' C/2"+*5&'A+5,#'' A+5,#'%1,2,'5'2+56"&"+'$<-1,",'1*'12#"+,7' @*2"+*5&'D5+=$*4'' (33;,2+""2'+",$0"*2$5&'-5+=$*4'5*0'&1*4;2"+<'&"5,"0'-5+=$*4'-5$0'8B':,"+,7' C/2"+*5&'D5+=$*4'' (33;,2+""2'-5+=$*4'%1,2,'*12'81+*"'0$+"%2&B'8B':,"+,7' A1*4",2$1*'' A1*4",2$1*'%1,2,'$<-1,"0'1*'12#"+'+150':,"+,7' E150'.5%$&$2$",'' E150)5B'35%$&$2B'%1*,2+:%2$1*'5*0'1-"+52$*4'"/-"*,",'*12'-5$0'8B':,"+'3"",7' F5*0'!5&:"'' ?#"'65&:"'13'&5*0':,"0'$*'-:8&$%'+150'+$4#2,;13;)5B7' ?+533$%'>"+6$%",'' A1,2,'13'-+16$0$*4'2+533$%',"+6$%",',:%#'5,'2+533$%'-1&$%$*49'2+533$%'&$4#2,9' "<"+4"*%B',"+6$%",'31+'2+533$%'%+5,#",9'"2%7'
?+5*,-1+2'G$6"+,$2B'' ?#"'65&:"'21',1%$"2B'13'#56$*4'5'0$6"+,"'2+5*,-1+2',B,2"<9'-5+2$%:&5+&B'2+56"&'1-2$1*,'31+'*1*;0+$6"+,'5*0'&1)"+;$*%1<"'-"1-&"7' H$+'D1&&:2$1*'' A1,2,'13'6"#$%&"'5$+'-1&&:2$1*'"<$,,$1*,7'
I1$,"'' A1,2,'13'6"#$%&"'*1$,"'-1&&:2$1*'"<$,,$1*,7'
E",1:+%"'C/2"+*5&$2$",'' C/2"+*5&'%1,2,'13'+",1:+%"'%1*,:<-2$1*9'-5+2$%:&5+&B'-"2+1&":<7' J5++$"+'C33"%2'' G"&5B,'2#52'+150,'5*0'2+533$%'%5:,"'21'*1*;<121+$K"0'2+56"&7'
F5*0'L,"'@<-5%2,'' C%1*1<$%9',1%$5&'5*0'"*6$+1*<"*25&'$<-5%2,'2#52'+",:&2'3+1<'&1);0"*,$2B9'5:21<18$&";1+$"*2"0'0"6"&1-<"*2'-522"+*,7' M52"+'D1&&:2$1*'' M52"+'-1&&:2$1*'5*0'#B0+1&14$%'$<-5%2,'%5:,"0'8B'2+5*,-1+2'35%$&$2$",'5*0'6"#$%&",7' M5,2"'' C/2"+*5&'%1,2,'5,,1%$52"0')$2#'0$,-1,5&'13'6"#$%&"')5,2",7'
Source: www.vtpi.org
Gas prices hit $3 per gallon in 2007, which is roughly double the price it was two years earlier.
This increased the average household's total transportation expense last year by 14 percent,
according to the Washington, D.C.-based Brookings Institute. This increase, on average, equated
household (Brookings Institute, 2006). In June of 2008, gasoline hit $4 per gallon for the first
time in US History putting even more strain on driver’s pocketbooks. People who had moved to
the suburbs in order to take advantage of cheaper housing are now spending a greater percentage
of their income on commuting costs. In 2008, a study done by Reconnecting America showed
that people residing in areas with good transit and walkable neighborhoods were able to use less
than 10% of their income for transportation. Conversely, families living in areas where a car is a
necessity might pay upwards of 25% (Figure 6). For a family making $35,000 a year, this can be
a difference of over $5000 (Reconnecting America.org).
Figure 6: Percent of Household Income Spent on Transportation
Source: www.Reconnecting America.org, 2008
Auto travel affects the government budget just as significantly as that of individuals due to the
expansive transportation networks that are required by auto travel. In 2007, the City of Denver
faced expenditures of nearly $1.9 billion annually just to maintain the current levels of service on
area transportation networks (road and transit). These annual costs are nearly 2.3 times the entire
Vehicular transportation is also responsible for 60 to 90 percent of urban air pollution, which the
American Lung Association cites as the number-one health threat to Americans. Compared with
private vehicle emissions per passenger mile, public transportation "produces an average of 95
percent less carbon monoxide, 92 percent fewer volatile organic compounds, 45 percent less
carbon dioxide, and 48 percent less nitrogen oxide," according to the nonpartisan Center for
Transportation Excellence, based in Washington, D.C. (Urban Land, 2006).
Potential Solutions
Over the last several decades, planners and government officials have begun to react to the
negative effects of an auto-dependent society. Increased demand for transit and non-motorized
travel modes has increased interest in Transit Oriented Development (TOD). A TOD is most
commonly defined as a mixed-use, relatively high-density, pedestrian-oriented district that is
located within a half-mile of a high-frequency transit facility, usually rail. Furthermore, the urban
environment must encourage and/or facilitate transit use and walking through its urban form to
meet the definition of a TOD (Renne, 2005).
Renewed interest in densely populated living has driven cities to invest in redevelopment of
abandoned buildings and reinvestment in old urban centers. The principles of Smart Growth and
New Urbanism, which call for the creation of centers with mixed residential, commercial, and
retail land uses as well as creating walkable, people-friendly environments, are also seen in new
Congress has also taken steps to create opportunities for development of alternative
transportation networks. The Intermodal Surface Transportation Efficiency Act (ISTEA) and its
successor, the Transportation Equity Act for the 21st Century (TEA 21), have allowed transit to
compete more equally with road projects for federal funding. TEA 21 provided mechanisms
allowing regions to transfer (or “flex”) highway dollars to transit, of which some regions have
taken advantage to build new rail systems.
Since the early 1990s, many state and local governments have followed suit with initiatives for
the development of new transit, restrictions on sprawl, and other tools implementing measures of
Smart Growth. ISTEA and TEA 21 have also substantially increased funding for non-motorized
modes. In the period from 1971 to 1991, only $40 million was invested in bike lanes by the
federal government, while over $2 billion has been invested since ISTEA, resulting in over 20,000
miles constructed and an additional 10,000 more planned. In 2003, the federal budget for walking
and cycling facilities was $422 million compared to $6 million in 1990 (Renne, 2005).
Since the passage of ISTEA, planning and implementation results have been met with mixed
reviews. Under the act, the states were given significant new responsibilities for transportation
decision-making, but were expected to carry out these responsibilities in partnership with a
variety of public and private interest groups. Specifically, the issue of congestion has brought
about numerous challenges to urban planners and public officials. Strategies to alleviate
congestion became the focal point in mobility plans as cities and regions sought ways to control
also been required to create new mobility strategies that were environmentally friendly and
economically feasible as well (Goldman and Deakin, 2000). Often, however, policy makers
focused too heavily on alternative transportation improvements (i.e.: light rail, bicycle facilities,
etc) that did not cater to the demands of the majority of voters that commute by car.
With the passage of TEA-21, the states gained guaranteed funding for highway and transit
projects, which has allowed for a new flexibility in transportation project spending (Scweppe,
2001). Opponents of the act state that this flexibility has created incentives for cities to spend
money on transportation projects that are unnecessary and irrelevant to actual commuters.
Randall O’Toole, an economist, writer, and director of the Oregon-based Thoreau Institute, states
that ISTEA has led to the development of transportation systems that do not address the
problems of congestion and sprawl. For example, while many cities have spent millions of
dollars on light rail, bus, and bicycle infrastructure, these modes have experienced only a small
increase in demand relative to auto travel. Thus, O’Toole purports that ISTEA and TEA-21 have
created a system that attempts to force people to use public transit and in which true traffic
problems are not addressed (O’Toole, 1997).
Conclusion of Literature Review
This review of the literature shows that since World War II the American city has experienced a
shift in where people locate and in how people travel to and from work. In that time, the
percentage of commute trips made by automobile has increased while other modes (bus, train,
walking, and bicycle) have all declined. Presently, there exists a large body of literature that
choice to socioeconomic factors while others maintain that land use, density, and urban form characteristics are a main cause. Still others attribute mode choice to what is most available.
With rising concerns for the environment and the increasing price of gasoline, the Federal Government have made efforts through legislative action to create incentives for local governments to increase infrastructure for alternative travel modes. Specifically, ISTEA and TEA-21 created designated streams of funding for mass transit, walking, and bicycle
infrastructure improvements. While this has lead to the construction of new transportation systems, some purport that these improvements do not address the true demands of commuters.
Restatement of Research Questions
This study focuses on two research questions: RQ #1:
Why have some Census tracts within the Washington DC MSA experienced a decline in transit commute trips from 1970 to 2000 while others have not?
infrastructure (sidewalks and bike facilities), and connectivity of the street network. Research
conducted by Taylor and Miller using two-stage least squares regression of urbanized areas
found that 55% of transit ridership variation in urban areas could be explained by service
availability and density (Taylor and Miller, 2003). While the exact analysis was not replicated
for Washington DC, the change models used here do include analysis of transit availability and
density.
Further, this analysis concluded that the percent of zero-car households, percent minority and
immigrant residents, and population density also have a strong effect on transit mode choice.
Conversely, it was found that economic factors such as median income, per-month average
income, and percent of population 150% below the poverty line were not strongly correlated to
transit use.
There is also a body of research that suggests that population characteristics such as
race/ethnicity and county of origin affect commute mode share. In their study of the immigrant
population in San Francisco, Blumenburg and Evans found that transit ridership is highest
amongst new immigrants. In fact, after poverty rate, automobile ownership, race/ethnicity, and
residential location, the percentage of foreign-born persons remains one of the highest predictors
of transit use (2008, 19). To address the effects that these categories have on travel mode choice
RQ #2
What is the correlation between urban form characteristics (such as density, distance to transit
and city center, land use, node/link density) and mode share and vehicle ownership?
It might seem intuitive that land use would have a strong effect on travel mode choice. When
one thinks about densely populated urban areas, such as New York, Boston, or Washington DC,
images of people rushing in and out of subway trains and mobs of pedestrians waiting to cross at
an intersection come to mind. Conversely, when imagining suburban or rural areas, it is very
unlikely that one pictures anyone walking around other than for exercise. These intuitive
assumptions are often based in true patterns of mode choice.
In research conducted by Robert Cervero in 2002 it was found that in Montgomery County,
Maryland, an area adjacent to the study area of this paper, both land use mix1 at the origin and
destination of trips play a role in travel mode choice with increased land use mix at the
destination having a much stronger correlation to increased transit use. Ming found similar
results in a study of the role land use plays in travel mode choice. He found that “for work trips
in Boston, after travel time, cost, and socioeconomic factors were controlled for, higher
population densities at both trip origins and destinations were significantly associated with
higher probability of commuting by transit and non-motorized modes” (2004, 354). Ming also
found that higher employment densities and increased network connectivity at trip destinations
had a positive correlation to non-car travel. Horning et al, 2008, Ross et al, 1997, and Gordon et
al, 2004, also found similar results.
1
Land use mix = (origin): employment and population relative to countywide ratio;
4. Discussion
Results of Statistical Analysis
Using the variables listed in Table 2 on page 12, four statistical models were created. The first
set of models looked at 2000 Census data only, while the other set identified variables that were
highly correlated to change in mode use from 1970 to 2000. Using statistical computer
software, regression analysis was performed on each model. Results suggested which of the
variables were more strongly correlated to changes in transit use or non-motorized travel (which
includes all non-car travel modes).
The adjusted R2 of each model is shown in Table 5 below. As can be seen, the static models
created explain a greater amount of variance in travel mode choice than do the longitudinal
models. This outcome is most likely due to the use of variables that represent the absolute value
of existing conditions, such as length of sidewalks and bicycle facilities, as opposed to change
variables, such as increase in sidewalk miles. It is important to note, however, that because there
are so many factors that affect commute mode choice, including many not used in this analysis, a
model that explains even 20% to 30% of the variance can be seen as significant.
Table 5: Adjusted R2 of Final Models
Model Number! Adj. R2 Square! 1 – Transit, 2000! 0.431!
In addition to the four models listed above, two models were created in which the same variables were separated into two groups: accessibility or demographic. These variables were then tested for their correlation to transit and non-automotive travel to see which group has a stronger affect on mode choice. Overall, the accessibility variables, which include length of sidewalks, streets and bicycle facilities; and distance to the nearest Metro station and to the CBD, explained more of the variance in both Transit and Non-automobile travel choices. As was hypothesized, the prevalence of urban form characteristics such as connectivity, availability of sidewalks, and proximity to transit lines, is more strongly correlated to travel mode choice than are demographic variables.
Table 6: Adjusted R2 of Variable Category Models
Model! Adj. R2 Square!
Non-Automobile travel! !
Accessibility! 0.593!
Demographics! 0.423!
Transit-Use! !
Accessibility! 0.374!
Demographics! 0.241!
Source: Created by Author
Model #1: Transit Use in 20002
Model #1 tests transit use in 2000 against the variables listed above. The results of SPSS analysis are shown in Table 7 and suggest that transit use is higher in areas that are dense, well connected, and closer to transit stations.
Table 7: Transit, 2000
Variable B Sig.
(Constant) .287 .000
Number of Bus Stops in Tract .000 .911
Length of Sidewalk 1.65E-007 .089
Length of Street 4.54E-006 .017
Distance from Tract Centroid to nearest Metrorail Station (Meters) -1.85E-005 .000
Distance from Tract Centroid to CBD 1.40E-006 .291
Prop. Black Population 2000 .048 .126
Prop. Hispanic/Latino Population 2000 .437 .030
Prop. Population who are foreign born 2000 -.178 .275
Population Density 2000 (sq. meter) 60.557 .098
Percent of Renter Occupied Housing Units 2000 .022 .618
Length of Bike Facilities .005 .529
Nocarper0 .227 .003
Housing Unit Density 2000 4.93E-006 .171
Population Density 2000 -2.60E-005 .071
Percent Married with Children 2000 -.322 .011
NodeLinkTotal .000 .045
Source: Created by Author
The variable that is most strongly correlated is distance to metro rail station (Sig.=0.0) indicating
that distance from a train station is directly correlated to a person’s choice to use that travel
mode. Also, the finding that accessibility to transit is strongly correlated to usage is reinforced
below (variables include length of sidewalk and street and node/link ratio). The one
characteristic that was found to be only weakly correlated is length of bike facilities. This
finding is not surprising, however, as bicycles are not allowed on Metro trains during rush hour.
This deters commuters from riding their bicycle to the train station. Further, there are only two
bicycle racks on any Metro bus, further acting as a deterrent.
Another interesting result is the correlation between transit use and proportion of the tract
Evans in their research on transit ridership in California. Also significant is the correlation
between ridership and the number of households that do not own a car (Sig.=.003).
Results that are unexpected include the weak correlation to number of bus stops and the
proportion of foreign-born residents. Most likely, the ubiquitous presence and heterogeneous
spacing of bus stops throughout the city is the cause for that variable’s weak correlation to mode
choice. However, the weak correlation between transit use and percentage foreign-born
population is in conflict with the findings of Blumenburg and Evans. This may be explained,
however, by a large number of affluent foreign-born ambassadors and foreign government
representatives that reside in the District who are more likely to drive than take public transit.
Model #2: Transit and Non-Motorized Transportation Use in 2000
Similar to the last model, Model #2 is a static model looking at trends in 2000. This model,
however, focuses on all non-automobile commute modes as the dependent variable. Variables
that are strongly positively correlated to non-automobile commutes include length of street
(Sig.=.069), percent renter occupied housing (.040), and number of households without a car
(.000). Variables that are negatively correlated include distance to CBD (.007), distance to
nearest Metrorail station (.000), proportion of population identified as black (.000), and percent
of population that is married with children (.000). Findings support the hypothesis that Census
tracts closer to the CDB, and thus closer to the center of the city and more transit stops, will have
more non-car trips. Another explanation for these findings could be related to the higher
property values often found in city centers. Costly rent or mortgage could lead to lower numbers
Table 8: Transit + Non-Motorized transportation, 2000
Variable B Sig.
(Constant) .487 .000
Number of Bus Stops in Tract -.001 .409
Length of Sidewalk 1.12E-007 .159
Length of Street 2.83E-006 .069
Distance from Tract Centroid to nearest Metrorail Station (Meters) -2.23E-005 .000
Distance from Tract centroid to CBD -2.95E-006 .007
Prop. Black Population 2000 -.156 .000
Prop. Hisp./Latino Population 2000 .155 .345
Prop. population who are foreign born 2000 .074 .577
Population Density 2000 (sq. meter) 34.688 .246
Percent of Renter Occupied Housing Units 2000 .075 .040
Length of Bike Facilities -.004 .500
Nocarper0 .410 .000
Housing Unit Density 2000 4.03E-006 .172
Population Density 2000 -1.57E-005 .183
Percent Married with Children 2000 -.630 .000
NodeLinkTotal 1.79E-006 .987
The results of this analysis indicate somewhat surprisingly that density factors (population,
housing, and node/link) are not strongly correlated to travel mode choice. This may be due to
the relatively unsubstantial difference in density from the most to less dense census. Like Model
#1, the results indicate that length of sidewalk and bike facilities are not correlated strongly.
While bicycle trips only account for 1.8% of all commute trips in the District, walking trips total
11.8% of all commute trips made. This bicycle statistic could be low due to rider’s lack of
knowledge of bike routes or cyclists disregarding route designation. A possible cause of the low
walking statistic could be that walkers live so close to work that sidewalk density in not a factor.
Again, this model shows a weak correlation between public transit use and foreign-born and
high prevalence of wealthier foreign-born residents in DC and a low percentage of Hispanic
residents due to high rental prices may be the cause.
Model #3: Change in Transit Use, 1970-2000
Model #3 examines the change in mode use over the forty-year period between the 1970 and
2000 US Census. It is important to note that the Washington Metropolitan Area Transit
Authority (WMATA), the overseeing body of all transit in the DC area, was created in 1967 and
the first Metrorail line (Green line) was opened to the public in 1976. This corresponds to the
strong correlation between proximity to a Metrorail station and increase in transit ridership
(Sig.=0.0) as more transit availability results in more riders. It is also interesting that density
characteristics are not a strong factor in commute mode choice and that change in the availability
of sidewalk did not correlate to change in transit trips.
In this model the foreign-born and percent Hispanic variables showed strong correlation to
change in transit trips. This follows Blumenburg and Evans’ logic that new immigrants,
specifically Hispanics, use transit more then other minorities and immigrants residing in the US
for longer periods. Other variables exhibiting a strong correlation to change in transit use
include the node/link ratio and distance of tract to the CDB. Presumably these can both be
attributed to growth in population within Washington DC between 1970 and 2000. As
population increased, so did demand to transit. These new commute trips would follow the
Table 9: Transit, 1970-2000
Variable B Sig.
(Constant) -.014 .628
Number of Bus Stops in Tract .001 .446
Length of Sidewalk 6.27E-008 .534
Length of Street 8.29E-006 .001
Distance from Tract Centroid to nearest Metrorail Station (Meters) -1.90E-005 .000
Distance from Tract centroid to CBD 2.58E-006 .065
MarWKid70 .000 .160
Change in HH Density 1970-2000 .000 .270
Percent Change in No Vehicle HHs 1980-2000 7.54E-005 .765 Percent Change in Renter Occupied Units 1970-2000 .000 .250 Percent Change in Foreign Born Pop 1970-2000 -.001 .073
NodeLinkTotal .000 .007
Percent Change in Black Pop 1970-2000 -.002 .731
Percent Change in Hispanic Pop 1970-2000 -.001 .054
Length of Bike Facilities -.001 .898
Change in Density 1970 - 2000 (sq. meter) 5.619 .235
Source: Created by Author
Model #4: Change in Transit and Non-Motorized Transportation Use, 1970-2000
Model #4 addresses change in transit and non-motorized commute trips between 1970 and 2000.
In this model, number of bus stops per census tract is found to be a significant variable for the
first time in this analysis (Sig. = .060). This may be due to the unification and expansion of bus
service cross the DC metropolitan area under WMATA in the 1970s and 1980s. Also, distance
to the nearest Metrorail station is shown to be strongly significant (.000). Again, the proportion
of foreign-born residents and percent Hispanic population are shown to be correlated with
change in transit and no-car commutes (.231 and .022, respectively).
Here also for the first time, the node/link variable is shown to have a negative correlation to
change in non-car commute trips when in the other models it had a zero or slightly positive
period, became more likely to be minority, less likely to have children, and more likely to rent
their home. This evidence would correspond to the exit of white families to the suburbs of
Maryland and Virginia over this period.
Table 10: Transit + non-Motorized Transportation, 1970-2000
Variable B Sig.
(Constant) 4.586 .433
Number of Bus Stops in Tract .381 .060
Length of Sidewalk 1.33E-005 .508
Length of Street .001 .022
Distance from Tract Centroid to nearest Metrorail Station (Meters) -.004 .000
Distance from Tract Centroid to CBD .000 .449
MarWKid70 -.117 .039
Change in HH Density 1970-2000 -.127 .022
Percent Change in No Vehicle HHs 1980-2000 -.047 .349
Percent Change in Renter Occupied Units 1970-2000 .159 .029 Percent Change in Foreign Born Pop 1970-2000 -.196 .231
NodeLinkTotal -.103 .001
Percent Change in Black Pop 1970-2000 -1.309 .243
Percent Change in Hispanic Pop 1970-2000 -.308 .022
Length of Bike Facilities 2.304 .282
5. Conclusions
Explaining Commute Trip Mode Choice in Washington DC
From 1970 to 2000, DC saw many changes in its population and transportation systems.
Metrorail became available, WMATA centralized transit service under one provider, and bus
service was expanded across the District. The area saw shifts in population from within the city
to the surrounding counties in Maryland and Virginia and changes in ethnic and racial
populations. This study was conducted in order to determine the effect that these changes had on
commute mode choice within the District of Columbia.
Specifically, it attempted to answer two research questions. Research question one asked: Why
have some Census tracts within Washington DC experienced a decline in transit commute trips
from 1970 to 2000 while others have not?
It was hypothesized that areas with a high percentage of non-native residents would yield higher
transit use. Based on the results of regression analysis, it was found that the change in Hispanic
and foreign-born populations had the strongest correlation to change in transit use by census tract
between 1970 and 2000. This finding shows that growth trend of the Hispanic population in DC
is similar to that of the country as a whole. In the US, the Hispanic population has grown from
6.4% of the population in 1979 to 12.5% in 1999 (Hobbs and Stoops, 2002). This finding
similarly coincides with the findings of Blumenburg and Evans (2008).
It was also hypothesized that proximity, frequency, and reliability of transit and land-use mix
encourage alternative mode choice. Taylor and Miller (2003) found that transit availability could
explain 55% of variation in transit use. This study was unable to reach such direct conclusions
nearest Metrorail station and prevalence of bus stops, it is inferred that proximity to transit
service is highly correlated to transit use. It was found, using GIS analysis, that 44% of census
tracts with their centroid within a quarter mile of a Metrorail station experienced growth in total
population from 1970 to 2000 while 48.75% of tracts within 1/2 mile experienced growth.
Conversely, only 17.55% of all census tracts in the District of Columbia showed positive
population growth over the same period. These statistics may point to a higher demand for a
residence nearer to public transit stations.
Unfortunately, while land use mix has been shown to be an important factor in determining
transportation mode choice (Cervero, 2002; Ming, 2004), a working variable was not obtained
for this research. While two proxy variables were created, hey were not found to be significantly
relates to change in transit use or non-motorized transportation use.
The second research question asked in this study was: What is the correlation between urban
form characteristics (such as density, distance to transit and city center, land use, node/link
density) and mode choice?
Following the model for transit use in 2000, the results suggest that areas that are densely
populated, have good connectivity in the transportation networks, and are near to Metrorail
stations will have the highest transit ridership. Strangely, availability of bus stops and household
density are not factors strongly affecting transit ridership. The model also shows that dense
ridership. However, unlike Blumenburg and Evans’ findings, the proportion of foreign-born
residents was not a highly correlated factor.
When observing the results of the transit and non-motorized transportation model, a very
different picture is drawn. Here, the proportions of Hispanic and foreign-born residents were
found to be only weakly correlated to mode choice while the proportion of Black population was
found to be strongly correlated. Further, node/link density is very weakly correlated to mode
choice. In fact, of the four factors associated with density (population density by tract,
household density, population density by square meter, and node/link density) none are strongly
correlated to mode choice. This result may be due to two main factors: one, that within the study
area, these density factors do not vary across census tracts significantly enough to affect mode
choice, and two, that proximity to transit is more strongly correlated to choice.
The study of how people travel to work is highly complex with a variety of factors affecting the
outcome. With so many different variables, there are just as many different models attempting to
explain their effects. Besides the socioeconomic, accessibility, and locations variables used in
this study, there are a myriad others that were not explained. As such, the main lesson learned
from this study is that creating a single model to accurately measure the factors effecting travel
mode choice is very difficult and often cannot address all the factors affecting that choice.
Limitations on Research
One of the major limiting factors of this analysis was obtaining enough data. While plenty of
transportation mode choice and it is limited to choice of transportation to work. This question
limits the number of respondents to those who are old enough to work and those who are
employed. It also does not account for non-work related trips. While there are other sources of
travel data available, they often have similar problems.
Further, origin and destination data for work trips was not available for this study. Previous
studies by Cervero, 2002; Ming, 2004; Horning et al, 2008; Ross et al, 1997; and Gordon et al,
2004 have shown that this data is essential in showing the relationship between mode choice and
origin/destination density and land use mix. In those analyses, destination density and land use
mix were strongly correlated to transit and non-motorized commute trips. Also, higher
connectivity at trip destinations led to increased non-car travel.
Another limiting aspect was the creation of a variable that would accurately weight the effects of
land use on transit use. Parcel density and percent residential land use per tract were used as
proxies for a true land use mix measure. However, neither was found to be correlated to
commute mode choice. Further study and research is needed to fully develop a true land use
variable and to test the relationships between this variable and commute mode choice.
Further Research
In order to address the limiting factors that constrained the scope of this analysis, there are
several areas that are available for further study. First, while the District of Columbia was a
large enough area on which to conduct this analysis, it could have been more illustrative to use
each of the variables used. However, there are two limiting factors to conducting that research.
First, access to the necessary data is limited. Several different governmental bodies, ranging
from local to regional to statewide, in two states and the District that would need to be contacted
in order to collect all the data. Second, it is likely that the data collected by these agencies is in
varying levels of completeness and at varying levels of resolution (tract, county, region, etc.).
For example, the District of Columbia provides a comprehensive set of data on the city.
However, Montgomery County, the county directly northwest of the District, does not keep as
detailed a dataset making a continuous analysis impossible. Using this data in further analysis
could help develop a better model that better represents the land use characteristics that affect
travel mode choice.
As shown in previous research, land use is a strong determining factor in mode choice. Areas
that have a good mix of residential, commercial, and retail tend to see a higher demand for
non-automobile transportation. Also, areas that are denser and have road networks that are more
connected show increased walking and bicycling trips. The creation of a variable that shows the
weight of land use would be a key step in future commuter behavior studies. However, the
creation of a variable that captures the true relationship between land use and mode choice still
seems to elude researchers.
One aspect that could help in creating this land use variable would be the inclusion of origin and
destination data for commute trips. In other research it has been shown that land use at trip
destination is more influential on travel mode choice than is land use at the trip origin. This
information could be combined with the percent land use by type data that was configured by Dr.
In a study conducted by Kimpel , Dueker, and El-Geneidy (2007) measuring the effects of
overlapping service areas on passenger boarding at bus stops, it was found that the use of a
distance decay function when determining ridership at bus stops is much more accurate than the
use of the traditional one-quarter mile buffer used by researchers, including this study, and by
transit providers. While that analysis was conducted on the parcel level, the results could be
aggregated to the tract level by adding all resulting scores together. The use of this model in
further study on Washington DC would require additional manipulation of the GIS layers that
were downloaded from the DC GIS Clearinghouse, application of the decay model, and
summation of all results to the tracts level
Recommendations
While this study focused solely on Washington DC, the methods used could be applied to any
city and to urban areas of varying sizes.
The findings of this paper suggest that there are strong correlations between some urban form characteristics and travel mode share and indeterminate
correlations for others. While further research using a larger study area, more data, and a more
accurate model of land use may yield better returns, the true motives that drive mode choice may
never be fully captured.
Policy implications
According to a report by the Victoria Transport Policy Institute this year (VTPI, 2009) per capita
vehicle ownership and mileage have peaked in the US. Meanwhile, demand for alternative travel
auto travel will drop from the dominant mode of commuting anytime soon, it does mean that in the near future more diverse and balanced transportation systems will be in higher demand.
In order to address the demand for more diverse transportation systems, the current policies that shape them must be changed. The first shift in transportation policy that can be made is for
planners to shift their means of system evaluation from motor vehicle speed and congestion to overall system efficiency and diversity (VTPI, 2009). Instead of planning for growth (as in increased lanes and faster speeds) transportation networks can be developed that include various
types of travel modes that work in unison to increased overall efficiency. As emphasized by the results of models used in this analysis, there is a correlation between increased demand for
alternative transportation and growth in the populations of minorities, recent immigrants, and those who do not own a vehicle. As these demographic groups grow in the population, demand for alternative commute modes will grow as well. The degree to which demand for alternative
transportation grows will be in part to the policies which are implemented. If system health is gauged in efficiency, safety, convenience, and comfort, the resulting network will truly reflect
people’s needs.
Transportation policies that account for the true cost of each transport mode can be implemented
so that the value of alternative transportation modes is more apparent to the public. Similarly, pricing reforms such as parking pricing, congestion pricing, or pay as you drive insurance can
TODs, may help to increase demand for walking and bicycling while further deducing
automobile congestion.
It was also found that Hispanic and immigrant populations showed higher demand for public
transit services within the District. Policies that focus on areas where these populations are high
and provide better facilities, such as bus stop covers, decreased headway, and increased
reliability, can help keep demand for these services high. In census tracts that have a majority of
commuters who drive to work, innovative marketing techniques can be applied that show
walking, cycling, and using public transit as being convenient, efficient, and more appealing.
For metropolitan areas that wish to increase accessibility to transit and other alternative travel
modes decreasing proximity to facilities, increasing availability of transit, improving
connectivity of the transportation network, and targeting minority and foreign-born populations
Bibliography
Arrington, G B., and Robert Cervero. "Effects of TOD on Housing, Parking, and Travel." TCRP Report 128 (2008): 4-10.
Axhausen, K.W. "Geographies of Somewhere: A Review of Urban Literature." Urban Studies 37.10 (2000): 1849-64.
Barnes, Gary. Population and Employment Density and Travel Behavior in Large US Cities. St. Paul, MN: Minnesota Department of Transportation, 2001.
Blumenburg, Evelyn, and Alexandra E. Evans. "Planning for demographic Diversity the Case of Immigrants and Public Transit in California." Journal of the American planning
Association (2008).
Bradford, Chris. Austin Contrarian. 21 Sep. 2008. 19 Nov. 2008 <http://austinzoning.typepad.com>.
Cervero, Robert. "Built environments and mode choice: toward a normative framework." Transportation Research D.7 (2002).
Cervero, Robert, G B. Arrington, Janet Smith-Heimer, and Robert Dunphy. "Transit Oriented Development in the United States: Experiences, Challenges, and Prospects." TCRP Report 102 (2004): 229-60.
Cervero, Robert, and Kara Kockelman. 1997. "Travel Demand and the 3Ds: Density, Diversity and Design." Transportation Research, Part D 2: 199-219.
Frank, Lawrence D., and Gary Pivo. "Impacts of mixed Use and Density on Utilization of Three Modes of Travel: Single-Occupant Vehicle, Transit, and Walking." Transportation Research Record 1466 (1994): 44-55.
Ghosh, Debarchana, and Steven M. Manson. "Robust Principle Component Analysis and
geographically Weighted Regression: Urbanization in the Twin Cities Metropolitan Area of Minnesota." Journal of the Urban and regional information Systems Association 20.1 (2008): 15-25.
Goldman, Todd, and Elizabeth Deakin. "Regionalism Through Partnerships? Metropolitan Planning Since ISTEA." Berkley Planning Journal 14 (2000).