A SECOND EXPEKIMENT ON TESTING THE EEL ATI VE EFFICIENCY OF INSECT TEAPS.
By C. B. WILLIAMS, E. A. FRENCH and M. M. Hosxi * Department of Entomology, Bothamsted Experimental Station,
Harpenden, England.
The increased use of bait, light and suction traps in the quantitative study of insect populations, and occasionally in the attempted control of insect pests, has brought with it the necessity for a better understanding of methods of comparison of different traps. It is not possible to have two traps in the same place at the same time and, in the field at least, it is not possible to have two locations or trap sites so nearly identical that the differences can be neglected without test. So many factors affect the numbers caught in a fixed period and so many of the changes in population or activity are on a geometric scale, that running a trap for a few repetitions and lumping together the total catches does not give a result that is critical enough for our present standards.
The following account of a comparison of two types of insect light trap, and also two types of illumination, is given in some detail, more to illustrate the difficulties to be overcome, the experimental lay-out necessary and the subsequent form of analysis, than to display the actual results obtained.
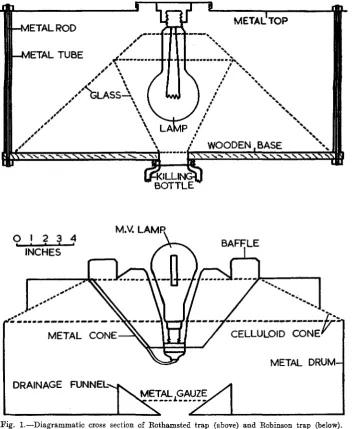
In a previous paper (Williams, 1951) an experiment was described to test the relative efficiency of three light traps, and some of the difficulties and complications of such an analysis are there dealt with. At the time of this first experiment we had available two types of trap—the Bothamsted and the Eobinson type (see fig. 1), and two sources of light—the ordinary electric bulb and a mercury-vapour type. Our test was incomplete, as although we had two Eothamsted traps, one with an ordinary light and one with mercury-vapour light, we could only obtain one Eobinson trap, which was used with mercury-vapour light. To have completed the test we should have had a second Eobinson trap with the ordinary light. Also this first test dealt with only one group of insects, the Macrolepidoptera, and only over a period of fifteen days in August 1950 during which we had the Eobinson trap on loan.
In addition to the above shortcomings, we realised later that there was another variable of interest that we had overlooked, namely, the effect of a trap used one night on the insect population available to be caught the following night. For example, one type of trap might be very efficient in attracting insects to its vicinity, but less efficient in trapping them, so that there would be a large population near at hand on the following night; another type might be efficient at catching them near at hand but might not draw them from a distance, thus reducing the population available to the trap that occupied the position on the following night. In our first experiment the three traps followed each other in a regular sequence, so that any effects of this nature could not be measured. In 1953 we decided to repeat the comparison of traps on a more complete
basis with the following conditions: t
(1) The four traps used were a Eothamsted type with ordinary light (A) or ultra-violet light (B), and a Eobinson trap with ordinary light (C) or ultra-violet light (D). The source of ordinary light was a 200-watt electric light bulb, and of ultra-violet light was a 125-watt mercury-vapour lamp.
* Now at the Faculty of Agriculture, Cairo University, Giza, Egypt.
194 C. B. WILLIAMS, K. A. FRENCH AXD M. M. HOSNI.
(2) Four sites were chosen, in the same woodland as that used in the previous experiment, about 60 yards apart and, owing to the fairly thick under-growth, not directly visible from each other.
(3) The sequence of trapping was so arranged that at the end of a cycle each trap had been an equal number of nights at each site, and at each site each trap had followed itself, each other trap and a night of no trapping.
(4) All orders of insects were counted separately. (5) The tests were spread over the summer months.
The condition in (3) that traps should follow nights of " n o trapping " neces-sitated either a fifth site or nights of no trapping interspersed through the cycle.
ETALROD
-METAL TUBE
BOTTLE
O ! 2 3 4 INCHES
M.V. LAMR
BAFFLE
DRAINAGE FUNNEL
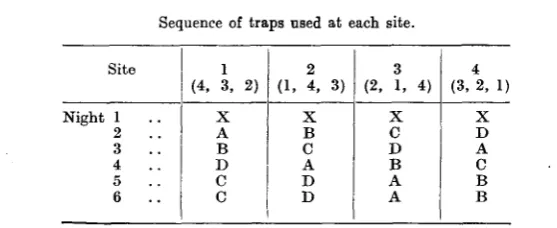
The design of such an experiment was not easy, but was finally almost completely solved by the adoption of the sequence shown in Table I, which resulted in a cycle of 24 nights, in which there were twenty nights of trapping and four of no trapping.
Table I shows the sequence in which the traps are used at each site during the first six nights of the cycle. At the end of this period, site 1 continues with the original sequence of site 2; then, after six nights more, with the original sequence of site 3, and finally with the original sequence of site 4, completing the 24-night cycle.
TABLE I.
Sequence of traps used at each site.
Site
Night 1
2 3 4 5 6
1
(4, 3, 2)
X A B D C C
2
(1, 4, 3)
X B C A D D
3
(2, 1, 4)
X c D B A A
4
(3, 2, 1)
X D A C B B
The figures in brackets indicate the sites at which the given trap-sequence is used in succeeding 6-night periods. X indicates no trapping and A-D the four traps.
The only drawback to the plan is that " no trapping " (and hence trapping following a night without trapping) occurs in all four sites simultaneously, thus slightly increasing the error of estimation of catches " after no trapping ". The only methods that we discovered of avoiding this were either to increase the number of sites to five, or to double the length of the cycle, both of which introduced new and more undesirable sources of error.
Four complete 24-night cycles were carried out during 1953, as follows: — (1) 11th May-3rd June
(2) 4th-27th June
(3) 19th July-12th August * (4) 31st August-23rd September
A total of just over 370,000 insects was caught, of which approximately 17,000 were in the first cycle, 33,000 in the second, 177,600 in the third and 142,600 in the fourth. The division among the traps was approximately 72,600 in A, 192,500 in B, 21,400 in C, and 83,000 in D.
All insects were counted separately into the following groups: (1) Macro-lepidoptera, further subdivided into Noctuidae, Geometridae, and " Other Families ", (2) Microlepidoptera, (3) Diptera and (4) " Other Orders ", which included varying numbers of Coleoptera, Heteroptera, Homoptera, Hymenoptera, Trichoptera and Neuroptera. Table II shows a typical set of results for the third cycle of trap B.
For analysis, all the catches were converted to a logarithmic scale (to two decimal places) as. described in a previous paper (Williams, 1937). Table III shows the Macrolepidoptera for the four traps and the four cycles on this basis. The values were then sorted and cross-added as shown in Table IV, which gives the analysis of the Macrolepidoptera in the third cycle. In this Table, by adding
TABL E II . Detail s o f catche s o f insect s i n Eothamste d tra p wit h mercury-vapou r lam p (B) . Thir d cycle , 19t h July-12t h Augus t 1953 . Nigh t o f cycl e Macrolepidoptera : Noctulda e Geometrida e Othe r Familie s Tota l (Macrol. ) Microlepidopter a Dipter a Othe r Orders : Coleopter a Homopter a Heteropter a Neuropter a Hymenopter a Trichopter a Tota l (Othe r Orders ) Tota l
1 — — — — — - — — — — — — — —
2 43 77 6
12 6 20 7 463 2 7
26 0 0 18 1 46
501
1
3 47 61 5
11
3
25
9
446
1 4 26 0 0 19 0 49
488
2
4 21 17 4 42 38 525 2 0 0 0 4 0 6
61
1
5 32 31 6 69 76
70
2 1 1 0 0 5 1 8
85
5
6 32 37 5 74
11
1
190
9 8 4 0 0 11 0
2
3
211
7
7 — - - — — — — — — — — — — —
8 12 43 1 56 28
194
0 4 6 0 0 8 0
1
8
204
2
9 75 54 7 76 86
128
0
12 0 1 0 9 0 22
146
4
1
0 24 27 5
5
6
4
4
118
7 2 2 0 0 5 0 9
129
6
1
1 25 46 3 74 65
125
3 4 3 1 0 3 0
1
6
140
8
1
2 16 16 0 32 4
35
1 2 3 0 0 8 0 8
39 5 1 3 — — — — — — — — — — — — — — 1 4 5
38 5 48
12
4
112
0 6 9 0 0 7 0 22
131
4
1
5 46 71 8
12
5
10
8
130
8 8 44 0 0 16 0
6
4
160
5
1
6 81 92 5
17 8 19 5 333 4 9
88 0 0 23 0
12
0
382
7
1
7 69 94 10
17 3 16 6 184 8
28 112 1 0 13 0
15
4
234
1
1
8 75
139 JO 22
4 27 1 572 4 42 194 7 2 45 1 29 1 651 0 1 9 — — — — — — — — — — — — — — 2
0 75 55 5 75 91
276
4 7
13 0 1 14 1 30
296
0
2
1 78
197 12 28
7 19 9 1000 0 8 170 1 1 26 3 20 9 069 5 2
2 49 72 8
12 9 16 7 524 0 3
14 0 0 19 1 37
557
3
2
3 64 77 S
14 6 15 4 1448 0 4
15 0 0 31 2 52
483
2
2
4 750 775 10
33 3 26 5 2515 5
10 98 9 0 34 4 155
2590 8 Tota l fo r cyel e
899 1417 120 213
6
265
8
8921
3
159 824 20 4 318 14
133
9
9664
6
.9. t~ Mea n eg CM eg OS 00 IN r-i m rH r H CO 1—1 © os CO r-CO CO cycl e •s Nigh t )-7 0 s © 30 © g 6 eo % i g •"" o o o 1-6 1 ? 1 00 © s ©
s
r H © o IN 1 g © © <N 00 ? op O O o o 11 1 2 1 00 <p fM " •J S9-I i , H 1-1 g O 3 4 "-" g o 88 1 r H r H © © 00 ? i rH © © © 1 g © r3s
© 1 m © © g o 60 o 06 0 1 <-) S3 r H r-> © gs 6 6 S o 1 ST
t Cycl e Tra p [ H © CO © 1 r-l O I N © 1-1 5 1 o r ^ i 5 3 r H ? CO CO g 1 •-Is
CO " - "g O 1-3 0 1 CO
s
©r - t
1-2
8
r H
1
fl
«eg co rHco eg I N
CO CO r H CO r H m T H 88 1 CO 1 CO r H ? eg on CM
m CM
rH CM
00 CO rH CM
00 OS ^ *
rH ift i n
eg SO-3 1 g rH eg
t o CM
00 ©
1 1
S o
O <N
?S
CO OS CM OS
CD e g
CO GO
o s • > *
S S H N
1 CO 4 0 -1 >o Oi o 10 0 1 0 4 10 0 S r H 1 i
•S - i
a d C y Tra p Sec o
1 1 1 00 iO CO • I
s
"-•s
-
1 98 1 1 CD SI - *
to O rH CM ^ rH rH rH CO rH rH US © rH eg g s 1 I O CD o in co »n
I N co
© ©
00 00 W
6 ? eo r H I © rH 1-2 3 1-1 5 § n r H 1 1 at • < y—1 2 Ju l e(2 0
1
•5 19CM• n os r - l
CO 1O rt
s
CM O J eg
eg t o CO CO 1 o m CO CO
r Heg
CM on •-1 OS
s
1 s r H ? CO r H S3 CM ? I © CM ©m eg m co
OS © 1
s
Os <O I m 3 1to eg co
r H CO CO r H © CO r H © © 1
°
r-l CO © ? CO 1 < Tra p r H 8 - H «o r H r H CD CO r H o eg r H OS CO oo o rH CO IN 1 00 00 •"" <O § © CM 1 PQ r H m 1 m g r-* 00 in IX-S OS 1 r> CD CO T-t CO IN r H g CM I N 1 CD r-t 00 rH m r-t I N CO OS m o> 1 o r H I A •6 1 © © © 09-0 © CO © [ o 09 0 in co i-f OS 4 8 © © g © o 00 © 2 1 e © in0 0 <N
6 § 09 0 1 CM r H m OS o g o g 6 o 1 r H ? CO 1 r H 4 8 © on ©
s
© o rH r H 1 os
o © 1-0 4 ? 1 m rH sg © 3 S § f 1 i» eg ops
© © m os in rH 1198 C. B. WILLIAMS, E. A. FRENCH AXD M. M. HOSNI.
each of the four main rows and dividing by 20, we get (on the right) the mean log catch for each trap; by adding the five main columns and dividing by 16 we get (on the bottom row) the mean catch, irrespective of trap or site, after different traps have been used; and by adding rows A l . ' B l , Cl and Dl, and dividing by 20 (and repeating for sites 2, 3 and 4) we get the mean catch at each site, irrespective of trap or previous night, as shown below the Table.
TABLE IV.
Analysis of Macrolepidoptera in third cycle. Values as log (n + 1).
Trap
A
B
C
D
Site
1 2 3 4
1 2 3 4
1 2 3 4
1 2 3 4
Mean after trap
Catch following trap:—
X
1-73 1-87
1-40 100
1-76 2-10
1-88 1-69
1-46 1-43
1-52 1-60
211 1-94
1-73 1-98
1-70
A
1-60 1-26
1-28 1-80
2 0 6 2-46
2-10 1-89
1-91 1-57
1-18 1-18
1-85 1-80
1-83 2-05
1-74
B
1-65 1-68
1-20 1-50
2-52 2-35
1-52 1-88
1-52 1-57
1-97 1-43
1-54 2-23
1-86 1-72
1-76
C
1-30 0-85
1-75 1-53
217 2-24
1-88 1-85
1-52 2-13
1-62 1-15
211 2-00
1-70 2-23
1-77
D
1-93 1-94
1-45 1-49
2-25 1-76
1-63 211
1-28 1-26
1-52 1-34
1-59 1-65
2-26 2-06
1-82
Mean for trap
1-51
2 0 1
1-52
1-91
Site means: (1) 1-79, (2) 1-80, (3) 1-66, (4) 1-67.
The final analysis for different groups of insects for the four cycles are shown in Tables V-VII. Table V tabulates the differences due to type of light and type of trap; Table VI, the effect of trapping on the previous night; and Table VII, the difference between the sites.
From Table V it will be seen, for example, that, in the Macrolepidoptera, trap D gave the maximum log catch in three of the cycles and trap B in one. On the other hand trap A was lowest in three cycles and trap C in one.
From the right half of the Macrolepidoptera table it will be seen that the mean log catch in the Eothamsted traps, irrespective of the type of light, was 1-22, and in the Robinson traps 1-34 — a difference of 0-12 or, in terms of numbers, about 25 per cent, in favour of the latter. The two types of illumina-tion, irrespective of trap, gave a mean log of 1-08 for the ordinary electric light and 1-47 for the mercury vapour, the latter thus catching about 160 per cent, more than the former.
1»
.•a
> S1
I
I
coa>
106
• * > o • * 0 0
pp
A 10 IN IN
> - ' N i-H CO
*H iceo©
COH03C4
^ ( N 00 CO ^ OS 00 ^
1
I
o «
10 00
ooo«.
T-H -Hji CO 1 ^ r-HCO 0 0 00
00 IO l - l ~
9090
opes op <p
© ©©2,
C0
CO CO
o©
t3 l a
^H CNI C3 CSI CD I O CO I O
•SO©©
5
I
'8100O1 t ^ rH
00 t - (N co 00 CO CO I-H
> 1-1 CO
00 GO'S
r-T K C S ° O C O
eqco-w©
i-H O O
00 Cl t
CO CO CO C »
<JMOfl
CO « «
ill
ill
g 8 o '
tUDU on '
200 C. B. WILLIAMS, R. A. FRENCH AND M. M. HOSNI.
TABLE VI.
Effect of previous trapping.
Vie-VlUUo trap X A B C D X A B C D X A B C D 1 1-01 0-82 0-87 0-88
1 0 2
0 7 8
0-55 0-67 0-61 0-77 1 96 1-65 1-74 1-79 1-75 Cycle 2 3 Macrolepidoptera 1-32 1-43
1 5 8
1-42 1-50 1-70 1-74 1-76 1-77
1 8 2
Geometridae 0-90 0-91
1 0 2
0-86
0-93 1-51 1-52 1-50
1 5 4
1-48
Diptera
1-90
2-17 2 1 7 2 1 0
2 1 8
2-84 2-72 2-90 2-91 2-78 4 1 08 0-95 1-01 0-95 1-00
0 8 6
0-75 0-75
0-70
0-78
3 0 2
2-79 2-76 2-83 2-73 1-28 (18-0) 1-24 (16-4) 1-31 (19-4) 1-26(17-2) 1-34(20-9) 1-01 (9-2) 0-93 (7-5) 0-99 (8-8) 0-93 (7-5) 0-99 (8-8) 2-43 (268) 2-34 (218) 2-39 (245) 2-41 (256) 2-36 (228) 1 0-41 0-40 0-37 0-38 0-44 0-61 0-54 0-55 0-61
0 7 2
1 18
1-04
1-07 1 1 1 1 1 3
Cycle
2 3
Noctuidae
1-05
1-11
1 3 1
1-16 1-20 1-16 1-25 1 29 1-27 1-20 Microlepidoptera 0-67 0-96 0-94 0-92 0-92 Other 0-93 1-20 1 1 1 1 22 1 1 8
1-80 1 97 1-83 1-88 1-83 Orders 1-37 1-48 1-46 1 51 1-34 4
0 7 3
0-59
0-68 0-65 0-72
1 0 0
0-95 0-73 0-77 0-84 1 53 1-52 1-37 1-44 1-47 lYXUtill 0-84 (5-9) 0-84 (5-9) 0-91 (71) 0-87 (6-4) 0-89 (6-8) 1-02 (9-5) 1-11 (120) 1-01 (9-2) 1-05 (10-2) 1-08(11-0) 1-25 (16-8) 1-31 (19-4) 1-25 (16-8) 1-32 (19-9) 1-28(18-1;
Results for each group of insects and each cycle are given as the mean of the log transformations of the catches on the night following each type of trapping. The highest value in each column is shown in heavy type, the lowest in italics. The figures in brackets are conversions to actual
numbers and represent (antilog mean log value —1).
TABLE VII.
Effect of site.
Site 1 2 3 4 1 2 3 4 1 2 3 4 1 0-78 1 00 0-94 0-96 0-56
0 7 5
0-67 0-74 1-80 1-66 1-80 1 84 Cycle 2 3 Macrolepidoptera
1 5 3
1-52 1-39
1-32
1-79
1 8 0
1-66 1-67 Geometridae 0-98 1 01 0-86 0-84 1-60 1 59 1-41 1-44 Diptera 2-12 2-02
2 1 9
2-09 2-94 2-79 2-75 2-81 4 0-96
1 0 7
0-99 0-98
0-69
0 8 3
0-81 0-75
2 9 1
2-75 2-82 2-81 1-27(17-6) 1-35(21-4) 1-25 (16-8) 1-23 (15-9) 0-96 (8-1) 1-05(10-2) 0-94 (7-7) 0-94 (7-7) 2-44 (274) 2-31 (203) 2-39 (245) 2-39 (245) 1 0-31 0-41 0-39
0 4 3
0 7 5
0-44 0-62 0-66 1-12 0-92 1-08 1 31 Cycle 2 3 Noctuidae 1 29 1-20 1-08 1-10
1 3 0
1-28
1-17
1 1 9
Microlepidoptera 0 96 0-93 0-83 0-82 . Other 1-07
1 1 0 1 24 1-16 1-90 1 97 1-73 1-88 Orders 1-30 1-53 1-36 1 54 4 0-71
0 7 4
0-60 0-65 0-86 0 94 0-81 0-81
1 5 4
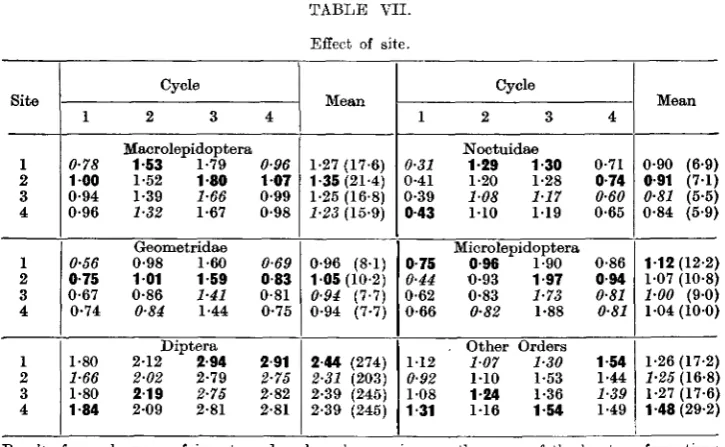
1-44 1-39 1-49 0-90 (6-9) 0-91 (71) 0-81 (5-5) 0-84 (5-9) 1-12(12-2) 1-07 (10-8) 1-00 (9-0) 1-04(10-0) 1-26(17-2) 1-25 (16-8) 1-27 (17-6J 1-48(29-2)
Eesults for each group of insects and each cycle are given as the mean of the log transformations ' of the catches at each site. The highest value in each column is shown in heavy type, the lowest in italics. The figures in brackets are conversions to actual numbers and represent (antilog
difference between the traps, but the mercury-vapour lamp was again distinctly more attractive.
In the Microlepidoptera, the Diptera, and in the other orders of insects, the difference between the lights remained high, the catch with ultra-violet being from two to three times that with ordinary light. But while in the first and last of these groups there was little difference in the efficiency of the two types of traps, in the case of the Diptera the Rothamsted trap caught four times as many insects as the Robinson trap.
Thus all groups of insects show distinctly more attraction to the mercury-vapour light, but the relative efficiency of the trap types varies according to the kind of insect. This will be discussed more fully later.
Table VI shows what effect the type of trap used (or the absence of trapping) on one night has on the catch of the following night. The mean log catch of the five independent groups (i.e., excluding the Macrolepidoptera) on the night after no trapping is exactly the same as the mean catch after all other traps. There appears, therefore, to be no consistent after-effect of trapping.
In Table VII the effect of site is shown, and this is also quite inconsistent. Within the groups there was occasionally slight evidence of consistency—in the Macrolepidoptera, for example, Site 2 was the most productive, or nearly so, in all four cycles, and analysis showed that this was due to consistent maxima in this site in all cycles in the Geometridae, and maxima or near maxima in all cycles in the Noctuidae.
TABLE VIH.
Analysis of variance in the first cycle.
Source of Variation
Macrolepidoptera
Total
Between nights
Between sites
Between traps
Effect of previous trap . .
Residual error
Diptera
Total
Between nights
Between sites
Between traps
Effect of previous trap
Residual error
Degrees of freedom
79 19 3 3 4 50
79 19 3 3 4 50
Total sum of squares
15-8521
8-6434
0-5535
2-3654
0-5114
3-7784
30-0573
19-1292
0-3946
6-9515
0-8211
2-7609
Mean square
—
0-4549
0-1845
0-7885
01278
0-0756
—
1-0068
01315
2-3172
0-2053
00552
P
—
<0-001
<0-10 > 0 0 5
<0-001
<0-20 >0-10
—
—
<0-001
< 0 1 0 >0-05
< 0001
0-01
—
% of variance explained
54-5
3-5
15-0
3 0 2 4 0
63-5
1-5 2 3 0 2-5 9-5
202 C. B. WILLIAMS, R. A. FRENCH AND M. M. HOSNI.
On the whole, however, there is little evidence of differences between the sites, a result which is gratifying in the present case, as they were chosen to be as similar as possible, so as to avoid interference with the main problem, which was to test the difference between the traps.
The significance of the above results can be tested by means of an analysis of variance, which is most easily done in two stages, first within the single cycles and then between the four cycles.
Table VIII shows as an example the analysis of variance of the Macro-lepidoptera, and of the Diptera, in the first cycle. With a total of 80 trap-nights (20 nights with four traps) there are 79 degrees of freedom. In the Macro-lepidoptera the difference between nights is, as would be expected, very highly significant at well under 1 in 1,000 and the difference between the traps attains an even higher level of significance. On the other hand, the effect of site is scarcely significant, the probability lying between 1 in 10 and 1 in 20, while the effect of the previous night's trapping does not even reach the 1 in 10 level of
TABLE IX.
Analysis of variance between the four cycles.
Source of Variation Degrees of
freedom
15 3 3 9
15 3 3 9
19 4 3 12
19 4 3 12
15 3 3 9
15 3 3 9
Sum of squares
2-4978 0-6638 1-7482 0-0858
5-8079 2-3869 3-3209 01001
2-3023 0-0175 2-2387 0-0561
4-4661 0-0239 4-4132 0-0390
1-8269 0-0322 1-7435 00512
3-4000 0-0388 3-3331 0-0281
Mean square
0-2213** 0-5827** 00095
0-7956** 1-1070** 00111
00044 0-7462** 0-0049
0-0060 1-3711** 00033
0-0107 0-5812** 0-0057
0-0127* 1-1110** 00031 (1) Traps and Cycles, Maorolepidoptera (Table V)
Total
Between traps Between cycles Residual error
(2) Traps and Cycles, Diptera Total
Between traps Between cycles Residual error
(3) Previous Traps and Cycles, Macrolepidoptera (Table VI)
Total
Between previous traps Between cycles Residual error
(4) Previous Traps and Cycles, Diptera Total
Between previous traps Between cycles Residual error
<5) Sites and Cycles, Macrolepidoptera (Table VII) Total
Between sites Between cycles Residual error
(6) Sites and Cycles, Diptera Total
Between sites Between cycles Residual error
significance. Of the total variation, 54-5 per cent, is due to the difference between the nights and 15 per cent, to the difference between the traps.
In the Diptera, the results are very similar except that there is some indication of a significant difference between the " previous trap " effects. Bather more of the total variance (63-5%) is due to the difference between nights, and also rather more (23%) to the difference between the traps.
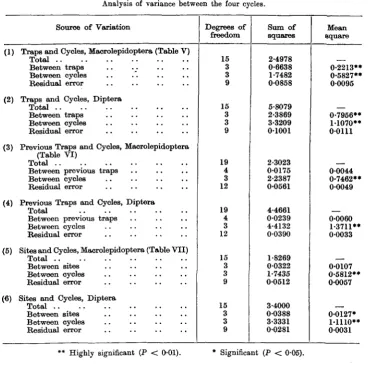
Table IX shows six examples of the analysis of variance between the four cycles for the Macrolepidoptera and for the Diptera, in each case for traps, for previous trapping and for site. In every case there are, as expected, highly significant differences between the cycles. The variation between traps is highly significant in both groups, but the effect of the previous night's trapping is significant in neither; the site effect is barely significant in the Lepidoptera but just significant in the Diptera.
Discussion.
Although the object of the present paper is to show the layout of a trap-testing experiment, rather than to discuss our particular results in detail, it may be interesting to point out that the essential differences between the two types of trap (see diagrammatic cross sections in fig. 1) are that in the Bothamsted design the light is inside the trap and there is an opaque roof, whereas in the Eobinson design the light is just above the trap and there is no roof. The roof was originally put on the first type to keep the rain from entering the killing bottle; in the Eobinson type the rain is allowed to enter, but is drained away below. The absence of a roof allows the light to be seen by insects passing overhead and so may result in greater efficiency. The position of the light may be responsible for some of the other differences mentioned above. In the Kobinson design, the light is just above the entry to the trap proper, so insects do not enter it unless they fly beyond the light. This occurrence is likely to depend on their momentum, and hence on their size and speed. Thus we find that the heavier-bodied, fast-flying moths of the family Noctuidae show the greatest difference in favour of the Eobinson trap, while the smaller and lighter Geometridae, the Micro-lepidoptera and the other orders show less difference. The very small and weak-flying nocturnal Diptera can be seen at night moving round and round the light of the Eobinson trap in a cloud a foot or so above the light, without going in, and this may well be associated with the relatively low captures of Diptera in this trap. It is possible that small alterations may produce a trap with the advantages of both types, and work is at present planned in this direction. We are proposing to test the Bothamsted trap with a smaller roof, and we have heard, since drafting this paper, that workers in Holland have increased the efficiency of the Bobinson trap, in respect of catching Diptera, by adding a small roof.
Thus, the general conclusions for the trap-type and illumination comparison are, first, that a 125 watt mercury-vapour lamp gives catches that are from one-and-a-half to three times as large as those with the 200 watt ordinary bulb, according to the group of insects caught; and, secondly, that the Eobinson trap is definitely better for catching the heavier, stronger-flying insects, while for the smallest insects the Eothamsted type is superior.
Conclusions.
2 0 4 C. B. WILLIAMS, R. A. FRENCH AND M. M. HOSNI.
With two traps and two sites, neglecting after-effects, the sequence ABAB in one site and BABA in the other is the simplest. If the after-effects are to be studied, then the sequence AABBAABB in one site and the reverse in the other covers all possibilities every four days, instead of every two as in the first case. With three traps and three locations, the sequences ABC, BCA and CAB, as described in the earlier paper, are sufficient if after-effects can be neglected, giving a cycle every three days.
With four traps (or two different traps and two different types of lighting), four sites and the sequences ABCD, BCDA, etc., give a complete cycle every four days if after-effects are neglected, but as soon as one allows for these, the complex layout of the present paper is necessary, with a cycle once every twenty-four days.
Summary.
The paper describes the layout and analysis of a test of two types of insect light-trap, the Eothamsted and the Eobinson, and two types of illumination. The layout consisted of four variations of the sequence of six nights X A B O D D (X being a night of no trapping and A-D the four traps) in each of four sites in a small woodland. At the end of a complete cycle of 24 nights there had been four nights without trapping; each trap had been an equal number of times in each site; and each trap had followed all four trap-types, and also no-trapping, an equal number of times. The complete cycle was repeated four times at intervals between May and September. All insects captured were sorted into orders and counted and each order was analysed separately. By analysis of variance (after transforming the numbers caught to a logarithmic scale) it was possible to show separately the effect of differences, (1) between nights, (2) between sites, (3) between types of trap, (4) between types of light, and, (5) between cycles, and also the effect (if any) of the previous night's trapping. It was found that ultra-violet light was more efficient for all orders than ordinary electric light, that the Eobinson type of trap was more efficient for the larger Lepidoptera but much less efficient for the small Diptera, but that there was no regular effect of the previous night's trapping. The largest source of variation was the difference between nights : difference between locations was small.
References.
WILLIAMS, C. B. (1937). The use of logarithms in the interpretation of certain
entomological problems.—Arm. appl. Biol., 24, pp. 404-414.
WILLIAMS, C. B. (1951). Comparing the efficiency of insect traps.—Bull. ent.