in the population sciences published by the Max Planck Institute for Demographic Research Konrad-Zuse Str. 1, D-18057 Rostock · GERMANY www.demographic-research.org
DEMOGRAPHIC RESEARCH
VOLUME 24, ARTICLE 3, PAGES 79-112
PUBLISHED 21 JANUARY 2011
http://www.demographic-research.org/Volumes/Vol24/3/ DOI: 10.4054/DemRes.2011.24.3
Research Article
Intergenerational transmission of women’s
educational attainment in South Korea:
An application of a multi-group population
projection model
Bongoh Kye
This publication is part of the proposed Special Collection “Social Mobility and Demographic Behaviour: A Long-Term Perspective”, organized by Guest Editors Cameron Campbell, Jan Van Bavel, and Martin Dribe.
© 2011 Bongoh Kye.
This open-access work is published under the terms of the Creative Commons Attribution NonCommercial License 2.0 Germany, which permits use, reproduction & distribution in any medium for non-commercial purposes, provided the original author(s) and source are given credit.
1 Introduction: Demography and social mobility 80
2 The South Korean context 83
3 Method: Multi-group population projection 85
4 Research questions 87
5 Data 88
5.1 Fertility 88
5.2 Mortality 89
5.3 Educational mobility 89
6 Results 91
6.1 Equilibrium distribution under observed mobility and differential
demographic rates 92
6.2 Equilibrium distribution under hypothetical educational mobility and differential fertility conditions
95
6.2.1 Impact of differential fertility on equilibrium distribution 96 6.2.2 Impact of intergenerational association on equilibrium distribution 97 6.2.3 Joint impact of mobility and differential fertility 101
7 Conclusion 103
8 Acknowledgments 105
References 106
Intergenerational transmission of
women’s educational attainment in South Korea:
An application of a multi-group population projection model
Bongoh Kye1
Abstract
Using a multi-group population projection model, this study examines the implications of educational mobility and differential demographic rates on changing women’s educational distribution in South Korea. This article focuses on the implications of a differential population renewal process on educational mobility, which has not been extensively examined in previous studies of social mobility. My findings suggest, first, that differential demographic rates have no substantial influence on the educational distribution, because of substantial educational mobility. Second, that intergenerational association and structural change matter in the long run, with stronger intergenerational association and more structural change leading to increases in women’s level of education. Finally, that educational mobility and differential fertility are interdependent processes that jointly influence differential population replacement, but the fertility gap between education groups would have to be unreasonably large to be influential, due to the extraordinarily high educational mobility in South Korea.
1 Cornell Population Program, Cornell University. Cornell University 120 MVR Hall, Ithaca, NY 14853.
1. Introduction: Demography and social mobility
This study examines intergenerational transmission of women’s educational attainment in South Korea as a process jointly determined by educational mobility, differential fertility, and differential mortality. Most previous studies on social mobility have focused on intergenerational association in socioeconomic outcomes (e.g., education and occupation) based on existing parent–offspring dyads. Departing from this approach, this study examines the implications of differential demographic rates, intergenerational association, and structural change between generations for the transmission of socioeconomic status across generations as a whole.
First, the approach in most previous research has not fully examined how differential reproductive behaviors affect social mobility. Research in social mobility has applied a variety of statistical models, such as path analysis and structural equation models for status attainment process (Blau and Duncan 1967; Hauser, Tsai, and Sewell 1983), log-linear models for intergenerational occupational mobility (Erikson and Goldthorpe 1992; Hout 1984, 1988), and schooling progression-ratio models for educational attainment (Mare 1981; Shavit and Blossfeld 1993). All these models aim at estimating net intergenerational association in socioeconomic outcomes after controlling for potential confounders and change in marginal distributions. Although this approach demonstrates how offspring’s socioeconomic outcomes depend on parental socioeconomic status, the implications of socioeconomic differentials in demographic behaviors for status transmission have not been widely studied. This is unfortunate, because intergenerational transmission of socioeconomic status is intrinsically “the process by which a socioeconomically differentiated population reproduces itself” (Mare 1997: 265).
the mobility analysis. Despite this early recognition of the potentially important implications of differential reproduction rates in the social mobility process, these were largely overlooked in mobility research until Mare and his colleagues recently revived this approach (Mare 1997, 1996; Mare and Maralani 2006; Maralani and Mare 2008; Choi and Mare 2009; Kye and Mare 2009). These studies showed that differential demographic processes have a significant impact on educational distribution in next generations in diverse societies (e.g., United States, Indonesia, Mexico, and South Korea) and that intergenerational mobility is much more important than differential reproductive behaviors in determining educational distribution in the next generation. In other words, these studies found significant but modest impacts of differential reproductive behaviors on the distribution of socioeconomic outcomes in the next generations.
Second, previous studies have also not paid enough attention to structural change.2 As in most mobility studies, I refer to structural change as change in marginal distribution of socioeconomic outcomes. Most research attempts to control for structural change in assessing the association between family background and socioeconomic outcomes, rather than exploring the implications of structural change for status transmission. The two most influential works in this field are exemplary in this regard. Erikson and Goldthorpe (1992) compared similarities and differences in the net associations between parental and offspring’s occupations across countries, controlling for country-specific structural differences. Mare’s “school transition model” (1981) examined how the association between educational attainment and family background changed in the United States over time, net of distributional change in educational attainment. These studies and their replications (e.g., Shavit and Blossfeld 1993) have shown geographic invariance and temporal stability of intergenerational associations, suggesting persistent inequality patterns in industrialized countries despite apparent diversity. Structural change between generations is typically treated as a confounder that masks genotypic intergenerational relationship (Featherman, Jones, and Hauser 1975). However, structural change itself should be crucial for differential population replacement. Greater educational expansion obviously entails higher levels of educational attainment in later periods if we hold constant the strength of the intergenerational association and differential demographic behaviors. In other words, differential demographic behaviors should not be influential in a society that
2 Simkus (1984) is an exception. His study examined the impact of structural change on occupational mobility
experiences rapid educational expansion. How, then, does educational expansion affect educational distribution over the long term? It may be unreasonable to think of a society in which educational opportunities continue to increase through countless generations, because this society would eventually reach saturation point. But it is worth examining equilibrium distributions under various conditions of structural change, because this sheds light on the long-term implications of such structural changes. In this study, I examine the long-term implications of structural change on differential population replacement, which has received little attention in previous research.3
Finally, intergenerational associations have been interpreted in a somewhat limited way in most earlier studies. Intergenerational association has been interpreted as an indicator of social inequality, with a stronger association implying less social mobility. However, the implications of intergenerational associations for differential population replacement have not been studied. This is unfortunate, because intergenerational associations may affect differential population replacement under certain conditions. For example, if reproduction rates are higher for the less educated groups, a strong association implies that the level of education in the next generation would be dampened to some extent. Therefore the intergenerational association not only indicates the degree of social fluidity but also influences differential population replacement.
To overcome these limitations in previous research on social mobility and to fully understand differential population replacement, we need a model that simultaneously accounts for net association, structural change, and socioeconomic differentials in demographic behaviors. The current study builds upon Mare’s work (1997), which developed such a model. Applying a multi-group population projection model, Mare demonstrated how the present distribution of educational attainment was influenced by educational mobility, differential fertility, and mortality of earlier periods in the United States. The first goal of the current study is to replicate Mare (1997) in the South Korean context. This context calls for such a comprehensive framework to understand simultaneous rapid socioeconomic development and demographic transition over the past half-century, which I will discuss in more detail in the following section.
Secondly, I extend Mare’s model (1997) by projecting population distribution to equilibrium with constant mobility and demographic rates. Mare (1997) used transitory mobility and demographic rates to project educational distribution in the United States. He calculated projections forward to the present with the initial distribution and
3 Some studies in educational mobility have examined the implications of structural change for the net
association to a certain extent. Studies based on the Maximally Maintained Inequality hypothesis found that the intergenerational association is weakened when “a given level of education is saturated for the upper classes” (Hout, Raftery, and Bell 1993: 25). Although the implications of distributional change drew attention in the Maximally Maintained Inequality hypothesis, the main concern is still the net association.
transient demographic and mobility rates in the 20th century. This is a straightforward approach for those interested in understanding the implications of transient mobility and demographic rates for the current educational distribution when sufficient historical data are available. However, without historical data over a sufficiently long period, this projection would not be very illuminating. Unlike in the United States, such data sets are not available in South Korea. Therefore, to assess the implications of educational mobility and differential reproductive behaviors on the educational distribution in later periods, I rely on one of the most important theorems in mathematical demography: “stable population theory.” This theory states that the age distribution in a closed population would reach “equilibrium” if the age-specific fertility and mortality rates remained constant over the long term (Keyfitz and Caswell 2005). Rogers (1995: 118– 119) showed that “equilibrium” exists in multi-group cases if the mobility rates between groups as well as differential demographic rates remain constant.4 The “stable model” is useful for examining the long-term implications of current demographic patterns and identifying the impact of each demographic element (fertility, mortality, and mobility) on population distribution (Preston, Heuveline, and Guillot 2001: 138). For example, if observed educational mobility rates and differential fertility rates yield the same “stable-equivalent” states as do observed mobility rates with (hypothetical) no differential fertility rates, this implies that the long-term implication of differential fertility is inconsequential. In other words, the equilibrium distribution is examined to understand the implications of current demographic and mobility rates for changing population distribution, although the assumption of unchanging demographic rates over the long term is certainly unrealistic and the equilibrium distribution may not be a good approximation of population distribution in the future. More simply, projection is used to understand current conditions rather than to forecast future conditions (Keyfitz and Caswell 2005: 271).
2. The South Korean context
Studying differential population replacement is particularly relevant in the South Korean context because of that nation’s fundamental socioeconomic and demographic changes over the past 50 years. A recent study characterized such a transformation as “compressed modernization” (Chang 2010). While industrialization and demographic
4 To reach “equilibrium,” the transition matrix should be imprimitive. The conditions for “imprimitivity” are
transition took more than a century in most Western countries, both were accomplished simultaneously in less than half a century in South Korea (see, e.g., Livi-Bacci 2006; Chang 2010). Such rapid and fundamental societal transformation has altered how socioeconomic resources are transmitted across generations. First, educational opportunity increased sharply and intergenerational association changed. While only a negligible proportion of women received some college education in 1960, 59 percent of women in 2005 did so (Korea Statistical Office 2008). This rapid educational expansion entailed exceptionally high rates of upward intergenerational mobility. For example, 45 percent of Korean people born between 1970 and 1985 whose fathers did not achieve a high school diploma receive at least some college education (Phang and Kim 2002: 208). Interestingly, the strength of intergenerational association in education remains quite stable, whereas the impact of family background on the educational transition at lower levels decreased more than the impact at higher levels did (Park 2003, 2007). This is consistent with the Maximally Maintained Inequality hypothesis, which stipulates that the chance of attaining a certain level of education among the lower classes increases only after upper-class people universally attain this level of education (Raftery and Hout 1993).
In sum, South Korea experienced rapid educational expansion that yielded high upward intergenerational mobility and fast fertility decline with decreasing fertility differentials by education. This combination has a very interesting implication for differential population replacement. These two trends may offset each other in affecting women’s educational distribution in the next generation. That is, differential fertility may slow the pace of educational expansion due to the higher reproduction rates of less educated women. However, this countervailing force should diminish as the educational differentials in fertility decrease over time. In this study, I assess the strength and interdependence of educational mobility and observed fertility differentials for the differential population replacement in South Korea.
3. Method: Multi-group population projection
t
M
xt
S
B
A population renewal model (Mare 1996, 1997), based on multi-group population projection, allows us to examine the intergenerational transmission of women’s educational attainment in South Korea, taking into account differential fertility and mortality. Using information on differential mortality and fertility and intergenerational educational mobility, we can construct a generalized Leslie transition matrix,
(Mare 1997: 274):
⎥ ⎥ ⎥ ⎥ ⎥ ⎥ ⎥ ⎥ ⎥ ⎥ ⎥ ⎥ ⎥ ⎦ ⎤ ⎢ ⎢ ⎢ ⎢ ⎢ ⎢ ⎢ ⎢ ⎢ ⎢ ⎢ ⎢ ⎢ ⎣ ⎡ = 0 0 0 0 0 0 0 0 0 0 0 0 0 0 0 0 0 0 0 0 0 0 0 0 0 0 0 0 0 0 0 0 0 0 0 0 0 0 0 0 0 0 0 0 0 0 0 0 0 0 0 0 0 0 0 0 0 0 0 0 0 0 0 0 0 0 35 30 25 20 15 10 5 0 40 35 30 25 20 15 10 t t t t t t t t t t t t t t t t S S S S S S S S B B B B B B B
M (1)
s are squared sub-matrices of which elements are five-year age-specific survival and intragenerational mobility probabilities, and s are squared sub-matrices of which elements are five-year age-specific maternity rates and intergenerational mobility probabilities. The dimension of the sub-matrices is determined by the number
xt
1
P
of education groups. I classify education groups into three categories because of data limitations: primary and less, secondary, and tertiary education. In general, the multi-group projection model allows individuals to change their states at any time (Rogers 1995). However, I assume that educational attainment is determined at the time of birth because I rely on a series of aggregate cross-sectional data and do not have information on intragenerational educational mobility. Given my interest in the change in the overall educational distribution of women, this assumption should not be of consequence for the analysis. This implies that s are diagonal sub-matrices of which diagonal elements are five-year survival probabilities of each education group. B s reflect educational differentials in fertility and educational mobility. A typical element in s is (5Fx + (5Lx+5/5Lx)*5Fx+5)*Eij where 5Fx is the education-age-specific maternity rate, 5Lx is the education specific person-years lived between age x and x+5, and Eijis the
outflow probability from education group i to j. Upon constructing a generalized Leslie transition matrix,we can calculate projected educational distribution 5×n years later:
xt
S
1 1)P
xt
B
2
1) ( )(
(M M M
Pn= n− " (2)
where is an initial population distribution by age and educational attainment
4. Research questions
The following questions are examined in order to study the implications of educational mobility and differential fertility for the differential population replacement:
1. How does educational mobility affect the education distribution of women in the long run?
2. How does differential fertility by education affect the education distribution of women in the long run?
3. How do educational mobility and differential fertility jointly affect the education distribution of women in the long run?
To examine the implications of educational mobility for differential population replacement, I use observed and hypothetical educational mobility rates. Hypothetical mobility matrices include the independence mobility matrix and the no structural mobility matrix, and then there are sets of hypothetical association and inheritance matrices. First, the “independence mobility matrix” fits the marginal distribution to the observed mobility matrix and imposes no association between mother’s and daughter’s education. A projection using the independence mobility matrix yields a hypothetical distribution of women’s education if there were no intergenerational association in women’s education. Comparing the resulting distributions from this scenario with those from the observed mobility matrix gives us the influence of the intergenerational association on women’s educational distribution. Second, the “no structural mobility matrix” is characterized by a mobility matrix where the intergenerational association is the same as the observed matrix, but the distribution of daughter’s education is constrained to be equal to mother’s education. This represents situations in which no structural change occurred and the association between mother’s and daughter’s education was equal to the observed association. Comparing this with the observed mobility matrix gives us the influence of structural change on the resulting distribution, controlling for the influence of the intergenerational association in education.5 Finally, I examine how change in the intergenerational association affects differential population replacement by using a set of hypothetical educational mobility matrices in which I change the intergenerational association and inheritance gradually, holding the marginal distribution constant. This approach makes it possible to examine if higher intergenerational association and immobility imply a higher level of women’s educational attainment in the subsequent generations, given observed differential
5 In this model, marginal educational distribution cannot be consistent with the observed data because of
fertility and structural change over the generations. In the results section, I will discuss how to manipulate association, immobility, and marginal distribution in more detail.
To examine the implications of differential fertility for population replacement, I use five different sets of differential demographic rates: (1) observed differentials, (2) no differential fertility with observed differential mortality, (3) no mortality differential with observed differential fertility, (4) no mortality and fertility differential at all, and (5) a set of hypothetical differential fertility rates. A comparison between (1) and (2) will show the overall influence of differential fertility on population replacement. Given the very strong educational mobility and modest fertility differentials in South Korea, the influence of differential fertility is expected to be modest at best. Therefore I use hypothetical differential fertility rates to see how strong the differential fertility must be to influence the differential population replacement substantially. In the results section, I discuss how to manipulate hypothetical differential fertility rates in more detail.
I conclude by analyzing how educational mobility and differential demographic processes interact in differential population replacement. For example, if there were no educational mobility (perfect immobility), the influence of differential fertility would be great and groups with higher reproduction rates would prevail ultimately. By contrast, if upward mobility were prevalent, the influence of differential fertility would not be great. The portion of highly educated women in the next generation would be high, regardless of the level of differential fertility. I also examine how the implications of educational mobility and differential fertility are mutually dependent, using the hypothetical educational mobility and differential fertility rates.
5. Data
5.1 Fertility
xt xt
To estimate age-specific fertility rates by education in South Korea, I use census and birth registration records between 1980 and 2005. From the census, I compute the number of women for five-year age groups and three education categories (less than primary education, at least some secondary education, and at least some college). This means that S s and B s in the transition matrix are 3×3 sub-matrices. More refined
children until their early twenties, women with tertiary education have higher fertility rates in their early thirties. Such educational differentials in the timing of childbearing could exert downward pressure on the educational distribution of future generations if educational mobility were modest.
5.2 Mortality
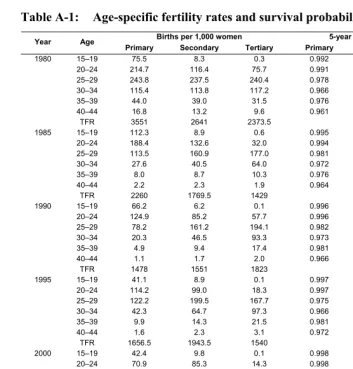
The South Korean birth registration system does collect information about the educational attainment of the deceased, but this is not publicly available. Without access to this data set, differential mortality schedules cannot be computed directly. Instead, I combine life-table estimates provided by the Korea Statistical Office (www.kosis.kr) and a scholarly publication that reports mortality ratios by education (Kim 2002). Using the formula to convert mortality rates to survival probability in life tables6 (Preston, Heuveline, and Guillot 2001: 49), I compute age-specific survival probabilities for each education group.7 This is shown in Table A-1. Better educated women enjoy more favorable mortality conditions, but the difference between the groups is not great. Such modest differentials imply a weak effect of differential mortality on the population distribution.
5.3 Educational mobility
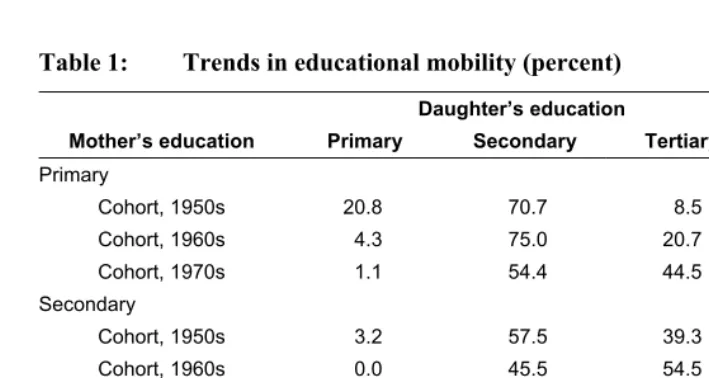
To compute educational mobility, I use the Korean Labor and Income Panel Study (KLIPS), an annual longitudinal survey representative of Korean individuals and households in urban areas (Phang et al. 1999). The KLIPS survey is an equal probability sample of households from seven metropolitan cities and urban areas, and was designed to cover 5,000 households and their members (aged 15 and over) in the first wave (1998). I use the fourth wave of data (2001), where mother’s education was covered for the first time, through to the ninth wave (2006). Table 1 shows educational
( )
6
x n x n
x n x
n n a m
m n q
⋅ − +
⋅ =
1 where nqx is the probability of dying between age x and x+n, nmx is the mortality rate between age x and x+n, and nax is the person-year lived by the deceased between age x and x+n. The nqx is given by life tables and nax is assumed n/2. The nmx is multiplied by mortality ratios of each education group to the overall population as presented by Kim (2002) to compute education-age-specific mortality rates, which are converted to survival probabilities.
7 Because the mortality ratios by education are available only for women aged 25 and older, no mortality
mobility rates for different birth cohorts. We can observe that upward mobility becomes increasingly prevalent over time.
Table 1: Trends in educational mobility (percent)
Daughter’s education
Mother’s education Primary Secondary Tertiary Total (N)
Primary
Cohort, 1950s 20.8 70.7 8.5 100.0 (993)
Cohort, 1960s 4.3 75.0 20.7 100.0 (957)
Cohort, 1970s 1.1 54.4 44.5 100.0 (659)
Secondary
Cohort, 1950s 3.2 57.5 39.3 100.0 (65)
Cohort, 1960s 0.0 45.5 54.5 100.0 (205)
Cohort, 1970s 0.3 28.2 71.5 100.0 (760)
Tertiary
Cohort, 1950s [0.0] [14.8] [85.2] [100.0] (10)
Cohort, 1960s 0.0 23.9 76.1 100.0 (21)
Cohort, 1970s 0.0 4.0 96.0 100.0 (77)
Sources: The Korean Labor and Income Panel Study (KLIPS), 2001–2006. Notes: [ ]: based on less than 20 cases. Cohort refers to daughter’s birth cohort.
Differential demographic rates are available for cohorts born between 1980 and 2005, as shown in Table A-1. However, educational mobility rates are not available for these years because most cohorts born during this period have not yet completed their schooling. To address these data limitations, I utilize the fact that we can reconstruct contingency tables uniquely when we know the marginal distributions and the odds ratios between origin and destination (Agresti 2002: 345–346).8 Mother’s educational distribution (origin) is available from the census data between 1980 and 2005, but daughter’s educational distribution (destination) and intergenerational association are not directly available for this period. Here I make several assumptions to construct an
8 This technique is called raking the table, or table standardization. First, I input the entries that satisfy the
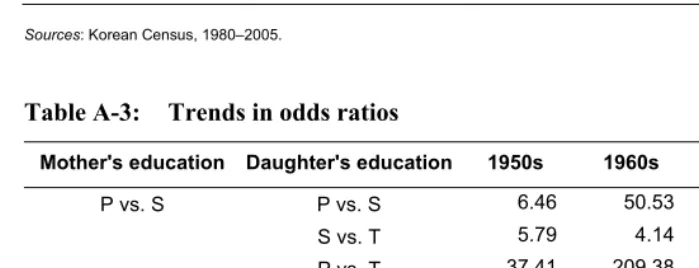
educational mobility table. First, the educational distribution of women aged 20–24 in 2005, available from census data, is assumed to be equal to daughter’s educational distribution for all years (1980–2005). This is a good approximation of educational distribution of daughters born between 1981 and 1985. Using this as daughter’s educational distribution for 1980 and 1985 does not seem problematic, but it is probably inaccurate for later years. However, this assumption does not introduce a serious bias given the fairly high level of educational attainment for women born between 1980 and 1984.9 Table A-2 shows the marginal distributions used in the analysis. Second, I substitute the intergenerational association of those born in the 1970s for those born between 1980 and 2005 in the projection models. This is equivalent to assuming that the intergenerational association for women born between 1980 and 2005 is the same as that for women born in the 1970s. Table A-3 shows the odds ratios between mother’s and daughter’s education for three birth cohorts. Consistent with previous studies (Park 2003, 2007), the intergenerational association did not change dramatically over cohorts; rather it fluctuated. This fluctuating pattern suggests that using the odds ratios observed for women born in the 1970s for later birth cohorts would not be overly problematic given the lack of any other reliable information. In summary, I create an educational mobility table based on (1) the intergenerational association observed for women born in the 1970s, (2) observed reproductive women’s educational distribution of every five years (1980–2005) as mother’s educational distribution, and (3) educational distribution of women aged 20– 24 in 2005 as daughter’s educational distribution.
6. Results
The analyses using the observed transitory mobility and differential demographic rates (not presented here but available upon request) show the following. First, projections using no differential demographic rates yield identical results with those using observed differential demographic rates, suggesting that differential demographic behaviors do not affect educational distribution during this period. This may be because the time span
9 I considered imputing the missing information by extrapolation. However, about 75 percent of women aged
is too short for differential demographic behaviors to be influential or because differential demographic behaviors are not large enough to make a difference. The analyses that project equilibrium distribution show that the latter is the case. I will discuss this in more detail in the next section. Second, without change in marginal distribution across generations the level of education would be much lower, which is hardly surprising. Third, without intergenerational association the level of education would be much lower. This suggests that intergenerational association in education also contributes to educational expansion: strong association yields a higher level of education in the next generation. However, the short time span that the projections rely on makes it difficult to draw a firm conclusion about this. The analyses that project equilibrium distribution are more suitable to examine this issue.
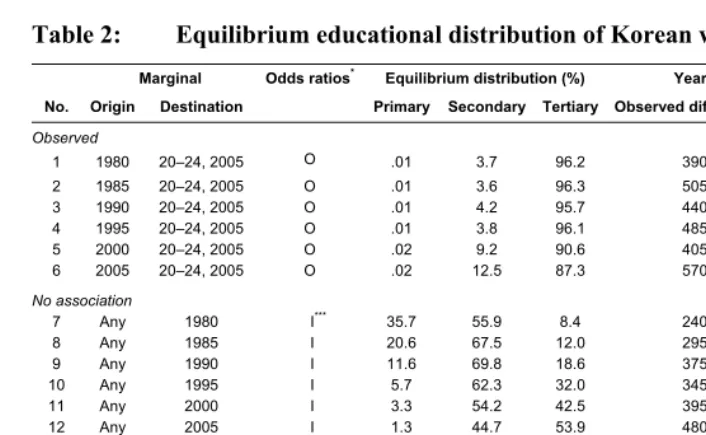
6.1 Equilibrium distribution under observed mobility and differential demographic rates
Table 2: Equilibrium educational distribution of Korean women aged 15–44
Marginal Odds ratios* Equilibrium distribution (%) Years to reach equilibrium
No. Origin Destination Primary Secondary Tertiary Observed differentials No differentials**
Observed
1 1980 20–24, 2005 O .01 3.7 96.2 390 300
2 1985 20–24, 2005 O .01 3.6 96.3 505 370
3 1990 20–24, 2005 O .01 4.2 95.7 440 395
4 1995 20–24, 2005 O .01 3.8 96.1 485 415
5 2000 20–24, 2005 O .02 9.2 90.6 405 360
6 2005 20–24, 2005 O .02 12.5 87.3 570 530
No association
7 Any 1980 I*** 35.7 55.9 8.4 240 300
8 Any 1985 I 20.6 67.5 12.0 295 370
9 Any 1990 I 11.6 69.8 18.6 375 395
10 Any 1995 I 5.7 62.3 32.0 345 415
11 Any 2000 I 3.3 54.2 42.5 395 345
12 Any 2005 I 1.3 44.7 53.9 480 530
No structural change
13 1980 1980 O 37.1 55.8 7.2 230 300
14 1985 1985 O 20.8 68.7 10.6 275 370
15 1990 1990 O 11.9 67.2 20.9 380 395
16 1995 1995 O 5.4 65.9 28.7 385 415
17 2000 2000 O 3.2 59.0 37.9 395 375
18 2005 2005 O 1.3 47.5 51.2 455 530
Notes: * O: observed odds ratios; I: Independence of mother’s and daughter’s education, or no association.
** Equilibrium distribution implied by observed fertility differentials and no fertility differentials are similar to each other. The differences lie only in how long it takes to reach equilibrium distribution.
*** If no intergenerational association exists, marginal distribution in origin does not influence the projection. Marginal distribution in destination matters only because this completely determines the outflow rates regardless of marginal in origin.
implied by the later period is a bit lower than the earlier periods imply. This may seem counterintuitive, given the educational expansion observed between 1980 and 2005. However, this is the case because origin distributions in the later periods are imposed to be more similar to the destination distribution than those in the earlier periods. While only 8.2 percent of reproductive women in 1980 had tertiary education, more than half of reproductive women in 2005 did so (see Table A-2). Obviously, the latter is closer to the assumed destination distribution (educational attainment of women aged 20–24 in 2005). Because the destination distribution may not be equal to educational attainments of daughters at each time point,10 the comparison between projections would not reveal the trend in differential population replacement. Instead, this tells us about the implications of structural change for the equilibrium distribution. Because the impact of differential demographic rates is minimal and I use the same odds ratios for all these projections, the differences in marginal distribution of mother’s education are largely responsible for the differences among the equilibrium distribution of each projection. The higher level of educational attainments obtained from the projections with earlier distribution implies that greater structural change increases educational attainment. However, the magnitude is not large. There is only a 10 percent difference in tertiary education levels between the projection with marginal distributions in 1980 and the marginals in 2005. Given the fairly large difference in the marginal distribution of origin, this difference seems modest at best. This implies that the change in marginal distribution experienced between 1980 and 2005 does not have substantial implications for the differential population replacement process in South Korea.
The second and third panels in Table 2 display equilibrium distributions under independence and with no structural change. Under independence (Nos. 7–12), marginal distribution in origin does not make any difference in outflow mobility rates. The marginal distribution in the destination solely determines the mobility rates, because daughter’s educational attainment is not at all dependent on the level of mother’s education and is only constrained by the initial destination distribution of each projection. Interestingly, the equilibrium distribution is almost identical to the initial destination distribution. This implies that educational expansion would stop when it reaches the initial marginal distribution of destination. Without intergenerational association, the initial destination distribution determines the equilibrium distribution. When I use the educational distribution of women aged 20–24 in 2005 as the initial destination distribution and assume independence, about 75 percent have tertiary education at the equilibrium (not reported in Table 2), which is much lower than those reported in the first panel in Table 2. This means that the lack of intergenerational
10 It is likely to underestimate the level of daughter’s education because it assumes that the level does not
association would lower the level of educational attainment at equilibrium, holding other things constant. This finding leads us beyond the narrow interpretation of intergenerational association in previous research: intergenerational association is not only a measure of social inequality but also contributes to educational expansion.
The equilibrium distributions under assumptions of no structural change (Nos. 13– 18) are very similar to the marginal distributions of destination (i.e. the same as origin) used in the mobility matrix. Strength of intergenerational association does not matter at all for the educational distribution in the future, simply because the educational distribution does not change over time.11 Therefore equilibrium is identical to the initial destination distribution in the mobility matrix unless differential demographic patterns are excessively influential.12 From these projections we can conclude that (1) structural change does not matter for differential population replacement under independence and (2) intergenerational association has no implication for differential population replacement under no structural change. In other words, some structural change is necessary for the intergenerational association to affect the differential population replacement, and vice versa.
6.2 Equilibrium distribution under hypothetical educational mobility and differential fertility conditions
In the multi-group population projections discussed above, observed differential fertility does not have a big impact on equilibrium distributions. Differential fertility influences only the time to convergence. I also found that intergenerational association contributes to educational expansion by comparing the equilibrium distributions implied by two mobility matrices: observed and independence. In this section, I extend the analyses by using hypothetical mobility and differential fertility conditions. First, I compare the equilibrium distributions implied by hypothetical differential fertility conditions under the observed mobility conditions. This analysis will allow for examining how strong differential fertility must be to influence the equilibrium distribution. Second, I compare the equilibrium distributions implied by different mobility conditions under the observed differential fertility. By manipulating the odds ratios and the percentage of immobility in the mobility matrix, I examine the implications of net association and inheritance for equilibrium distribution. Third, I examine how the impact of intergenerational association is dependent on differential fertility: that is, would the
11 Prais (1955) proved this property mathematically without considering differential demographic processes. 12 This is why the equilibrium distributions under independence and no structural change are similar to each
intergenerational association be more influential on the equilibrium distributions if differential fertility were weaker?
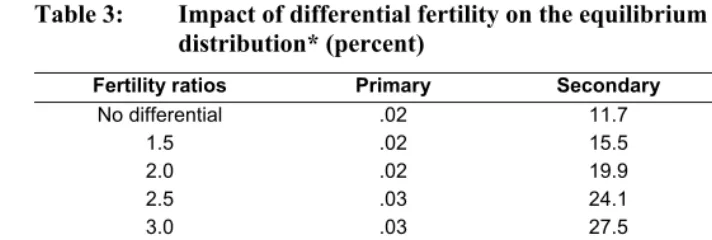
6.2.1 Impact of differential fertility on equilibrium distribution
Following Preston and Campbell (1993), I impose hypothetical differential fertility patterns on the population projection and compare the equilibrium distributions implied by each projection. The results are shown in Table 3. The first column shows the hypothetical fertility ratios between the adjacent education groups used in the projections. For example, a fertility ratio of 1.5 means that the age-specific fertility ratio of primary education to secondary or secondary to tertiary is equal to 1.5. I further assume that age-specific fertility rates for women with secondary education are the same as average age-specific fertility rates in 2005.13 I use the educational distribution of reproductive women in 2005 as the origin distribution, with women aged 20–24 in 2005 as the destination distribution, and observed odds ratios of women born in the 1970s as the intergenerational association. The equilibrium distribution implied by each projection shows the negative relationship between differential fertility and the educational attainment at the equilibrium: whereas 88 percent of women will attain a college education under no differential fertility, only 65 percent will do so if the fertility ratio between adjacent groups is 5.0. This difference is substantial in the equilibrium distribution, but fertility differentials should be much smaller than this in most societies. In Table 3 we can see that a fertility ratio of 1.5 does not have a substantial impact on equilibrium distribution. However, even this level of fertility differential is unrealistically large; it is much greater than observed differentials in South Korea (see Table A-1). This explains why differential fertility does not influence the equilibrium distribution under the observed educational mobility in South Korea. In a situation where upward educational mobility is dominant, differential fertility must be unrealistically strong to be influential. This confirms the dominance of educational mobility in differential population replacement in South Korea.
13 The choice of reference fertility rate does not affect the equilibrium distribution, so this choice does not
Table 3: Impact of differential fertility on the equilibrium educational distribution* (percent)
Fertility ratios Primary Secondary Tertiary
No differential .02 11.7 88.0
1.5 .02 15.5 84.3
2.0 .02 19.9 79.9
2.5 .03 24.1 75.7
3.0 .03 27.5 72.3
3.5 .03 30.1 69.6
4.0 .03 32.2 67.5
4.5 .03 33.8 65.9
5.0 .03 35.1 64.6
Notes: * Odds ratios: observed for women born in 1970s. Origin: women 15–44 in 2005. Destination: women 20–24 in 2005. Reference fertility rates: 2005.
6.2.2 Impact of intergenerational association on equilibrium distribution
UA
uniform association model.14 The uniform association model fits the data best, so I use the parameter estimates from this model for the following simulations. Parameter estimates and the Bayesian Information Criterion (BIC) for model comparison are given in the Appendix (see Table A-4). The uniform association model assumes that the differences between adjacent categories are equal, and the log of odds ratios involving any two pairs (row i and i’, and column j and j’) are equal to β (i – i’)(j – j’) (Power and Xie 2000). The anti-log of estimated uniform association parameter ( ) is 3.287, which means that daughters of women with tertiary education (or secondary education) have 229 percent higher odds of having one category higher education (secondary vs. primary or tertiary vs. secondary) than daughters of women with secondary education (or primary education). In simulations, I multiply
e
by scaling factors that vary from 1/3.287 (independence) to 3.287 (extremely strong association) and standardize the marginal distribution using mother’s and daughter’s educational distribution in 1980. I then compare the equilibrium distributions implied by (hypothetical) scaled mobility matrices.UA
e
βUA
β
I also examine the impact of immobility or inheritance on the population replacement. Immobility or inheritance is closely related to net association, but high immobility does not necessarily imply strong association, or vice versa.15 For example, consider the educational mobility table used in this study (3×3 mobility table). Let us denote fij as the number of daughters whose mothers’ education is i and whose own
education is j (i=1, 2, 3 and j=1, 2, 3). Then suppose that most daughters have the same level of educational attainment as their mothers (i.e., f11, f22, and f33 are large). This
implies strong inheritance. However, this does not necessarily mean that all odds ratios in this mobility table are high. For example, (f12f23)/(f13f22) could be close to 1 or even
smaller than 1, meaning that daughters of women with secondary education would not be more likely to enter college than daughters of women with primary education. Therefore net association (measured by odds ratios) and immobility are analytically
i C i R i ij j
F =μ+μ +μ + φ
log i j
C i R i
ij xy
F =μ+μ +μ +β
log
R i
μ C
i
μ φi
i x yj
14 The row effect model and uniform association model can be written as follows. Row effect model:
; uniform association model: where i=1,2,3 and
j=1,2,3, and represent row marginal and column marginal parameters respectively, is scaled scores for origin - here dummy-coded - and and are integers that represent the order of origin and destination. The uniform association model assumes the linear effect of mother’s education on a log of odds of attaining higher level education, but the row effect model does not impose this assumption.
15 This is the case except for 2×2 mobility tables. In 2×2 mobility tables, strong association necessarily
distinguishable concepts,16 so the implications of immobility would be different from net association. I manipulate percentage of immobility, using the assumed marginal distribution in 1980. A set of hypothetical mobility matrices is created as follows. First, I assume uniform distributions of origin and destination. Second, I change percentage of immobility from 33 percent (which represents independence) to 90 percent (which represents extremely high immobility), assuming symmetry.17 Third, I compute the sets of odds ratios for each hypothetical mobility matrix. Then I substitute the assumed marginal distributions of 1980 for the uniform distribution. This substitution is necessary, because the uniform distributions of both origin and destination imply no structural change where we cannot evaluate the implication of intergenerational association.18 Finally, I compute the outflow educational mobility rates from each matrix and apply these to the projection. I use differential demographic rates in 1980.
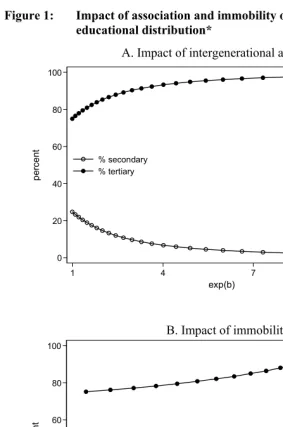
Figure 1 shows how educational distribution at equilibrium is related to levels of association (Panel A) and immobility (Panel B). From the two graphs, we can see that stronger association and higher immobility lead to higher educational attainment at equilibrium given the observed differential demographic rate in 1980. Therefore stronger intergenerational association and inheritance not only represent greater educational inequality but also promote educational expansion. This is because the stronger association and inheritance imply more upward mobility when structural change exists. The policy implications of this result are somewhat problematic: educational equality may exert negative influence on the level of educational attainment in the future. This suggests the difficulty of pursuing socioeconomic development while minimizing socioeconomic inequality. Of course, the causal order is not straightforward. Alternatively, educational expansion leads to stronger intergenerational association, resulting in the positive relationship between them. However, the previous studies suggest that educational expansion weakens intergenerational association when a certain level of education is saturated by the upper class (Hout, Raftery, and Bell 1993; Raftery and Hout 1993). This evidence suggests that the positive association is unlikely to be driven by the reverse causation. I will discuss this issue in more detail in the conclusion.
16 Occupational mobility studies account for the impact of immobility or inheritance by developing kinds of
“diagonal-blocked” models (Erikson and Goldthorpe 1992; Hout 1984, 1988; Sobel, Hout, and Duncan 1985). The aim of this approach is to estimate the net association, controlling for inheritance, or vice versa.
17 Although symmetry is an unrealistic assumption given the secular trend of educational expansion over time,
I impose it because of the ease of fixing the marginal distribution under this assumption. Given the interest in evaluating the implications of immobility on differential population replacement, this assumption is inconsequential to the results.
Figure 1: Impact of association and immobility on the equilibrium educational distribution*
A. Impact of intergenerational association
0 20 40 60 80 100
pe
rc
e
nt
1 4 7 10
exp(b) % secondary
% tertiary
B. Impact of immobility
0 20 40 60 80 100
Pe
rc
en
t
50 60 70 80
Percent Immobile % secondary
% tertiary
6.2.3 Joint impact of mobility and differential fertility
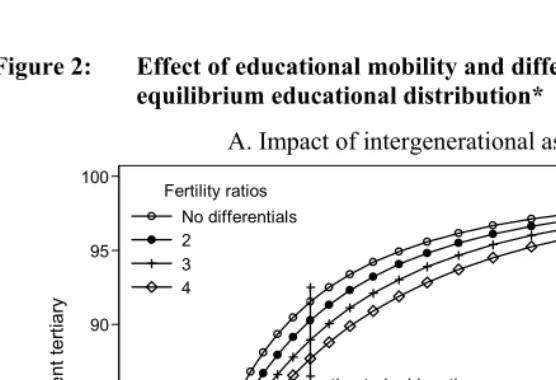
Table 4 shows the impact of differential fertility on differential population replacement and Figure 1 shows the positive impact of net association and inheritance on the level of educational attainment at equilibrium. In this section, I examine the extent to which the impact of net association and inheritance depends on differential fertility. Whereas Panel A in Figure 2 shows how the impact of association is dependent on the level of fertility differentials, Panel B shows how the relationship between inheritance and the level of educational attainment at equilibrium depends on the differential fertility.19
Figure 2: Effect of educational mobility and differential fertility on the equilibrium educational distribution*
A. Impact of intergenerational association
estimated odds ratios
75 80 85 90 95 100
P
e
rce
n
t t
e
rt
ia
ry
0 5 10
exp(b) No differentials
2 3 4 Fertility ratios
19 The impact of net association, inheritance, and differential fertility is examined in the same way as in
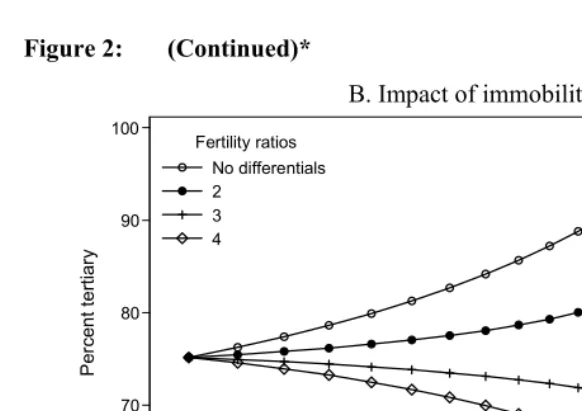
Figure 2: (Continued)*
B. Impact of immobility
60 70 80 90 100
P
erc
en
t t
e
rt
ia
ry
50 60 70 80
Percent Immobile No differentials
2 3 4 Fertility ratios
Notes: * Origin: 1980, destination: 20–24 in 2005, reference fertility rates in 1980.
We can see that a stronger intergenerational association leads to more educational upgrading, although the existence of strong differential fertility pulls down the level of educational attainment at equilibrium to some extent (see Panel A). Actually, the impact of differential fertility on the relationship between net association and the percentage of tertiary education is the strongest at the observed level of net association, and negligible when there is no association or an extremely strong association. However, the patterns are the same and the impact of differential fertility is not substantial.
By contrast, we can see that the impact of inheritance on differential population replacement is dependent on the level of fertility differentials (Panel B). Stronger immobility implies more educational expansion if fertility ratios between adjacent education groups are smaller than 2.0. If fertility ratios are greater than 3.0, more inheritance yields lower educational attainment. This means that the higher reproduction rates of the less educated women would push the educational attainment down when educational immobility is prevalent. This is a concern raised in Bell Curve
data, which shows that Herrnstein and Murray’s claim does not have support from demographic analysis.
The analysis above shows an interesting contrast between the impact of net association on equilibrium distribution and that of inheritance when differential fertility is extremely high (e.g., fertility ratio higher than 3.0). Whereas stronger association still leads to a higher level of educational attainment at the end, higher inheritance exerts downward pressure on the equilibrium distribution. This illustrates a subtle distinction between inheritance and net association. Strong inheritance lowers the level of educational attainment at equilibrium when fertility differential is high, because a huge inflow of the offspring of the less educated offsets the trend of upward educational mobility. Why, then, does strong association have the opposite implication under a high fertility differential? This is because strong association yields high enough upward mobility rates to cancel out the downward pressure of high differential fertility. Therefore concerns like “population dysgenesis” are even more groundless when we think of intergenerational transmission in terms of association instead of inheritance. Stronger association yields a higher level of educational attainment even with the extremely higher reproduction rate of less educated women compared to that of the better educated.
7. Conclusion
women with tertiary education at equilibrium (see Table 2). Finally, I found that intergenerational association and inheritance had a significant impact on differential population replacement: stronger association and inheritance imply more educational expansion. This result leads us beyond a narrow interpretation of intergenerational association, which in most studies is interpreted as an indicator of social inequality. For example, stability of intergenerational association in educational attainment has been used as evidence for “persistent inequality” (Shavit and Blossfeld 1993). However, the current study shows that strong intergenerational association and inheritance also promote educational expansion unless fertility differentials are extremely high.
Among these findings, the positive relationship between intergenerational association and educational expansion is worthy of further discussion. On the one hand, the positive association between them provides evidence that societal development does not necessarily reduce social inequality. Instead, this finding suggests that greater inequality would promote socioeconomic development under certain circumstances: specifically, modest differences in reproduction rates by socioeconomic groups and stable intergenerational mobility regimes. This suggests an intrinsic trade-off between socioeconomic development and reduction of social inequality.
8. Acknowledgments
References
Agresti, A. (2002). Categorical Data Analysis. New York: Wiley.
doi:10.1002/0471249688.
Blau, P.M. and Duncan, O.D. (1967). The American Occupational Structure. New York: Wiley.
Chang, K. (2010). South Korea under Compressed Modernity: Familial Political Economy in Transition. New York: Routledge.
Choi, K.H. and Mare, R.D. (2009). International Migration of Mexicans and the Reproduction of Education from One Generation to the Next. Paper presented at the Population Association America 2009 Annual Meeting at Detroit, MI. Duncan, O.D. (1966). Methodological Issues in the Study of Social Mobility. In: Lipset,
S.M. and Smelser, N.J. (eds.). Social Structure and Mobility in Economic Development. Aldine, Chicago: 51-97.
Erikson, R. and Goldthorpe, J.H. (1992). The Constant Flux: A Study of Class Mobility in Industrial Societies. Oxford: Clarendon Press.
Featherman, D.L., Jones, F.L., and Hauser, R.M. (1975). Assumptions of Social Mobility Research in the US: The Case of Occupational Status. Social Science Research 4(4): 329-360. doi:10.1016/0049-089X(75)90002-2.
Fisher, C.S., Hout, M., Jankowski, M.S., Lucas, S.R., Swindler, A., and Voss, K. (1996). Inequality by Design: Cracking the Bell Curve Myth. Princeton: Princeton University Press.
Guo, G. and VanWey, L.K. (1999). Sibship Size and Intellectual Development: Is the Relationship Causal? American Sociological Review 64(2): 169-187. doi:10.2307/2657524.
Hauser, R.M., Tsai, S., and Sewell, W.H. (1983). A Model of Stratification with Response Error in Social and Psychological Variables. Sociology of Education
56(1): 20-46. doi:10.2307/2112301.
Herrnstein, R.J. and Murray, C. (1994). Bell Curve: Intelligence and Class Structure in American Life. New York: Free Press.
Hout, M. (1988). More Universalism, Less Structural Mobility: American Occupational Structure in the 1980s. American Journal of Sociology 93(6): 1358-1400. doi:10.1086/228904.
Hout, M., Raftery, A.E., and Bell, E.O. (1993). Making the Grade: Educational Stratification in the United States, 1925 – 1989. In: Shavit, Y. and Blossfeld, H. (eds.). Persistent Inequality. Boulder: Westview Press: 25-50.
Keyfitz, N. and Caswell, H. (2005). Applied Mathematical Demography, 3rd edition. New York: Springer.
Kim, D.Y. (2001). What should be reformed in compulsory secondary education?
Welfare Trends March: 36-38 (in Korean).
Kim, T.H. (2002). Mortality. In: Kim, D., Park, S., and Eun, K. (eds.). Population in Korea. Korea National Statistical Office: 115-152 (in Korean).
Korea National Statistical Office (2008). Census Tabulation. [electronic resource] Seoul: http://www.kosis.kr.
Kye, B. and Mare, R.D. (2009). Intergenerational Effects of Shifts in Women’s Educational Distribution in South Korea: Transmission, Differential Fertility, and Assortative Mating. Los Angeles: California Center for Population Research (CCPR-023-09).
Livi-Bacci, M. (2006). A Concise History of World Population. 3rd edition. Oxford: Blackwell Publishers Ltd.
Lucas, S. (2001). Effectively Maintained Inequality: Educational Transitions, Track Mobility, and Social Background Effects. American Journal of Sociology
106(6): 1642-1690. doi:10.1086/321300.
Maralani, V. and Mare, R.D. (2008). Unobserved Heterogeneity, Demographic mechanisms, and the Intergenerational Effects of Increasing Women’s Schooling. Paper presented at the Population Association America 2008 Annual Meeting at New Orleans, LA.
Mare, R.D. (1981). Change and Stability in Educational Stratification. American Sociological Review 46(1): 72-87. doi:10.2307/2095027.
Mare, R.D. (1997). Differential Fertility, Intergenerational Educational Mobility, and
Racial Inequality. Social Science Research 26(3): 263-291.
doi:10.1006/ssre.1997.0598.
Mare, R.D. and Maralani, V. (2006). The Intergenerational Effects of Changes in Women's. Educational Attainments. American Sociological Review 71(4): 542-564. doi:10.1177/000312240607100402.
Matras, J. (1961). Differential Fertility, Intergenerational Occupational Mobility, and Change in the Occupational Distribution: Some Elementary Interrelationships.
Population Studies 15(2): 187-197. doi:10.2307/2173315.
Matras, J. (1967). Social Mobility and Social Structure: Some Insights from the Linear Model. American Sociological Review 32(4): 608-614. doi:10.2307/2091028. Matras, J. (1960). Comparison of Intergenerational Occupational Mobility Patterns: An
Application of the Formal Theory of Social Mobility. Population Studies 14(2): 163-169. doi:10.2307/2172012.
Musick, K. and Mare, R.D. (2004). Family Structure, Intergenerational Mobility, and the Reproduction of Poverty: Evidence for Increasing Polarization? Demography
41(4): 629-648. doi:10.1353/dem.2004.0034.
Park, H. (2003). Educational Expansion and Inequality in Korea. Research in Sociology of Education 14: 33-58. doi:10.1016/S1479-3539(03)14003-7.
Park, H. (2007). South Korea: Educational Expansion and Inequality of Opportunity for Higher Education. In: Shavit, Y., Adrum, R., and Gamoran, A. (eds.).
Stratification in Higher Education: A Comparative Study. Stanford: Stanford University Press: 87-112.
Phang, H., Ahn, J., Chang, J., Park, E., Ho, J., and Jung, H. (1999). Korean Households’ and Individuals’ Economic Activities: Data Analysis of the 1st wave of Korean Labor and Income Panel Study. Korean Labor Institute (in Korean).
Phang, H. and Kim, K. (2002). Opportunity and Inequality: Educational Stratification in Korea. Korean Journal of Sociology 36(4): 193-222 (in Korean).
Power, D. and Xie, Y. (2000). Statistical Methods for Categorical Data Analysis. San Diego: Academic Press.
Preston, S.H. and Campbell, C. (1993). Differential fertility and the distribution of traits: The case of IQ. American Journal of Sociology 98(5): 997-1019. doi:10.1086/230135.
Preston, S.H., Heuveline, P., and Guillot, M. (2001). Demography: Measuring and Modeling Population Processes. Oxford: Blackwell.
Raftery, A. and Hout, M. (1993). Maximally Maintained Inequality: Expansion, Reform, and Opportunity in Irish Education, 1921 – 75. Sociology of Education
66(1): 41-62. doi:10.2307/2112784.
Rogers, A. (1995). Multiregional Demography: Principles, Methods, and Extensions. New York: John Wiley and Sons.
Shavit, Y. and Blossfeld, H. (eds.). (1993). Persistent Inequality. Boulder: Westview Press.
Simkus, A. (1984). Structural Transformation and Social Mobility: Hungary 1938-1973. American Sociological Review 49(3): 291-307. doi:10.2307/2095275. Sobel, M., Hout, M., and Duncan, O.D. (1985). Exchange, Structure, and Symmetry in
Appendices
Table A-1: Age-specific fertility rates and survival probability, 1980–2005* Births per 1,000 women 5-year survival probability** Year Age
Primary Secondary Tertiary Primary Secondary Tertiary
1980 15–19 75.5 8.3 0.3 0.992 0.992 0.992
20–24 214.7 116.4 75.7 0.991 0.991 0.991
25–29 243.8 237.5 240.4 0.978 0.995 0.996
30–34 115.4 113.8 117.2 0.966 0.994 0.995
35–39 44.0 39.0 31.5 0.976 0.991 0.994
40–44 16.8 13.2 9.6 0.961 0.988 0.992
TFR 3551 2641 2373.5
1985 15–19 112.3 8.9 0.6 0.995 0.995 0.995
20–24 188.4 132.6 32.0 0.994 0.994 0.994
25–29 113.5 160.9 177.0 0.981 0.996 0.997
30–34 27.6 40.5 64.0 0.972 0.995 0.996
35–39 8.0 8.7 10.3 0.976 0.992 0.994
40–44 2.2 2.3 1.9 0.964 0.988 0.992
TFR 2260 1769.5 1429
1990 15–19 66.2 6.2 0.1 0.996 0.996 0.996
20–24 124.9 85.2 57.7 0.996 0.996 0.996
25–29 78.2 161.2 194.1 0.982 0.996 0.998
30–34 20.3 46.5 93.3 0.973 0.995 0.997
35–39 4.9 9.4 17.4 0.981 0.993 0.996
40–44 1.1 1.7 2.0 0.966 0.989 0.993
TFR 1478 1551 1823
1995 15–19 41.1 8.9 0.1 0.997 0.997 0.997
20–24 114.2 99.0 18.3 0.997 0.997 0.997
25–29 122.2 199.5 167.7 0.975 0.996 0.998
30–34 42.3 64.7 97.3 0.966 0.995 0.997
35–39 9.9 14.3 21.5 0.981 0.994 0.997
40–44 1.6 2.3 3.1 0.972 0.991 0.995
TFR 1656.5 1943.5 1540
2000 15–19 42.4 9.8 0.1 0.998 0.998 0.998
20–24 70.9 85.3 14.3 0.998 0.998 0.998
25–29 90.1 182.7 137.3 0.970 0.997 0.998
30–34 46.4 80.3 111.3 0.960 0.995 0.998
35–39 11.8 16.0 24.4 0.981 0.994 0.997
40–44 1.7 2.5 3.9 0.972 0.992 0.996
TFR 1316.5 1883 1456.5
2005 15–19 32.0 5.3 0.1 0.998 0.998 0.998
20–24 61.8 50.9 7.5 0.998 0.998 0.998
25–29 50.2 118.0 85.7 0.970 0.997 0.998
30–34 39.7 71.8 103.1 0.963 0.996 0.998
35–39 13.2 16.8 25.0 0.984 0.995 0.998
40–44 2.1 2.3 3.3 0.977 0.993 0.997
TFR 995 1325.5 1123.5
Notes: * Sources: Korean Census (1980–2005), Vital Statistics (1980–2005), Kim (2002).
Table A-2: Educational distribution of Korean women aged 15–44 (1980–2005) (percent)
Year Primary Secondary Tertiary
1980 36.5 55.3 8.2
1985 21.1 67.1 11.8
1990 11.9 69.6 18.5
1995 5.9 62.3 31.8
2000 3.5 54.2 42.3
2005 1.4 44.8 53.8
aged 20–24 in 2005 0.3 24.6 75.1
Sources: Korean Census, 1980–2005.
Table A-3: Trends in odds ratios
Mother's education Daughter's education 1950s 1960s 1970s Overall
P vs. S P vs. S 6.46 50.53 2.21 11.83
S vs. T 5.79 4.14 3.01 5.75
P vs. T 37.41 209.38 6.66 68.08
S vs. T P vs. S 0.75 0.06 0.22 0.33
S vs. T 10.27 2.74 9.97 5.74
P vs. T 7.71 0.16 2.17 1.87
P vs. T P vs. S 4.85 3.00 0.48 3.85
S vs. T 59.50 11.37 30.06 33.01
P vs. T 288.62 34.14 14.46 127.03
Table A-4: Parameter estimates of uniform association model and model comparison (BIC), N=1,489
Parameter estimates (Uniform association model)
Variable Coefficients (b) s.e. z exp(b)
Mother’s education
primary (reference)
Secondary –2.762 1.037 –2.66 0.063
Tertiary –8.347 2.233 –3.74 0.000
Daughter's education primary (reference)
Secondary 2.537 1.344 1.89 12.640
Tertiary 1.166 1.638 0.71 3.210
Uniform association 1.190 0.394 3.02 3.287
Intercept –1.859 1.302 –1.43 0.156
Model comparison (BIC)
Saturated 0
Uniform association –13.397
Row effects –9.141