of peer-reviewed research and commentary in the population sciences published by the Max Planck Institute for Demographic Research Konrad-Zuse Str. 1, D-18057 Rostock · GERMANY www.demographic-research.org
DEMOGRAPHIC RESEARCH
VOLUME 10, ARTICLE 6, PAGES 143-170
PUBLISHED 07 MAY 2004
www.demographic-research.org/Volumes/Vol10/6/
DOI: 10.4054/DemRes.2004.10.6
Research Article
Fertility and Public Policies - Evidence
from Norway and Finland
Marit Rønsen
1 Introduction 144
2 A brief history of fertility and public policies in
Finland and Norway
145
2.1 Fertility trends 145
2.2 Public policy expansion 146
3 Theory and methods 148
3.1 Conceptual framework 148
3.2 Empirical specification 150
4 Data and variables 150
4.1 Sample 150
4.2 Covariates 151
5 Results 155
5.1 Background characteristics and preference
indicators
155
5.2 Demographic variables 156
5.3 Human capital variables 157
5.4 Fertility price indicators 158
6 Conclusions 159
7 Acknowledgements 160
Notes 161
References 162
Research Article
Fertility and Public Policies - Evidence from Norway and Finland
Marit Rønsen 1
Abstract
The relatively high and rising fertility rates of Nordic countries in the late 1980s and early 1990s sparked a renewed research interest in the possible pronatalistic effects of generous family policy programs. Several studies have addressed this issue, but few have tried to model policy effects explicitly. The existing evidence so far is mainly from Sweden, where policy indicators have been incorporated in economic fertility models that also control for female wages. This paper complements previous Swedish analyses with evidence from Norway and Finland. The results corroborate earlier findings of a negative effect of female wages. There are also indications of a positive policy impact, as maternity leave extensions are estimated to raise birth rates, although mainly higher parity births and mainly in Finland.
1
Division for Social and Demographic Research, Statistics Norway, P.O.Box 8131 Dep, N-0033
1. Introduction
Since the 1980s fertility has fallen to unprecedentedly low levels in many western industrialized countries. The Nordic countries, however, experienced a rise in fertility from the early 1980s, which at the beginning of the 1990s stabilized not far below replacement level (Note 1). This lead to a renewed research interest in the possible pronatalistic effect of generous family policy programs such as those in the Nordic countries, including extensive parental leave, subsidised child-care and other economic support to families. Walker (1995), for example, investigated the case of Sweden, comparing the period fertility rate during 1955-1990 to a constructed macro time series of the shadow price of fertility that also included program benefit components. The estimated price series exhibited a negative relationship with period fertility rates, and the findings further suggested that changes in the relative prices of fertility over the life cycle may have been an incentive to postpone childbearing to higher ages.
So far there are few studies of policy effects based on individual data, mainly because of a lack of appropriate information on life-cycle wages and benefits. Some attempts have been made to estimate price effects for Sweden, using individual fertility and employment histories, but imputing wages from a limited time series of macro data (Heckman and Walker 1990) or estimating wage profiles based on information from a small part of the labour market (shop assistants in wholesale and retail trade: Tasiran 1994; Klevmarken and Tasiran 1996). In all studies the woman’s wage is found to have a negative effect on the timing of birth, but the results differ considerably in magnitude and significance (Note 2). None of the Swedish studies render much support for the notion that family policies have stimulated fertility, however.
2. A brief history of fertility and public policies in Finland and
Norway
2.1 Fertility trends
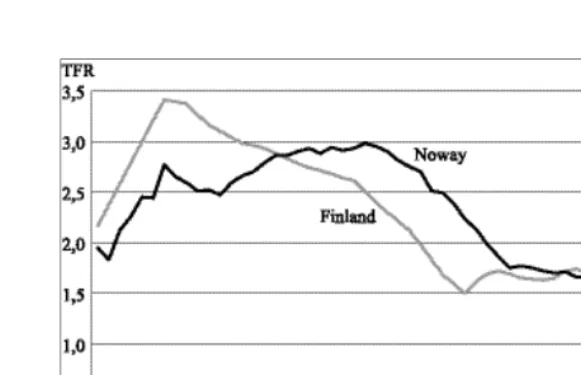
Like many other countries, Finland and Norway experienced a «baby boom» just after the second world war. The «boom» was, however, more short-lived in Finland than in Norway, and there are also other dissimilarities in the time trends (Figure 1). Finland had the highest post-war fertility level with 3.41 children per women in 1946 against 2.74 in Norway. Over the next decades, the Finnish rate decreased continuously. By 1960 it had fallen below the Norwegian rate and reached a historically low peace-time level of 1.5 in 1973. The Norwegian fertility level also fell shortly after 1946, but at the beginning of the 1950s a long upward trend started, culminating with a total fertility rate of 2.98 in 1964. Thereafter there was a long period of declining fertility, levelling off around 1977 and reaching an absolute all time low of 1.66 in 1983-84. From the mid-1980s fertility rose again in Norway, peaking at 1.93 in 1990. Since then there has been a slight decrease to about 1.8 children per woman, which is still one of the highest period rates in Europe. The Finnish pattern since the early 1970s exhibit a pattern with more fluctuations: rising rates during the mid 1970s and in the early 1980s, and declines in the late 1970s and mid 1980s. In the late 1980s and early 1990s fertility was also rising in Finland, reaching a top rate of 1.85 in 1994, but has since then declined slightly and stabilized around 1.7 children per woman.
It is a well-known fact that period fertility fluctuates more than completed fertility (cohort fertility). Among the after-war generations, which will be analysed more closely in this paper, completed fertility has been higher in Norway than in Finland. The 1945 cohort has for example given birth to 2.45 children in Norway, while they have completed at 1.87 in Finland. Among successive Norwegian cohorts fertility has fallen gradually and is just above 2 children per women for cohorts born at the beginning of the 1960s. In Finland there has been a week increase in cohort fertility for women born after 1950, rising from 1.85 in the 1950 cohort to about 1.95 in the early 1960 cohorts.
2.2 Public policy expansion
The Nordic welfare states have a long tradition of extensive social policies directed at the family. These policies have not primarily been motivated by pro-natalistic concerns, but rather by gender equality ideologies and the general well-being of children and their families. The programs with greatest implications for the cost of a child are no doubt the statutory universal maternal and parental rights in connection with birth and the supply of subsidized childcare, which will be briefly reviewed in this section.
In Norway there have been fewer changes in the leave program. The first extension was in 1977, when the benefit period was prolonged to 18 weeks and fathers became entitled to share the leave, except for the first six weeks which were still reserved for the mother. In 1978 the benefits were raised substantially to cover 100 percent of former income for most working mothers and were made taxable and subject to pension payments. Then there were no further extensions until 1987 when the entitlement was prolonged to 20 weeks, and in 1988 two more weeks were added. Since 1993, maternity benefits are granted for a period of 42 weeks with full pay or 52 weeks with 80 per cent compensation. Unfortunately, it is not possible to study the effect of the rapid expansion between 1988 and 1993 in this study, as the available Norwegian data were collected just before that (1988).
Maternal or parental benefits are based on prior earnings in both countries. In Finland the benefits are calculated on the basis of the latest earnings record with the tax authorities, but if earnings immediately before birth are significantly higher (more than 20 per cent), the benefits may be calculated on the basis of the last six months. Mothers with no previous registered earnings receive a minimum flat rate payment, which in 1989 (the year of interview for Finland) amounted to FIM 52 per day (about FIM 13 700 for the whole period). The Norwegian leave program requires a certain amount of employment during pregnancy in order to acquire eligibility for benefits. Before 1977 the requirement was eight months employment during the last ten months prior to birth; later it was reduced to employment in six of the last ten months. Mothers who did not fulfil this criterion were granted a tax-free cash benefit at delivery, amounting to NOK 4 730 in 1988 (the year of interview for Norway).
After the expiry of the paid parental leave, parents of both countries are also entitled to a period of unpaid leave. In Norway a right to leave with job security until the child was one year old was enforced in 1977. Finnish parents did not get similar rights until the special home care allowance scheme was introduced in 1985. At the time this was a unique Finnish scheme (Note 3), which allowed parents to choose between a place in a public day-care institution or an extra income transfer to stay home and take care of the child on their own (Ilmakunnas 1997). Between 1985 and 1990 the system was gradually extended, and from 1990 all parents have been entitled to home-care allowance until the child is three years old. The parents have a statutory right to return to their employer when the home-care leave expires. The home-care allowance is taxable and consists of a basic payment, sibling supplement and an income tested additional payment. In 1989, the basic payment was FIM 1 210 per month and the maximum additional payment was FIM 968 per month. In addition, some municipalities grant an extra home-care allowance, which varies considerably from one municipality to another.
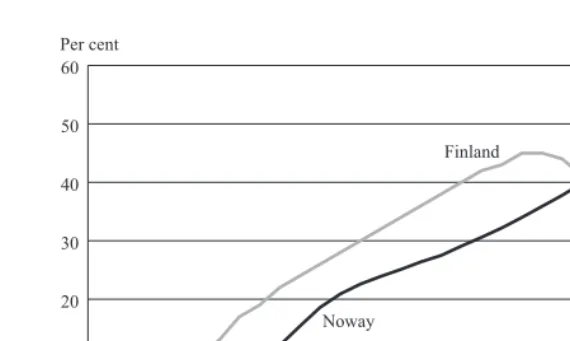
subsidized childcare. In 1973 about 5 percent of Norwegian pre-school children had a place in public day-care, while the Finnish coverage rates was twice as high. By 1980 enrolment included 21 percent of Norwegian and 28 percent of Finnish pre-schoolers, and ten years later the Finnish proportion had risen to 45 per cent while the corresponding Norwegian proportion was 36 per cent. After 1990 when the homecare allowance program was fully implemented, the Finnish coverage rate actually declined but later increased again to a level of about 50 per cent. In 1992 the Norwegian enrolment rate was on par with the Finnish (about 40 per cent), and has since mostly been in the lead with 54 per cent enrolled in 2001. Generally, enrolment rates are lower for children aged 0-2 years than for 3-6 year-olds (Nordic Social-Statistical Committee 2003).
Parents’ fees are largely subsidized, and vary considerably from one municipality to another. Generally, the fees increase with family income and decrease with the number of siblings in care. Norwegian parents pay relatively high fees, but may on the other hand deduct some of the cost from their taxable income, which Finnish parents cannot. Single parents pay a reduced rate. Not surprisingly, public day-care has generally been in short supply in both countries. The excess demand has been met by several forms of private child care, for example by relatives or «day-mummies», au pair girls or private day-care centres.
3. Theory and methods
3.1 Conceptual framework
Modelling the timing and spacing of births requires a dynamic framework. I shall employ a dynamic reduced form fertility model, which builds on the theory of dynamic structural models, but does not involve the estimation of structural parameters. The individual is assumed to maximize the expected, discounted value of utility over the life-cycle t=τ, ....,T:
max Eτ
å
=
T
t 1
λt
U(Nt, Ft, Ct, Lt, θ) (1)
fertility control and to be fully fecund. Maximization is subject to a sequence of budget constraints for each period t:
Yt + wt(H-Lt) = Ct + pt Ft, (2)
where Yt is current non-labour income (e.g. partner’s income), wt is the individual’s net after-tax market wage, H is the total time available for market- and household work (incl. leisure) and p is the unit cost of Ft (net of possible child subsidies and family allowances). H-Lt is thus the mother’s labour market hours. The full cost of fertility includes direct child expenses plus the opportunity cost of foregone earnings. If lost work experience reduces the woman’s earnings potential or at least prevents it from growing as fast as it would do otherwise, time taken off work may also reduce Yt in future periods. This element of the opportunity cost may depend on the initial endowment of human capital (education) and previous work experience (e.g. type of job, length of service or seniority). Decisions about the timing and spacing of births are thus likely to be influenced by the economic environment, including the tax-benefit system, as well as by personal characteristics, such as financial assets and human capital. The spacing may also be affected by considerations of possible economics of scale, i.e. it may be cheaper to raise (clothe, care for etc.) two children who are close in age than two who are several years apart.
The woman decides to give birth if the expected lifetime utility of having a(n) (extra) child exceeds the expected lifetime utility of not having a(nother) child given her budget constraint. The variable of interest is thus the likelihood of a conception. When the likelihood is regarded as continuously-varying, hazards-rate analysis is a useful tool. In this approach, women are assumed to be continuously subject to the risk of conception. The risk is given by the hazard rate, defined as the conditional probability of conception at time t, given that no conception has taken place before that time, or formally:
h(t) = lim [P(t ≤T< t + ∆t | T ≥ t)] / ∆t (3)
∆t→0+
conditional hazard. Let the potential durations be T1, ..., TC. If a woman becomes at risk for the jth birth at time τ(j-1), the conditional hazard at duration tj is defined to be
hj(t) ≡ hj[tj Z(τ(j-1)+tj)] (4)
where Z(τ) is the relevant conditioning set at time τ. This consists of variables that influence the woman’s transition to the next birth, including all relevant past information up to time τ (e.g. previous birth intervals, etc.), but also possible anticipations about the future formed at time τ. A necessary condition for including anticipatory variables is that their values are perfectly forecastable at time τ. For further discussion and details see Heckman and Walker (1990) or Arroyo and Zhang (1997).
3.2 Empirical specification
There are many possible parametric specifications for the hazards function in (4). The choice may be based on theoretical assumptions or on previous empirical evidence. There is little a priory guidance as to the functional form of the birth hazard. In previous empirical research of the fertility process in Sweden, Heckman and Walker (1990) chose for example a Weibul model, while Tasiran (1994) and Klevmarken and Tasiran (1996) used a quadratic hazards model. Another alternative is to use a more flexible semi-parametric model, which makes no assumptions about the functional form of the baseline hazard. I have chosen the latter procedure and specify a Cox proportional hazards model as follows:
hj(t) = h0j exp{Z[τ(j-1)+tj]βj}, (5)
where h0 is the baseline hazard and β is a vector of parameters in the transition to birth number j.
4. Data and variables
4.1 Sample
The analysis is based on data from similar Fertility and Family Surveys, the 1988 Norwegian Family and Occupation Survey and the 1989 Finnish Population Survey. The data contain complete retrospective life histories on childbearing, cohabitation and marriage, educational activities and employment from national representative samples of selected cohorts. The Norwegian survey has also been linked with register data on income from the Directorate for Taxation, migration histories derived from the Central Population Register and municipality time-series data on public day-care coverage from the Norwegian Social Science Data Services. Interviews were obtained from a total of 4019 Norwegian women born in 1945, 1950, 1955, 1960, 1965 and 1968, and 4155 Finnish women born each year 1938-67. To get a more similar cohort structure, I have excluded the youngest Norwegian cohort (1968) and the oldest Finnish cohorts (born before 1943), and grouped the remaining Finnish cohorts into 5-year intervals with mid-points equal to the Norwegian birth-years.
The start of the fertility process is set at age 15, which excludes two Norwegian women with earlier conceptions. The final analysis sample for first conception consists of 3639 Finnish and 3296 Norwegian women. In the analyses of transitions to higher parities, women with a multiple last birth have been excluded. The number of women who proceed to partiy one and the risk of a second conception is 2511 and 2355 for Finland and Norway, respectively. When estimating transitions to parity three, women who were single at second birth are also excluded, as they constitute a very small group (1-2 per cent) at this stage (Note 4). This leaves 1715 Finnish and 1630 Norwegian women under risk of third conception.
4.2 Covariates
Variables belonging to the first group are the woman’s social background and her number of siblings, as well as own religiosity and marital status. Social background is the socio-economic status of the main breadwinner of the parental household, usually the father. The influence of social background on own educational aspirations and future working career is well known. Daughters of manual workers are for example likely to finish school early and end up in lower educational groups themselves. They also tend to start family formation and enter motherhood at younger ages than women from higher social classes (see e.g. Kiernan 1995). The number of siblings a woman have may form preferences as to own family size. Coming from a large family may make it more attractive to have a large family oneself, although the opposite effect could be imagined if the size of the adolescent family involved economic hardship.
Fertility studies from several countries have found religiosity to be a good indicator of preference differences (see e.g. Kravdal 1996; Groot and Pott-Buter 1992), and it has therefore been included among the covariates. For Norway the indicator is
religious activity, where high is defined as attending church at least six times per year.
As the categories of religious activity are not quite the same in the Finnish survey, information on religious conviction, which is unique to the Finnish data, have been used in stead. Women who report that they are believers make up one group, while the other group consists of the remaining women (religiously inclined, religiously indifferent, sceptical or negative to religion).
Marital status may reflect differences in budget constraints, especially when
non-labour income is not controlled for, but it has also been shown to reveal variation in preferences. Lesthaege and Moors (1995) have e.g. established a clear negative association between cohabitation and traditional family values. In analyses of mothers’ employment following birth, woman who married directly without prior cohabitation are seen to be less likely to return to work, and especially to a full-time job (Rønsen and Sundström 1996 and 1997). The stronger family orientation in this marital group also suggest that they may be more likely to give birth. To capture the preference element, marital status is devided in four categories: directly married, married after cohabitation, cohabiting and single.
exogeneity of current status. Therefore, past marital status, measured at the time of last birth, has been used in the estimates.
The second group of covariates consists of the demographic variables, cohort, age at last birth and inter-birth interval. Cohort is the woman’s birth year, which for Finland has been grouped into five-year intervals (see section 4.1). To allow for a possible non-linear effect of age, age squared is also included. Age is measured at the time of last birth. Inter-birth interval refers to the time between first and second birth, and is measured in years. Since all women are assumed to start the fertility process at the same age (age 15), age at first birth is a measure of the length of the first conception interval. As discussed in Heckman and Walker (1990), lagged birth durations are frequently used as proxies for serially correlated unobservable heterogeneity, and if the unobservable is fecundability, women with low fecundability will have longer birth intervals. A long first spell should then be followed by long subsequent spells, and hence a negative coefficient of previous spells should be expected in the hazard model.
As pointed out by Walker (1995), the female wage rate is the single most important determinant of the full price of fertility. In his macro study of the components of the shadow price of fertility in Sweden, he found that the contribution to changes over time from female wages was about twice the magnitude of other changes considered, including changes in the tax and benefit system. So far only a few studies have tried to incorporate components of the shadow price of fertility in individual-level dynamic fertility models, mainly because of lack of appropriate price data. Some attempts have been made to estimate price effects for Sweden, using individual fertility and employment histories, but imputing wages from a limited time series of macro data (Heckman and Walker 1990), or estimating wage profiles based on information from a limited part of the labour market (shop assistants in wholesale and retail trade; Klevmarken and Tasiran 1996). In both studies the woman’s wage is found to have a negative effect on the timing of birth, but the effect is less pronounced and non-significant for the risk of first birth in the latter study.
Klevmarken and Tasiran also examine the effects of parental leave and the supply of public day-care, but find no significant effects of the extensions of the parental leave period. For public day-care the results were somewhat confusing: A positive, but non-significant, effect appeared for the risk of first birth, while the estimates for the second and third birth risks were negative and highly significant. The authors suggest that this must be because the variable captures something other than the intended supply differences. In an earlier Norwegian study, Kravdal (1996) also finds a negative, but non-significant effect of public day-care on first and second birth probabilities, while there is a weak positive, but insignificant, effect on the probability of a third birth. A closer examination shows that there may be a positive effect of public day-care on very low coverage levels (5-10 per cent).
For both countries I study the effects of parental leave and public day-care coverage. Two components of the parental leave scheme are important for the price of fertility: (i) the benefit level and (ii) the benefit period. Since the first component is almost proportional to the woman’s wage, the two variables are too highly correlated to be included in the same model. The duration of the benefit period thus serves as the indicator of the generosity of the parental leave program. For Finland, where the leave has been prolonged several times, this is a continuous variable, but for Norway where there were only a couple of extensions during the studied period, it is a categorical variable. The indicator of the supply of subsidized childcare is day-care coverage defined as the number of spaces per pre-school children. For Norway, this information is available at the municipality level and for a sub-group of children aged 0-3, which is the rate used in the analysis. For Finland, municipality level data is not available, and the national coverage rate for children aged 0-6 has been used instead. Finally, for Norway, I have also included a time-series of child benefits, which are income independent, non-taxable cash transfers, increasing with each child up to the fifth.
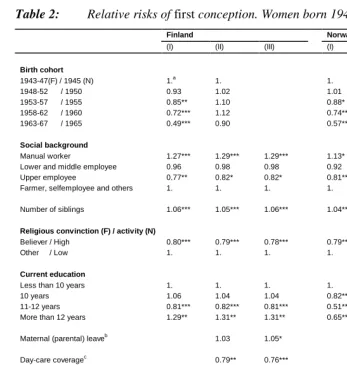
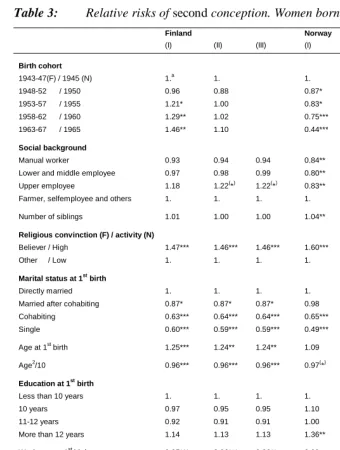
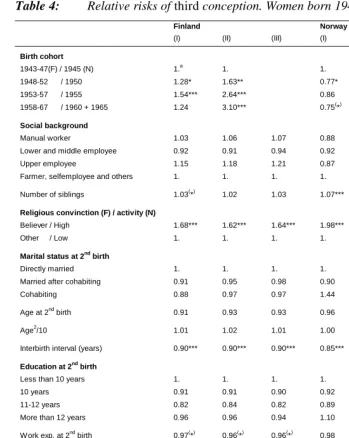
5. Results
The parameter estimates of the hazard of first, second and third conceptions are given in Tables 2-4. All estimates are reported as relative risks, i.e. the coefficients have been exponentiated. For continuous variables the interpretation is then as follows: For each unit increase in the explanatory variable, the hazard is multiplied by the coefficient. For dummy variables, the coefficient gives the hazard of a specific group relative to the hazard of a chosen reference group. The tables report results from three different models for each transition. Model (I) has no fertility price indicators. Model (II) contains price indicators that are available for both countries, i.e. duration of maternity (parental) leave and day-care coverage. Since these policy variables are strongly time trended, they are highly correlated with birth cohort, which is clearly demonstrated by the change in the cohort estimates in Model (II). Model (III) therefore excludes birth cohort, and in the case of Norway also includes the other available price indicators, predicted hourly wage and child benefits.
5.1 Background characteristics and preference indicators
Not surprisingly, the greatest impact of social background is on the timing of first birth. The pattern in the two countries is very similar: daughters of manual workers have their first baby sooner than other social groups, while daughters of upper employees wait the longest. Among Norwegian women there are also significant social differences in the risk of second conception, but at this stage the highest risk is found among the reference group of mainly farmers’ daughters. A similar, but non-significant pattern can also be observed for transitions to parity three. The Finnish estimates for birth orders two and three indicate a slightly different social pattern, as the highest conception risk is found among the highest social class. Coming from a large family generally speeds up the fertility process. In Norway the risks of first, second and third conception are all positively affected, while in Finland it is mainly the timing of first birth that is affected.
In both countries religiously active women are found to delay the time to first conception, but having become mothers, they have higher risks of getting the second or third child. This pattern is as expected, since religious morals demand sexual abstinence before marriage, implying a later age of sexual debut, but encourage traditional and lasting family relationships with children as an integrated part. The negative effect of religiosity on the risk of first birth is masked in analyses that are limited to married or cohabiting women where a positive effect is observed even for transitions to parity one (see e.g. Groot and Pott-Buter 1992).
Due to the simultaneity of union formation and first conception, this study excludes marital status when analysing this event. Moving on to parity one, women who were single or cohabiting at first birth are found to have a significantly lower risk of second conception than married women (Table 3), and for Finland there are also clear differences between the two groups of married women. Having probably stronger and more traditional familial values, women who married directly have a higher second birth risk than women who got married after a period of cohabitation. In the estimates of the third conception interval (Table 4), women who were single at second birth are excluded from the analysis, and there are no longer any significant differences between the remaining marital status groups.
5.2 Demographic variables
While there is a declining risk of second conception across cohorts in Norway, there is a corresponding increasing risk in Finland. For this country the cohort gradient for third conception is also estimated to be positive, with the highest risk found among cohorts born around 1955. For Norway the highest risk is still found among the oldest cohort, and there is little difference between succeeding cohorts.
The effect of lagged birth intervals as expressed through age at first birth and interbirth interval, is negative as expected for interbirth interval (Table 4), but positive for age at first birth, although the positive effect declines with age (Table 3). Rather than indicating unobserved fecundability this probably reflects a fertility pattern that has been observed for some time in the Nordic countries: having delayed the first child, mothers seem to «catch up» on lost time by having the next baby sooner. This behaviour may also be motivated by economics of scale (smaller direct child costs and/or lower foregone earnings due to a compression of the mother’s time out of paid work) and by public policies (e.g. priority to siblings in the allocation day-care spaces. See also Note 5).
5.3 Human capital variables
Higher education and longer work experience increase the opportunity costs of childbearing and hence lower the risk of conception. When not controlling explicitly for female wages, differences in human capital will also reflect wage differences. However, there may also be separate net effects of these variables, indicating for example unobserved differences in work and family preferences. This is confirmed by the Norwegian results in Table 2-4 where the estimated effects of education do not change much when hourly wage is included (Model III vs. Model II). In line with the theoretical predictions, higher education in Norway is found to delay the time to first conception, and this is also partly true for Finland, except for the highest educational level, where the effect is estimated to be positive and significant. For transitions to higher parities the educational effects are generally insignificant, but a positive effect of higher education is also estimated for Norway for transitions to parity two. This is in line with the findings for Sweden of Oláh (1996) who suggests that Swedish public policies have been successful in reducing the fertility costs for well-educated women (Note 6). It could also be an income effect, if these women have well-educated partners with high earnings.
current process and exogenous in that sense. The effect is estimated to be negative for both countries, but is significant only for Finland, and mainly for the risk of second conception.
5.4 Fertility price indicators
Model II includes indicators that are available for both countries, i.e. the length of the maternity/parental leave period and day-care coverage. The former variable varies more over time in Finland, where there have been more extensions, and the largest impact is also found for that country. The estimates are positive for all transitions, and are significant for first conception if cohort is excluded from the covariates (Model III) as well as for third conception regardless of model choice. For Norway the effect is also estimated to be positive for most parities, and is significant for the risk of second conception in Model III.
In line with previous analyses (Kravdal 1996, Klevmarken and Tasiran 1996), the effect of public day-care is estimated to be negative in most transitions, which is contrary to expectations. Since Kravdal’s analysis of Norway is based on the same data set as the present analysis, this is hardly surprising, but shows that the result holds even if the model formulation is different and more price indicators are included among the covariates. The negative effect declines with parity and turns positive, but not significant, for the risk of third conception in Norway. When categorizing the supply variable, Kravdal finds a significant positive effect on the third-birth probability at low coverage levels. Further, interaction effects indicate that better educated women may have responded more strongly to the day-care expansion. For Finland the only available supply indicator is day-care coverage at the national level, which is strongly time-trended, and may be a poor indicator of the local supply. The results seem to confirm this notion, as the effect is estimated to be negative and strongly significant, except for transitions to parity two.
wage effects for all transitions (parities one, two and three) and all cohorts. Tasiran (1994) has questioned the robustness of Heckman and Walker’s results by re-estimating their model with inputs from other wage series based on a combination of macro and micro data. His conclusion is that the wage effect is sensitive to the choice of wage series, and that the effect may be much weaker than suggested by Heckman and Walker (see Tasiran 2002 and Walker 2002 for further discussion).
Clearly, there is a need for more studies based on individual wage series (Note 7). One such previous study is Groot and Pott-Buter (1992), but their analysis is limited to the timing of first birth. However, their results confirm that higher female wages significantly delay maternity. This conclusion is further supported by the evidence of the present analysis, which is based on high-quality income information from administrative registers. The estimated wage effects are negative and significant for all transitions, except to parity three, mainly because of a smaller sample size.
The last price indicator examined for Norway is child benefits, which vary with calendar period and parity, but not across individuals. It is not significant in any transition, and does not seem to have had any impact on the risk of conception.
6. Conclusions
This paper has analysed the determinants of the fertility process in two Nordic welfare states, Finland and Norway, focusing especially on the importance of economic factors, including public policies. The Nordic countries are well suited for such analysis, since they have a long tradition of generous social policies in connection with childbearing and childrearing. Previously, studies of the various components of fertility cost and their importance for the timing and spacing of births have appeared from Sweden (e.g. Heckman and Walker 1990, Tasiran 1994, Walker 1995; Klevmarken and Tasiran 1996). The present analysis complements these analyses with evidence from Finland and Norway, based on more recent data sets, which for Norway also include high quality register information on individual income.
decide to have one child, may also want more children, and because of a higher age at first birth they will need to catch up on childbearing.
This study confirms that the economic environment is important for the timing of births. A higher female wage delays the time to first birth, and also reduces the likelihood of a second or third conception. The estimated negative effects are, however, smaller than those reported by Heckman and Walker for Sweden, based on a macro series of average wages. Further, there are indications that the extension of maternity leave has had a positive impact on fertility, especially in Finland and for higher order births. The estimated negative effect of public day-care is contrary to expectations, but has also been observed in previous research (e.g. Klevmarken and Tasiran 1996). The variable is, however, strongly related to the growth in female employment, and could reflect a general atmosphere of stronger work commitment among women, which may have affected work and fertility preferences in ways that are not fully accounted for by individual characteristics. A high coverage rate could in fact also result from a high surplus demand, since day-care spaces were always rationed in Finland and Norway during the studied period. These and other matters must be left for future research which should also examine the impact of family policy extensions after 1990 and if possible also include a broader range of policy indicators.
7. Acknowledgements
Notes
1. Later in the 1990s, the Swedish TFR dropped considerably to 1.5 children per woman. This is usually related to the sharp rise in unemployment in Sweden in the early 1990s and to a pro-cyclical pattern of fertility (see e.g. Hoem 2000, Andersson 2000).
2. The different wage and income estimates for Sweden have later been a subject of debate between Tasiran and Walker. See Tasiran (2002) and Walker (2002).
3. Norway introduced a similar policy in 1998.
4. This was also considered when analysing the second conception, but since single women still constituted 13 per cent for Norway (8 per cent for Finland) at that time, they were kept in the analysis sample.
5. In Sweden there is an added incentive of close spacing since mothers maintain their maternal rights without going back to work, if the next child is born within 30 month (before 1986: 24 months).
6. Positive effects of education on higher order births could also be an artefact of the estimation procedure, the so-called "piece-meal approach" whereby each parity is estimated separately. In a recent analysis based on Norwegian register data, Kravdal (2001) finds for example that the positive effects that appear in separate models disappear and turn negative when parity one, two and three are modelled jointly and a common unobserved factor is included. Positive effects from a "piece-meal approach" may thus also be a result of selection.
References
Andersson G (2000). "The Impact of Labour-Force Participation on Childbearing Behviour: Pro-Cyclical Fertility in Sweden during the 1980s and the 1990s.
European Journal of Population 16: 293-333.
Arroyo CR and J Zhang (1997). "Dynamic microeconomic models of fertility choice: A survey". Journal of Population Economics 10: 3-22.
Barmby T and A Cigno (1990). "A sequential probability model of fertility patterns".
Journal of Population Economics 3: 31-51.
Groot W and H Pott-Buter (1992). "The timing of maternity in the Netherlands".
Journal of Population Economics 5: 155-172.
Heckman JJ and JR Walker (1990). "The third birth in Sweden". Journal of
Population Economics 3: 235-275.
Hoem B (2000). "Utan jobb - inga barn? Fruktsamhetsutvecklingen under 1990-tallet". ("Without job - no children? Fertility trends during the 1990s"). SOU 2000:37. Socialdepartementet, Stockholm.
Ilmakunnas S (1997). "Public Policy and Childcare Choice". In: Persson I and C Jonung, eds. Economics of Family and Family Policy. London: Routledge.
Kiernan KE (1995). "Transition to Parenthood: Young Mothers, Young Fathers -Associated factors and later life experiences". Discussion Paper WSP/113, London School of Economics.
Klevmarken NA and AC Tasiran (1996). "Is the decision ‘to work’ endogenous to the fertility process?" Memorandum 220, Gothenburg University.
Kravdal Ø (1992). "The emergence of a positive relationship between education and third birth rates in Norway with supportive evidence from the United States".
Population Studies 46: 459-475.
Kravdal Ø (1996). "How the local supply of day-care centers influences fertility in Norway: A parity-specific approach". Population Research and Policy Review 15: 201-218.
Kravdal Ø (2001). "The High Fertility of College Educated Women in Norway: An Artefact of the Separate Modelling of Each Parity Transition". Demographic
Lesthaege R and G Moors (1995). "Is there a new conservatism that will bring back the old family? Ideational trends and the stages of family formation in Germany, France, Belgium and the Netherlands, 1981-1990". In: Evolution or Revolution in European Population, Plenary Vol., European Population Conference, Milan: FrancoAngeli.
Nordic Social-Statistical Committee (2003). Social Protection in the Nordic Countries 2001.
OECD (1996). National Accounts. Main Aggregates Vol. 1. 1960-1994.
Oláh L Sz. (1996). "The impact of Public Policies on the Second-Birth Rates in Sweden: a Gender Perspective". Stockholm Research Reports in Demography No.98.
Rønsen M (1992). “Norwegian women’s labour force participation one year after first birth”. Working Papers 4/1992, Social Statistics, Statistics Norway.
Rønsen M and M Sundström (1996). "Maternal Employment in Scandinavia. A Comparison of the After-Birth Employment Activity of Norwegian and Swedish Women". Journal of Population Economics 9: 267-85.
Rønsen M and M Sundström (1997). “The Choice between Full-time and Part-time Work for Norwegian and Swedish Mothers”. In: Persson I and C Jonung, eds.
Economics of Family and Family Policy. London: Routledge.
Social Insurance Institution (1994). Statistical Yearbook of the Social Insurance Institution, Finland, T1:30.
Tasiran AC (1994). "Wage and income effects on the timing and spacing of births in Sweden and the United States". Doctoral dissertation. Department of Economics, Gothenburg University.
Tasiran, AC (2002). "A reply to Walker's note: A comment on Tasiran's 'Wage and income effects on the timing and spacing of births in Sweden and in the United States'". Journal of Population Economics 15: 783-769.
Vikat, A (2004). "Women's labor force attachment and childbearing in Finland". MPIDR Working Paper WP 2004-001.
Walker JR (1995). "The effect of public policies on recent Swedish fertility behavior".
Journal of Population Economics 8: 223-251.
Walker JR (2002). "A Commen on Ali Tasiran's 'Wage and income effects on the timing and spacing of births in Sweden and in the United States'".
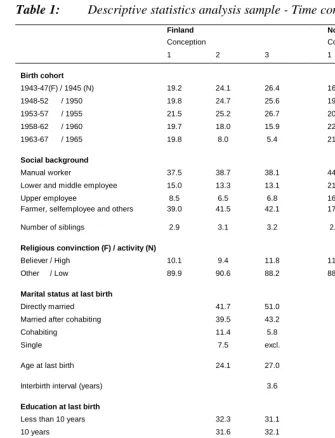
Table 1: Descriptive statistics analysis sample - Time constant covariates
Finland Norway
Conception Conception
1 2 3 1 2 3
Birth cohort
1943-47(F) / 1945 (N) 19.2 24.1 26.4 16.6 21.6 25.8
1948-52 / 1950 19.8 24.7 25.6 19.0 24.0 28.5
1953-57 / 1955 21.5 25.2 26.7 20.9 24.5 26.4
1958-62 / 1960 19.7 18.0 15.9 22.4 20.6 16.3
1963-67 / 1965 19.8 8.0 5.4 21.1 9.3 2.9
Social background
Manual worker 37.5 38.7 38.1 44.8 47.6 48.0
Lower and middle employee 15.0 13.3 13.1 21.2 18.9 17.2
Upper employee 8.5 6.5 6.8 16.4 14.2 13.9
Farmer, selfemployee and others 39.0 41.5 42.1 17.7 19.3 21.0
Number of siblings 2.9 3.1 3.2 2.5 2.6 2.6
Religious convinction (F) / activity (N)
Believer / High 10.1 9.4 11.8 11.7 11.1 14.5
Other / Low 89.9 90.6 88.2 88.3 88.9 85.5
Marital status at last birth
Directly married 41.7 51.0 47.0 61.7
Married after cohabiting 39.5 43.2 26.5 33.2
Cohabiting 11.4 5.8 14.6 5.2
Single 7.5 excl. 11.8 excl.
Age at last birth 24.1 27.0 23.3 26.2
Interbirth interval (years) 3.6 3.5
Education at last birth
Less than 10 years 32.3 31.1 22.3 22.6
10 years 31.6 32.1 41.6 42.5
11-12 years 26.9 25.2 18.7 16.1
More than 12 years 9.3 11.5 17.4 18.8
W ork exp. at last birth
Hourly wage at last birth (1990 NOK) n.a. n.a. 71.20 78.60
Mean duration (months) 124.6 46.6 67.5 111.8 40.5 65.6
- events 104.4 31.6 41.3 95.3 31.3 38.1
- non-events, incl. censored 169.2 78.4 79.7 153.2 62.3 80.0
Number of women 3 639 2 511 1 715 3 296 2 355 1 630
Table 2: Relative risks of first conception. Women born 1943-1967
Finland Norway
(I) (II) (III) (I) (II) (III)
Birth cohort
1943-47(F) / 1945 (N) 1.a 1. 1. 1.
1948-52 / 1950 0.93 1.02 1.01 1.05
1953-57 / 1955 0.85** 1.10 0.88* 1.00
1958-62 / 1960 0.72*** 1.12 0.74*** 0.92
1963-67 / 1965 0.49*** 0.90 0.57*** 0.75*
Social background
Manual worker 1.27*** 1.29*** 1.29*** 1.13* 1.17** 1.17** Lower and middle employee 0.96 0.98 0.98 0.92 0.99 1.00 Upper employee 0.77** 0.82* 0.82* 0.81** 0.88(*) 0.88(*)
Farmer, selfemployee and others 1. 1. 1. 1. 1. 1.
Number of siblings 1.06*** 1.05*** 1.06*** 1.04*** 1.04*** 1.04***
Religious convinction (F) / activity (N)
Believer / High 0.80*** 0.79*** 0.78*** 0.79*** 0.79*** 0.78***
Other / Low 1. 1. 1. 1. 1. 1.
Current education
Less than 10 years 1. 1. 1. 1. 1. 1.
10 years 1.06 1.04 1.04 0.82*** 0.83*** 0.85**
11-12 years 0.81*** 0.82*** 0.81*** 0.51*** 0.52*** 0.56*** More than 12 years 1.29** 1.31** 1.31** 0.65*** 0.68*** 0.79*
Maternal (parental) leaveb 1.03 1.05* 0.92 1.04
Day-care coveragec 0.79** 0.76*** 0.87*** 0.88***
Child benefits (1 000 NOK/year)d n.a. 0.97
Hourly wage (10 NOK)d n.a. 0.94*
-2 Log Likelihood 304.5 346.2 336.3 335.4 377.4 382.1
DF 12 17e 13e 12 18e 16e
Number of women 3 639 3 296
Number of events 2 506 2 314
a Reference category. b Finland: months (continuous variable). Norway: 12 weeks (reference group) and 18-22 weeks. c No. of
spaces per 10 children aged 0-6 (F)/0-3 (N). d 1990 prices. e This model also contains regional dummies which are mainly of national interest. n.a. = not available
Table 3: Relative risks of second conception. Women born 1943-1967
Finland Norway
(I) (II) (III) (I) (II) (III)
Birth cohort
1943-47(F) / 1945 (N) 1.a 1. 1. 1.
1948-52 / 1950 0.96 0.88 0.87* 0.82**
1953-57 / 1955 1.21* 1.00 0.83* 0.75**
1958-62 / 1960 1.29** 1.02 0.75*** 0.66**
1963-67 / 1965 1.46** 1.10 0.44*** 0.38***
Social background
Manual worker 0.93 0.94 0.94 0.84** 0.86* 0.86*
Lower and middle employee 0.97 0.98 0.99 0.80** 0.83* 0.83*
Upper employee 1.18 1.22(*) 1.22(*) 0.83** 0.89 0.91
Farmer, selfemployee and others 1. 1. 1. 1. 1. 1.
Number of siblings 1.01 1.00 1.00 1.04** 1.04** 1.04**
Religious convinction (F) / activity (N)
Believer / High 1.47*** 1.46*** 1.46*** 1.60*** 1.58*** 1.58***
Other / Low 1. 1. 1. 1. 1. 1.
Marital status at 1st birth
Directly married 1. 1. 1. 1. 1. 1.
Married after cohabiting 0.87* 0.87* 0.87* 0.98 0.99 0.98
Cohabiting 0.63*** 0.64*** 0.64*** 0.65*** 0.67*** 0.65***
Single 0.60*** 0.59*** 0.59*** 0.49*** 0.49*** 0.48***
Age at 1st birth 1.25*** 1.24** 1.24** 1.09 1.10 1.23**
Age2/10 0.96*** 0.96*** 0.96*** 0.97(*) 0.97* 0.96**
Education at 1st birth
Less than 10 years 1. 1. 1. 1. 1. 1.
10 years 0.97 0.95 0.95 1.10 1.07 1.12
11-12 years 0.92 0.91 0.91 1.00 1.02 1.13
More than 12 years 1.14 1.13 1.13 1.36** 1.37** 1.74***
W ork exp. at 1st birth 0.95*** 0.96*** 0.96** 0.99 0.99 0.99
Maternal (parental) leaveb 1.05 1.03 1.15 1.22*
Day-care coveragec 0.98 1.03 0.94(*) 0.93(*)
Child benefits (1 000 NOK/year)d n.a. 0.99
Hourly wage (10 NOK)d n.a. 0.89**
-2 Log Likelihood 177.7 192.1 186.8 286.1 317.7 307.7
DF 18 23e 19e 18 24e 22e
Number of women 2 511 2 355
Number of events 1 711 1 641
Table 4: Relative risks of third conception. Women born 1943-19671
Finland Norway
(I) (II) (III) (I) (II) (III)
Birth cohort
1943-47(F) / 1945 (N) 1.a 1. 1. 1.
1948-52 / 1950 1.28* 1.63** 0.77* 0.71**
1953-57 / 1955 1.54*** 2.64*** 0.86 0.74(*)
1958-67 / 1960 + 1965 1.24 3.10*** 0.75(*) 0.61*
Social background
Manual worker 1.03 1.06 1.07 0.88 0.87 0.87
Lower and middle employee 0.92 0.91 0.94 0.92 0.91 0.91
Upper employee 1.15 1.18 1.21 0.87 0.88 0.89
Farmer, selfemployee and others 1. 1. 1. 1. 1. 1.
Number of siblings 1.03(*) 1.02 1.03 1.07*** 1.07** 1.07**
Religious convinction (F) / activity (N)
Believer / High 1.68*** 1.62*** 1.64*** 1.98*** 1.98*** 1.96***
Other / Low 1. 1. 1. 1. 1. 1.
Marital status at 2nd birth
Directly married 1. 1. 1. 1. 1. 1.
Married after cohabiting 0.91 0.95 0.98 0.90 0.94 0.93
Cohabiting 0.88 0.97 0.97 1.44 1.45 1.43
Age at 2nd birth 0.91 0.93 0.93 0.96 0.96 1.04
Age2/10 1.01 1.02 1.01 1.00 0.99 0.99
Interbirth interval (years) 0.90*** 0.90*** 0.90*** 0.85*** 0.85*** 0.85***
Education at 2nd birth
Less than 10 years 1. 1. 1. 1. 1. 1.
10 years 0.91 0.91 0.90 0.92 0.90 0.95
11-12 years 0.82 0.84 0.82 0.89 0.87 0.99
More than 12 years 0.96 0.96 0.94 1.10 1.08 1.43
W ork exp. at 2nd birth 0.97(*) 0.96(*) 0.96(*) 0.98 0.97 0.98
Maternal (parental) leaveb 1.15** 1.16** 1.15 1.13
Day-care coveragec 0.55*** 0.76* 1.04 1.02
Child benefits (1 000 NOK/year)d n.a. 1.01
Hourly wage (10 NOK)d n.a. 0.89
-2 Log Likelihood 27.2 155.5 142.4 193.3 200.4 196.1
DF 17 22e 19e 17 23e 22e
Number of women 1 715 1 630
Number of events 547 559
Figure 2: Length of paid maternity leave. 1968-2001
0 10 20 30 40 50 60
2001 1998 1995 1992 1989 1986 1983 1980 1977 1974 1971 1968 Weeks
Sources: Norway: L. Hansen, Interne notater 91/17, Statistics Norway 1991 and Ministry of Children and Family Affairs; Finland: Ministry of Social Affairs and Health
Figure 3: Child care spaces per 100 children aged 0-61
0 10 20 30 40 50 60
2001 1998 1995 1992 1989 1986 1983 1980 1977 1974 1971 1968 Per cent
Sources: Statistics Norway: Historical statistics 1994; Statistics Finland: Statistical yearbook 1995 and STAKES, National Research and Development Centre for Welfare and Health
Noway
Finland
Norway 2000-2001: 0-5 years.