Determination of crop and soil evaporation coefficients for
estimating evapotranspiration in a paddy field
Yan Haofang
1,4,
Zhang Chuan
2,4*,
Hiroki Oue
3,
Peng Guangjie
1,
Ransford Opoku Darko
1(1. Research Center of Fluid Machinery Engineering and Technology, Jiangsu University, Zhenjiang 212013, China; 2.Institute of Agricultural Engineering, Jiangsu University, Zhenjiang 212013, China;
3. United Graduate School of Agricultural Sciences, Ehime University, 3-5-7 Tarumi, Matsuyama, 790-8566, Japan;
4. Department of Water Management, Delft University of Technology, Delft, 2600GA, the Netherlands)
Abstract: Accurate estimation of evapotranspiration is important in efficient water management for improving water use
efficiency. In order to obtain evapotranspiration and evaporation beneath the canopy using the Food and Agriculture Organization (FAO) method, pan evaporation was used instead of reference evapotranspiration calculated by the Penman-Monteith equation with detailed meteorological data. The total crop coefficient and soil evaporation coefficient were determined using actual measured daytime evapotranspiration and evaporation by the Bowen ratio energy balance and lysimeter, respectively, in a rice paddy field in Japan. The average evapotranspiration was 5.3 mm/d, 4.4 mm/d, 7.4 mm/d and 6.3 mm/d and crop coefficient was 0.79, 1.18, 1.01 and 0.86 for the initial stage, development stage, middle-season stage and late-season stage, respectively. The evaporation was low and almost constant with an average value around 0.77 mm/d when the leaf area index (LAI) reached 3. The proposed average crop coefficients for different growing stages were applied to estimate daytime evapotranspiration and found suitable. A simple soil water evaporation coefficient model was developed using leaf area index for practical use and it was found that it could accurately estimate evaporation.
Keywords: evapotranspiration, evaporation, paddy field, lysimeter, leaf area index (LAI), Bowen ratio energy balance DOI: 10.25165/j.ijabe.20171004.2290
Citation: Yan H F, Zhang C, Oue H, Peng G J, Darko R O. Determination of crop and soil evaporation coefficients for
estimating evapotranspiration in a paddy field. Int J Agric & Biol Eng, 2017; 10(4): 130–139.
1 Introduction
Rice is an important staple food crop in Japan,
Received date: 2016-04-20 Accepted date: 2016-12-11 Biographies: Yan Haofang, PhD, Associate Professor, research interest: water saving irrigation theory and technology, Email: yanhaofangyhf@163.com; Hiroki Oue, PhD, Professor, research
interest: water saving irrigation theory and technology, Email: oue@agr.ehime-u.ac.jp; Peng Guangjie, PhD, Associate Professor,
research interest: fluid machinery engineering, Email: pgj@ujs.edu.cn; Ransford Opoku Darko, PhD candidate, research
interest: water saving irrigation theory and technology, Email: chiefrodark@yahoo.com.
*Corresponding Author: Zhang Chuan, PhD, Associate
Professor, research interest: water saving irrigation theory and technology. Institute of Agricultural Engineering, Jiangsu University, Xuefu Road 301, Zhenjiang 212013, China. Tel: +86-18252933901, Fax: +86-511-88783979, Email: zhangchuan@ ujs.edu.cn.
and lysimeter data. They found that estimated Kc were higher than the values recommended by the FAO. Tyagi et al.[13] presented mean K
c values of 1.15, 1.23, 1.14 and 1.02 for initial, development, mid-season and late season stages, respectively, for the semiarid conditions of India. Hwan et al.[14] presented Kc values between 0.78 and 1.58 for transplanted paddy rice in the nine regions of Korea. Attarod et al.[15] reported an average Kc equal to 0.95 for paddy rice in the tropical climate of Thailand. Spanu et al.[16] obtained different
Kc using the Penman-Monteith equation and pan evaporation in sprinkler irrigation rice in Sardinia, Italy. Different Kc values of 0.95, 1.00 and 0.97 were also reported for aerobic rice for the initial, mid-season and ripening stages, respectively, in the Philippines[17]. Moratiel and Martinez-Cob[18] determined ETc and Kc for sprinkler irrigated rice for the semiarid conditions of Northeast Spain using the surface renewal method. As seen from the literature, 1) different Kc values of rice were obtained as a function of the climatic conditions and the management practices of the study area[13,17], or due to the different methods (Penman-Monteith equation and pan evaporation) for ET0 estimation; 2) the studies on ETc and Kc in rice paddy fields using the FAO Kc method were scarcely found in Japan[19]; and 3) most studies estimated Kc based on detailed meteorological data using the Penman-Monteith equation. However, the meteorological data required for use in the Penman-Monteith equation are not always available in some areas. Keeping these points in mind, the aims of the present study were to 1) determine the crop coefficient for paddy rice in Japan using actual measured ETc using the Bowen ratio energy balance method and pan evaporation; 2) compare the derived crop coefficient from pan evaporation (Kc pan) with previous studies; and 3) validate the ETc estimation procedure using average Kc pan and pan evaporation. Moreover, in order to estimate the contribution of evaporation from the soil surface of the paddy field, the soil water evaporation coefficient was determined using actual measured evaporation by lysimeter and pan evaporation. The simple soil water evaporation coefficient model was constructed using leaf area index.
2 Materials and methods
2.1 Field observation
The experiment was conducted in a paddy field located at the Ehime University Senior High School, Matsuyama, Japan (33°50′N, 132°47′E) in 2009 and 2010.
Oryza sativa L. cv. Akita-Komachi, which is one of the
main cultivars of rice in Japan, was used for the experiment. The rice plants were transplanted into the field on May 30 with 25 cm spacing between the rows, and 20 cm spacing within a row (a planting density of 20 hills per square meter), and harvested on September 3, 2009. In 2010, the rice plants were transplanted into the field on May 28 and harvested on August 27 with the same planting density. The elements of radiation balance, i.e. (1–alb)SR and Ld–Lu, were measured with a CNR-2 (Kipp & Zonen, the Netherlands) at 2.5 m and thus the net radiation (Rn) was calculated. Here, SR is the global solar radiation, alb is the albedo of the paddy field, Ld is the downward long wave radiation from the atmosphere and Lu is the upward long wave radiation from the paddy field. In addition, the global solar radiation was measured at 2 m height with a second sensor (Decagon, USA, model LI-200SL). Ld was also measured with a PRI-01 (Prede, Japan) at 2 m height and
1 plant was calculated. The leaf area index (LAI) was calculated with plant density and leaf area for 1 plant. Plant height was measured with 10 fixed rice plants at same time with leaf area measurement.
The evapotranspiration (ETc) was estimated using Bowen ratio energy balance method. Water surface evaporation beneath the rice canopy (Eg) was measured by a lysimeter. The lysimeter, size of which was 20 cm × 60 cm × 30 cm (width × length × depth), was buried between the crop rows. The water depth within the lysimeter was kept almost similar to that in the paddy field. Eg was obtained by observing the decrease in water level in the lysimeter, which was measured at 8:00 and 18:00 every day from July 6 to September 3, 2009
and from June 2 to August 27, 2010. In the same manner, the pan evaporation above the rice plant was measured using a round brown pan (20 cm in diameter × 25 cm in depth) which was set on a piece of wood plate surface at a height of 1.5 m. The water depth within the pan was always kept higher than 2 cm. The water depth in the paddy field was measured every day at the same time as lysimeter measurement. In this study, we focused on modeling daytime ETc and Eg, because nighttime ETc and Eg were relatively small compared with daytime ETc and Eg.
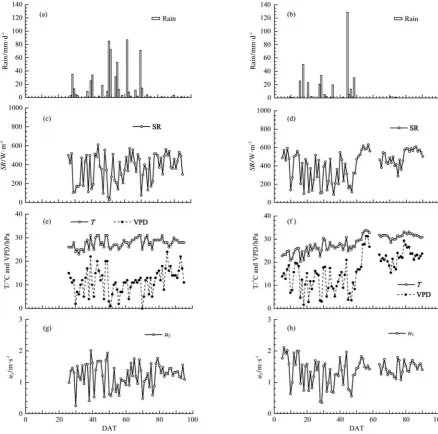
The meteorological conditions during the rice growth periods in 2009 and 2010 are shown in Figure 1.
Figure 1 Seasonal variation in meteorological conditions: (a) and (b) rainfall in 2009 and 2010, (c) and (d) solar radiation (SR), (e) and (f) air temperature (T) and vapor pressure deficit (VPD), (g) and (h) wind speed at 2 m height (u2), from 26 d to 95 d after transplanting (DAT)
The recorded rainfall during the crop growth season was 630 mm and 369 mm for 2009 and 2010, respectively. The observation of meteorological data in 2009 started from 26 d after transplanting (DAT). The average solar radiation and temperature was similar for both years, although the values from 50 DAT in 2010 were higher than in 2009 due to less rainfall in 2010. The mean vapor pressure deficit (VPD) was higher in 2010 than that in 2009, particularly during the middle and late season of crop growth. The average wind speed was relatively similar between years, with average values of 1.2 m/s and 1.3 m/s for 2009 and 2010, respectively.
2.2 Methodology
2.2.1 Actual evapotranspiration
In this study, the actual evapotranspiration (ETc) was calculated using the Bowen ratio energy balance method by summing the hourly values. Daytime latent heat flux was obtained based on the heat balance at the canopy surface expressed by the rearranged energy balance equation as follows:
1
Rn G W
LET
β
− − Δ =
+ (1)
where, LET is the latent heat flux density, W/m2; Rn is the net radiation, W/m2; G is the soil heat flux density, W/m2; ΔW is the heat storage in the water layer, W/m2;
β is the Bowen ratio.
The heat storage ΔW is expressed as:
w w w w
dT
W c d
dt
ρ
Δ = (2)
where, cw is the specific heat of water (cw = 4.18 J/kg·K),
dw is the depth of the water layer beneath the rice canopy, m; ρw is the density of water, kg/m3; Tw is the water temperature at time t, °C.
2.2.2 Reference evapotranspiration
Most researchers calculate reference evapotranspiration
ET0 using the FAO Penman-Monteith method from daily meteorological variables (air temperature, relative humidity, net radiation and wind speed) as:
1 2
0
2 2
0.408 ( ) ( ) 273
(1 )
n s a
a
C
R G u e e
T ET
C u
γ γ
Δ − + −
+ =
Δ + + (3)
where, Rn is net radiation, MJ/(m2·d); G is soil heat flux density, MJ/(m2·d); T
a is mean daily air temperature at
2 m height, °C; u2 is wind speed at 2 m height, m/s; es and
ea are saturation and actual vapour pressure (kPa) respectively; Δ is the slope of the saturation vapour pressure curve at air temperature Ta, kPa/°C; γ is the psychrometric constant, kPa/°C; C1 and C2 are constants and depend on the reference crop type and calculation time step.
From above equations, we found detailed meteorological data are needed using Equation (3) to estimate the ET0. In this study, we made a new definition for crop coefficients as described below.
2.2.3 Crop coefficients
According to the FAO-56 method, the crop coefficient Kc could be expressed as:
0
/
c c
K =ET ET (4)
when the dual crop coefficient approach[20] is adapted, the Equation (4) could be expressed as:
0
( ) /
c cb e t g
K =K +K = E +E ET (5)
where, Kcb is the basal crop coefficient; Ke is the soil water evaporation coefficient beneath the canopy; ETc is actual evapotranspiration, mm/d; Et is plant transpiration, mm/d; Eg is the evaporation from soil surface beneath the canopy, mm/d; ET0 is reference evapotranspiration, mm/d.
The Penman-Monteith Equation is often used to calculate ET0 precisely. However, in order to calculate
ETc and Eg when meteorological data are not available, we applied pan evaporation (Epan) to determine the Kc and
Ke instead of ET0 calculated from the Penman-Monteith Equation. The evaporation rate from pans filled with water is easily obtained, and pans provide a measurement of the integrated effect of radiation, wind speed, temperature and humidity on evaporation from an open water surface. Although several factors such as reflection of solar radiation and storage of heat within the pan produce differences in loss of water from a water surface (Epan) and from a cropped surface (ET0)[20], Yan et al.[10] applied E
pan to determine Eg in a bare field in the same research area and found it suitable. So, the crop coefficient which was calculated by pan evaporation (Kc pan) could be expressed as:
pan pan pan ( ) /
c cb e t g pan
K =K +K = E +E E (6)
pan evaporation; Kepan is the soil water evaporation coefficient calculated by pan evaporation; Epan is water surface evaporation above the rice canopy measured using a round pan.
In this study, standard conditions were considered, namely, there was no soil water and salinity stress in the present paddy field since the soil was flooded for most of
the growth period.
Following the FAO-56 approach[20], the growth season of the rice crop is divided into four stages: the initial stage, the crop development stage, the mid-season stage and the late season stage. The divided growth stages for the rice crop and the main features of each stage are given in Table 1.
Table 1 Developmental stages for paddy rice observed in 2009 and 2010
Initial stage/d Development stage/d Mid-season stage/d Late-season stage/d Year Transplanting date Harvest date
Tillering Panical initiation Flowering and grain formation Grain growth and maturity Total/d
2009 30 May 3 Sep 15 30 30 20 95
2010 28 May 27 Aug 15 30 30 15 90
In the paddy field, we think that soil evaporation occurs at the maximum rate limited only by energy availability at the soil surface. In this case, the soil coverage would be a main influencing factor on soil evaporation. A simple Ke pan sub-model was constructed by analyzing the relationship between LAI and the soil evaporation coefficient Ke pan.
For validation of the soil water evaporation coefficient model, the statistical error between modeled and measured soil evaporation was calculated and two-tail t-test statistical analysis method was used with the data from 2009.
3 Results and discussion
3.1 Variation of plant height and LAI
The crop height and LAI of rice in 2009 and 2010 are shown in Figure 2. The rice plant reached a maximum height of 1.1 m and 1.0 m for 2009 and 2010, respectively, approximately 65-75 DAT. The maximum plant height was higher than the values (0.7 m) reported by Moratiel and Martinez-Cob[18] for the same cultivar of rice. The measured LAI exceeded 1.0 around 30 DAT and reached a maximum value of 7.02 in 2009 and 5.13 in 2010.
a. 2009 b. 2010
Figure 2 Evolution of plant height and leaf area index (LAI) during rice growing seasons in 2009 and 2010; the transplanting and harvesting dates were May 30 and September 3 in 2009 and May 28 and August 27 in 2010
3.2 Variation of actual evapotranspiration and
evaporation
In this study, the actual evapotranspiration (ETc) was measured using Bowen ratio energy balance method. The ETc of paddy rice in 2009 and 2010, which was obtained from the Bowen ratio energy balance method, is
whole growth periods were 95 d and 90 d for 2009 and 2010, respectively, and were divided into four stages. The average daytime ETc was 6.1 mm, 5.7 mm and 5.7 mm for the development stage, middle-season stage and late-season stage, respectively, in 2009 while it was 5.3 mm, 4.4 mm, 7.4 mm, and 6.3 mm for the initial stage, development stage, middle-season stage and late-season stage, respectively, in 2010. The ETc for the middle season in 2009 was not higher than the other stages and
ETc for the development stage in 2010 was lower than the other stages. The difference was mainly due to lower solar radiation during the rainy season (Figure 1). Alberto et al.[17] reported average daytime values of mid-season ETc of about 5.0 mm, while seasonal ETc of 500 mm and 434 mm in the Philippines with growing periods of 126 d and 136 d, respectively. Moratiel and Martinez-Cob[18] reported the average daytime ETc for mid-season (from 90 DAT to 130 DAT) was about 5.2
mm, while seasonal rice ETc of 755 mm and 811 mm in Spain with growing periods of 155 d and 165 d, respectively. The lower seasonal ETc in this study may be due to the short growing period (95 d and 90 d) and long rainy season during the rice growing periods. The
Epan showed a similar trend with ETc although Epan was slightly higher than ETc at the beginning stage and lower than ETc in the middle stage. For the late-season, Epan increased to higher than ETc. The average Epan during the whole rice growing season was 5.5 mm/d and 5.7 mm/d for 2009 and 2010, respectively. Water surface evaporation beneath the canopy Eg decreased with the growth of paddy rice because of the increase in the water surface coverage. Eg was low and almost constant with an average value around 0.77 mm/d and 0.75 mm/d for 2009 and 2010, respectively, when the LAI reached 3 (45 DAT)
a. 2009 b. 2010
Figure 3 Actual evapotranspiration (ETc), soil water evaporation beneath the rice canopy (Eg) and pan evaporation (Epan) during rice
growing seasons in (a) 2009 and (b) 2010; the transplanting and harvesting dates were May 30 and September 3 in 2009 and May28 and August 27 in 2010
3.3 Determination of crop coefficient using actual
measurements
The total crop coefficient Kc pan of paddy rice, the basal crop coefficient Kcb pan and the soil water evaporation coefficient Ke pan for 2009 and 2010 which were calculated by pan evaporation using Equation (6) are shown in Figure 4. The coefficient for the initial stage of rice in 2009 is missing because of a lack data. As shown in Figure 4, before around 30 DAT, Ke pan almost equaled Kcpan because soil water evaporation beneath the canopy Eg was the main water loss of ETc.
Kcb pan tended to almost equal Kc pan because the crop transpiration was the main water loss of ETc under full
soil surface coverage of the paddy rice after around 30DAT. The average Kcb pan was 0.64, 1.08 and 0.78 for the development stage, middle stage and late season stage in 2009, respectively, and was 0.01, 0.73, 0.76 and 0.73 for the initial stage, development stage, middle stage and late season stage in 2010, respectively. The average
for 2009 and 2010 was 0.56-1.84 and 0.68-1.76, respectively, which were different from the results reported by the Research Group on Evapotranspiration[21] that Kc pan values in the range 0.40-1.05 based on the pan evaporation method for rice under Japanese climatic conditions. However, higher values in the range 1.1-1.6 were obtained by Tomar and O’Toole[22] based on pan evaporation in monsoonal Asian countries. Similarly, Rao et al.[23] obtained Kc pan in the range 0.88-1.99 based on pan evaporation in South India. Reuss[24] presented
Kc pan values in the range 0.80-1.95 under tropical Pakistan climatic conditions. Gupta et al.[25] derived Kc
pan values in the range 0.62-2.32 for rice grown under north Indian climatic conditions. The likely reasons for the difference in Kc pan between our study and other research are 1) different pan types, size and color used for measuring pan evaporation, 2) different pan heights set above the canopy and the state of upwind buffer zone, 3) different level at which the water is maintained in the pan and 4) irrigation and climate conditions for measuring
ETc. All of those factors may enable an increase or decrease in Epan and ETc resulting in the different Kc pan between the present study and other studies.
a. 2009 b. 2010
Figure 4 Total crop coefficient (Kc pan= ETc/Epan), soil water evaporation coefficient (Ke pan = Eg/Epan) and basal crop coefficient
(Kcb pan = Kc pan– Ke pan) during rice growing seasons in (a) 2009 and (b) 2010; the transplanting and harvesting dates were May 30 and
September 3 in 2009 and May 28 and August 27 in 2010 3.4 Validation of average total crop coefficient
It is necessary to validate the accuracy of average
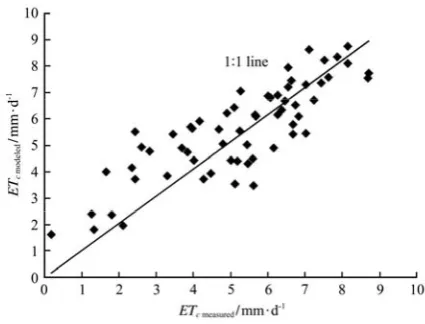
Kc panfor each stage to calculate ETc for practical use such as irrigation scheduling. We calculated daytime ETc of paddy field in 2010 using average Kc pan of 2009. Figure 5 shows the comparison between measured and calculated ETc for 2010. There was high correlation between measured and calculated ETc. The regression points were scattered close to 1:1 line with some exceptions. The regressing lines were close to 1:1 which means the calculated ETc were close to the measured values. The coefficients of determination (R2) was 0.69. The interception (a) and slope (b) of least-squares regression was 0.72 and 1.86. The other statistical parameters, such as systematic mean square errors (MSEs), unsystematic mean square errors (MSEu) and index of agreement (d) were shown in Table 2. According to two-tail t-test statistical analysis (significant level α=0.05), there were no significant differences
between measured and calculated ETc. It was revealed that the application of pan evaporation instead of ET0 from detailed meteorological data for estimation of ETc was feasible. However, the determined Kc pan for paddy rice in present study still needs validations based on more data in other different climate areas.
Figure 5 Comparison of calculated ETc using average crop
coefficient Kc pan with measured values in 2010; the transplanting
Table 2 Error analysis statistics of the comparison between measured and predicted ETc during 2009 and 2011
Year P M a b R2 RMS MSE
s MSEu d
2010 5.55 5.58 0.72 1.86 0.69 1.72 0.21 0.93 0.89 Note: P and M are mean predicted and measured ETc, respectively; a and b interception and slope of least square regression line, R2 coefficients of determination, RMS
root mean square error, MSEssystematic mean square error, MSEuunsystematic mean square error, d index of agreement; b, R2 and d are dimensionless, while the remaining terms have the unit of mm/d.
3.5 Simple model for soil water evaporation
coefficient beneath the rice canopy
The FAO recommends determining soil evaporation coefficient using the energy and water available for evaporation at the soil surface[20]. In the paddy rice field, the soil surface was flooded by water for almost the whole growth period except for some days in the late season; so, we assumed that the percentage of energy that reached the soil surface is the only factor affecting soil water evaporation beneath the rice canopy. We applied LAI to simulate soil evaporation coefficient Ke pan. As shown in Figure 6, there was a negative relationship between Ke and LAI. The relationships between LAI and Ke were constructed using the data from 2009 (Equation (7)) and 2010 (Equation (8)):
pan 0.43 0.16log( )
e
K = − LAI R2=0.72 (7)
pan 0.46 0.16log( )
e
K = − LAI R2=0.51 (8)
Figure 6 Correlation between leaf area index (LAI) and soil water evaporation coefficient (Ke pan) for 2009 and 2010
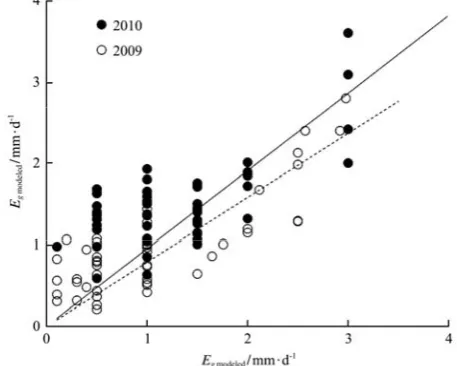
The above equations obtained based on the data from 2009 and 2010 showed quite similar coefficients. We used the data from 2009 to validate and assess the model constructed based on the data from 2010, while the data from 2010 to validate and assess the model constructed based on the data from 2009. The comparisons between measured and modeled soil water evaporation beneath the canopy are shown in Figure 7. The slopes of regression lines and correlation coefficients are 0.95 and 0.71 for Eg
modeled by Epan based on the data from 2009, while the values are 0.79 and 0.54, respectively, based on the data from 2010. The advantage of applying Epan to estimate
Eg is that meteorological data are not needed. This is to facilitate estimating Eg for areas where meteorological data are unavailable. Equations (7) and (8) could be used together with the above recommended total crop coefficient to estimate soil water evaporation beneath the canopy and crop transpiration separately.
Figure 7 Comparison of measured soil water evaporation beneath the canopy Eg measured with calculated values Eg modeled using Epan in
2009 and 2010
4 Conclusions
average total crop coefficient was taken for the four rice growth stages. To verify the accuracy of determined average Kcpan for each stage, evapotranspiration was reproduced using average Kc pan based on different data set. It was found that there were no significant differences between measured and reproduced evapotranspiration. The soil evaporation coefficient was modeled using LAI with data from 2009 and 2010 using logarithmic equations. The performance of the Ke pan models were verified by comparing the calculated and measured evaporation. As a result, evaporation could be estimated using the constructed Kepan model. By combining the Ke pan model and the Kc pan values for each stage, soil water evaporation beneath the rice canopy and transpiration could be estimated separately without using any meteorological data.
Acknowledgements
We greatly appreciate the careful and precise reviews by the anonymous reviewers and editors. This study has been financially supported by the Natural Science Foundation of China (51509107, 51609103), the Key Laboratory of Agricultural Water Resources, the Chinese Academy of Sciences (No. KFKT201605), Natural Science Foundation of Jiangsu province (BK20140546, BK20150509), the Scientific Research Foundation for the Returned Overseas Chinese Scholars, State Education Ministry (2015, No. 311), and Jiangsu University Senior Professional Scientific Research Fund Project (14JDG015, 14JDG017, 12JDG097), Jiangsu Universities Engineering Discipline Construction Project (1033000001).
[References]
[1] Sato H. The current state of paddy agriculture in Japan. Irrig Drain, 2001; 50: 91–99.
[2] Yu F H, Xu T Y, Cao Y L, Yang G J, Du W, Wang S. Models for estimating the leaf NDVI of japonica rice on a canopy scale by combining canopy NDVI and multisource environmental data in Northeast China. Int J Agric & Biol Eng, 2016; 9(5): 132–142.
[3] Liu X, Bian C, Ma C, Liu Q, Wei C, Li Q. Yield loss compensation effect and water use efficiency of widely and precisely sowed winter wheat covered under corn stalks. Journal of Drainage and Irrigation Machinery Engineering,
2015; 33(9): 811−817. (in Chinese)
[4] Fu Q, Meng F X, Li T X, Liu D, Gong F L, Osman A, et al. Cloud model-based analysis of regional sustainable water resource utilization schemes. Int J Agric & Biol Eng, 2016; 9(5): 67–75.
[5] Allen R G, Pereira L S, Smith M, Raes D, Wright J L. The FAO-56 dual crop coefficient method for predicting evaporation from soil and application extensions. J. Irrig Drain Eng., 2005; 131(1): 2–13.
[6] He B, Oue H, Wang Y, Takase K. Micrometeorological model for estimating evapotranspiration from a wheat Field in the Hetao Irrigation District of Yellow River Basin. Proceeding of JSIDRE, 2005; 60: 179–182.
[7] He B, Oue H, Wang Y, Takase K. Measurement and modeling of evapotranspiration from an irrigated wheat field in the Hetao irrigation district of the yellow river basin, J Japan Soc Hydro Water Resource, 2007; 20: 8–16.
[8] Yan H, Oue H. Application of the two-layer model for predicting transpiration from the rice canopy and water surface evaporation beneath the canopy. J Agric Meteorol, 2011; 67(3): 89–97.
[9] Yan H, Oue H, Zhang C. Predicting water surface evaporation in the paddy field by solving energy balance equation beneath the rice canopy. Paddy and Water Environment, 2012; 10(2): 121–127.
[10] Yan H, Zhang C, Oue H, Sugimoto H. Comparison of different methods for estimating soil surface evaporation in a bare field. Meteorology and Atmospheric Physics, 2012; 118(3-4): 143–149.
[11] Yan H, Shi H, Oue H, Zhang C, Xue Z, Cai B, et al. Modeling bulk canopy resistance from climatic variables for predicting hourly evapotranspiration of maize and buckwheat. Meteorology and Atmospheric Physics, 2015; 127(3): 305–312. [12] Mohan S, Arumugam N. Irrigation crop coefficients for
lowland rice. Irrig Drain Syst., 1994; 8(3): 159–176. [13] Tyagi N K, Sharma D K, Luthra S K. Determination of
evapotranspiration and crop coefficients of rice and sunflower with lysimeter. Agric Water Manage, 2000; 45: 41–54.
[14] Seung Hwan Y, Jin-Yong C, Min Won J. Estimation of paddy rice crop coefficients for Penman-Monteith and FAO modified Penman method. ASABE Annual International Meeting, Oregon. 2006.
[15] Attarod P, Aoki M, Komori D, Ishida T, Fukumura K, Boonyawat S, et al. Estimation of crop coefficients and evapotranspiration by meteorological parameters in a rain-fed paddy rice field, cassava and teak plantations in Thailand. J Agric Meteorol, 2006; 62: 93–102.
2: 47–58.
[17] Alberto M C R, Wassmann R, Hirano T, Miyata A, Hatano R, Kumar A, et al. Comparisons of energy balance and evapotranspiration between flooded and aerobic rice fields in the Philippines. Agric Water Manage, 2011; 98(9): 1417–1430.
[18] Moratiel R, Martínez-Cob A. Evapotranspiration and crop coefficients of rice (Oryza sativa L.) under sprinkler irrigation in a semiarid climate determined by the surface renewal method. Irrigation Science, 2013; 1–12.
[19] Vu H S, Watanabe H, Takagi K. Application of FAO-56 for evaluating evapotranspiration in simulation of pollutant runoff from paddy rice field in Japan. Agric Water Manage, 2005; 76 (3): 195–210.
[20] Allen R G, Pereira L S, Raes D, Smith M. Crop evapotranspiration: guidelines for computing crop water requirements. FAO Irrigation and Drainage Paper No. 56. FAO, Rome. 1998.
[21] Research Group on Evapotranspiration. Evapotranspiration from paddy field. J Agric Meteorol, Tokyo, 1967; 4(22): 149–158.
[22] Tomar V S, O’Toole J C. Water use in lowland rice cultivation in Asia: A review of evapotranspiration. Agric Water Management, 1980; 3: 83–106.
[23] Rao A S, Thomas R, Prabha H. Evapotranspiration rates of rice varieties Culture-20 and Pattami-20 in a humid tropical climate. Mausam, 1988; 39(1): 111–112.
[24] Reuss J O. Matching cropping systems to water supply using an integrative model. Water Management Technical Repõrt 62, Water Management Research Project, Colorado State University, Fort Collins, Colorado, USA. 1980.