R E S E A R C H
Open Access
Gene expression patterns that support novel
developmental stress buffering in embryos of the
annual killifish
Austrofundulus limnaeus
Josiah T Wagner
*and Jason E Podrabsky
Abstract
Background:The cellular signaling mechanisms and morphogenic movements involved in axis formation and gastrulation are well conserved between vertebrates. In nearly all described fish, gastrulation and the initial
patterning of the embryonic axis occur concurrently with epiboly. However, annual killifish may be an exception to this norm. Annual killifish inhabit ephemeral ponds in South America and Africa and permanent populations persist by the production of stress-tolerant eggs. Early development of annual killifish is unique among vertebrates because their embryonic blastomeres disperse randomly across the yolk during epiboly and reaggregate several days later to form the embryo proper. In addition, annual killifish are able to arrest embryonic development in one to three stages, known as diapause I, II, and III. Little is known about how the highly conserved developmental signaling mechanisms associated with early vertebrate development may have shifted in order to promote the annual killifish phenotype. One of the most well-characterized and conserved transcription factors, oct4 (Pou5f1), may have a role in maintaining pluripotency. In contrast, BMP-antagonists such as chordin, noggin, and follistatin, have been previously shown to establish dorsal-ventral asymmetry during axis formation. Transcription factors from the SOXB1 group, such as sox2 and sox3, likely work to induce neural specification. Here, we determine the temporal expression of these developmental factors during embryonic development in the annual killifishAustrofundulus limnaeususing quantitative PCR and compare these patterns to other vertebrates.
Results:Partial transcript sequences tooct4,sox2,sox3,chordin,noggin-1,noggin-2, andfollistatinwere cloned, sequenced, and identified inA. limnaeus. We foundoct4,sox3,chordin, andnoggin-1transcripts to likely be maternally inherited. Expression ofsox2,follistatin, andnoggin-2transcripts were highest in stages following a visible embryonic axis.
Conclusions:Our data suggest that embryonic cells acquire their germ layer identity following embryonic blastomere reaggregation inA. limnaeus.This process of cellular differentiation and axis formation may involve similar conserved signaling mechanisms to other vertebrates. We propose that the undifferentiated state is prolonged during blastomere dispersal, thus functioning as a developmental stress buffer prior to the establishment of embryonic asymmetry and positional identity among the embryonic cells.
Keywords:Annual killifish, Diapause, Gastrulation, Axis formation, Gene expression, Spemann-Mangold organizer
* Correspondence:[email protected]
Department of Biology, Portland State University, P.O. Box 751, Portland, OR 97207, USA
Background
The general course of early embryonic development is remarkably conserved between vertebrates, with develop-mental progression always following the same order: fertilization, cleavage, epiboly, gastrulation, axis formation, and organogenesis. Many of the morphogenic movements associated with these processes, such as gastrulation, are also conserved [1]. Barring developmental abnormalities or environmental insult, these stages typically progress in a unidirectional manner and without interruption. How-ever, this is not the case in annual killifish development, which is characterized by a temporal separation of the morphogenic movements of epiboly from formation of the embryonic axis, and discontinuity due to naturally oc-curring periods of arrested development [2-4]. In this study we explore the temporal expression patterns of genes known to play key roles in the maintenance of pluri-potency and the establishment of the vertebrate body plan during early development in embryos of the annual killi-fishAustrofundulus limnaeus.
Austrofundulus limnaeus (Order Cyprinodontiformes,
Family Rivulidae) is an annual killifish found in ephemeral ponds of the Maracaibo Basin in northern Venezuela [5,6]. Similar to other species of annual killifish, A. lim-naeus maintains permanent populations by the produc-tion of drought- and anoxia-tolerant embryos [7-9] that are able to survive in the pond sediments after adult and juvenile fish are killed by habitat desiccation [3,4,10]. Tol-erance of the environmental stresses imposed by their ephemeral environment is supported by the ability of the embryos to enter into a state of metabolic and develop-mental dormancy, termed diapause, at up to three distinct developmental stages [3,4]. Diapause I (DI) may occur in some species of annual killifish during the dispersed blastomere stage prior to formation of an embryonic axis [11], although we do not regularly observe arrest at DI in our lab population of A. limnaeus. Diapause II (DII) can occur midway through development in an embryo that has undergone neurulation and segmentation, but is just prior to initiation of the major phases of organogenesis [4,12]. Diapause III (DIII) can occur in the late pre-hatching embryo. Diapause II embryos display the highest resistance to abiotic stressors such as anoxia, salinity ex-tremes, and desiccation when compared to other develop-mental stages [7,8,13].
In addition to the interruption of development by dia-pause, both the African and South American clades of annual killifish lack formation of a germ-ring or shield structure during epiboly [2,3], which is atypical when compared to other described teleost fish species such as zebrafish (Danio rerio), the medaka (Oryzias latipes), and the mummichog (Fundulus heteroclitus) [14-16] as well as other non-annual killifish in the family Rivulidae such as Kryptolebias marmoratus [17]. Instead of the
typical pattern of convergence and extension of the amoeboid (deep) embryonic blastomeres that is observed in most other teleost embryos during epiboly, deep blas-tomeres from annual killifish exhibit contact inhibition of cell movement [18,19] and migrate away from each other across the yolk surface during epiboly where they remain dispersed across the yolk surface for several days [2]. These dispersed blastomeres later reaggregate, pre-sumably through a delayed process of convergence and extension to form the definitive embryonic axis [2]. Al-though this dispersion and subsequent reaggregation process (D/R) was described several decades ago by Wourms [2], the molecular mechanisms that control these movements remains unexplored and the environ-mental and ecological relevance of this process have only recently been investigated [20,21].
Underlying the gross morphological changes associated with embryogenesis are expression of inter- and intracel-lular signaling factors that encode for celintracel-lular identity and differentiation [22]. As developmental time progresses, embryos generally decrease expression of pluripotency genes in favor of genes that promote differentiation. In mammals, one of the most important factors required to maintain pluripotency in vitro is the co-expression of transcription factors oct4 (also known as Pou5f1) and a member of the SOXB1 family, sox2 [23,24]. The transcrip-tion factor sox3, also a part of the SOXB1 family, likely precedes expression of sox2 during embryonic develop-ment and may have both unique and redundant functions with sox2 depending on the species studied [25-27]. Hom-ologous genes to mammalian oct4, sox2, and sox3 have been described in the zebrafish [28-30], and more recently in the medaka [31,32]. Forming a complex with oct4, SOXB1 family transcription factors have a diverse array of targets during early fish development that are likely critical for normal developmental timing [33]. Whether annual killifish such as A. limnaeus express these pluripotency-promoting genes in a manner similar to other vertebrates is currently unknown. More importantly, the signaling mechanisms by which annual killifish em-bryos are able to transition from an undifferentiated blas-tula through a period of blastomere D/R prior to the formation of the embryo proper remain unexplored.
SMO. The three major contributors to DV patterning through BMP inhibition are noggin, chordin, and follis-tatin. Chordin [36,37] and noggin [38] are potent BMP antagonists, while follistatin [39,40] antagonizes both BMPs and activin. Since the initial characterization of noggin, several noggins have been described [41,42]. The requirement of noggin and chordin expression by the SMO to dorsalize embryos appears to be conserved be-tween amphibians and fish, although follistatin appears be excluded from fish organizers [43-45].
It is currently unknown how blastomere D/R and the entrance into diapause II is regulated at the molecular level in A. limnaeus embryos. Additionally, the changes in expression of important developmental factors that are required to support the differences observed in early annual killifish development when compared to other teleosts are unclear. Although there are no morpho-logical indications of embryonic patterning during epib-oly in A. limnaeus, it has yet to be shown that cellular determination and differentiation does not occur during this period. Therefore, two major hypotheses for axis formation in annual killifish are: (1) cellular determin-ation and differentidetermin-ation occurs during epiboly, similar to other teleosts, and differentiated cells reaggregate later and segregate into germ layers to form an embry-onic axis; or (2) cellular differentiation and therefore embryonic patterning does not occur until after reaggre-gation. The dynamic spatiotemporal expression patterns and cross-species conservation of oct4, sox2, sox3, chor-din,noggin, andfollistatinmake these genes ideal candi-dates for characterization of pluripotency and axis formation in annual killifish.
Recently, we have reported that the D/R phases of development may act to buffer developing embryos from what would otherwise be teratogenic environmen-tal insults [21]. The molecular mechanisms that sup-port this unique buffering capacity remain to be resolved. If dispersed cells lack a unique cellular iden-tity and location within the embryo, then cells lost or damaged during the D/R phase could presumably be replaced without negative consequences to the devel-opmental program. This study describes for the first time the relative mRNA expression levels of genes crit-ical for the maintenance of pluripotency and establish-ment of the embryonic axis across developestablish-ment in A. limnaeus, with the goal of comparing their patterns of expression to the highly conserved patterns noted in other vertebrates. The gene expression patterns reported here in A. limnaeus support a role for an extended period of pluripotency during the D/R phases of annual killifish development. This unique developmental pat-tern coupled with earlier reports of tolerance to cellular damage suggests that D/R can act as a buffering mech-anism that supports normal embryonic development in
the face of what would otherwise be teratogenic levels of cell damage and/or cell death due to environmental stress [21].
Methods
Husbandry of adults and treatment of embryos
Adult and embryonic Austrofundulus limnaeus were
cared for as previously described by Podrabsky [46] and in accordance with approved Portland State University IACUC protocols. Mating pairs of fish were allowed ac-cess to spawning trays containing 1 to 2 cm of 500 μm glass beads (Thomas Scientific, Swedesboro, NJ, USA) for 2 h. Embryos were collected by sifting the glass beads through a 1.5 mm mesh and were transferred into em-bryo medium using a wide-mouthed plastic pipette. Fertilization was determined by the presence of a perivi-telline space using a dissecting scope. Embryos were kept in embryo medium similar to the ionic composition of their native ponds (10 mmol 1−1NaCl, 2.14 mmol 1−1 MgCl2, 0.8 mmol l−1 CaCl2, 0.14 mmol 1−1 KCl,
0.0013 mmol 1−1MgSO4) with 0.0001% methylene blue
added for the first 3 days post fertilization (dpf ) to sup-press fungal growth [5,46]. At 4 dpf, embryos were treated with two 5 min washes of a 0.001% solution of sodium hypochlorite in embryo medium and transferred to embryo medium containing 10 mg l−1gentamicin sul-fate. Embryos sampled earlier than 4 dpf were treated with the bleaching regimen immediately before being flash-frozen as described below. Embryos were observed and embryo medium changed daily. Embryos were incu-bated at 25°C in darkness.
Purification of total RNA from whole embryos and adult livers
Embryos
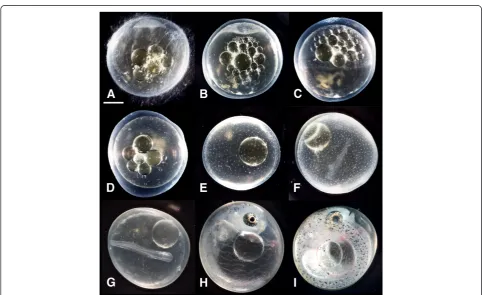
Embryos were observed using a dissecting microscope and sorted by stage as shown in Table 1 and Figure 1. Staged embryos were collected onto a nylon mesh screen (100μm mesh), blotted dry with Kimwipes, transferred into 2 mL microcentrifuge tubes, and flash-frozen by submer-gence in liquid nitrogen. Embryos were stored at −80°C until RNA extraction.
Adult livers
AdultA. limnaeusfemales were euthanized by immersion in ice water for several minutes followed by cervical transection. Livers were removed, transferred into 2 mL microcentrifuge tubes, flash-frozen in liquid nitrogen, and stored at−80°C until RNA extraction.
RNA extraction
Table 1A. limnaeusstages selected for qPCR analysis
Stage Age WSa Abbreviation Description Pooled
individuals
N
Early cleavage 3 hpf 3-5 EC 1-4 blastomeres 100 3
Early hollow blastula
1 dpf 12 EHB Presence of a segmentation cavity containing blastomeres and covered by enveloping layer cells
100 4
50% epiboly 2 dpf 17 50% EP Half of the yolk surface covered by periblast and enveloping layer. In between the two layers are embryonic blastomeres that have become ameboid and migrated away from the central blastula
100 4
Dispersed blastomere phases
4 dpf 20-21 DBP Yolk surface completely covered by periblast, enveloping layer, and randomly distributed embryonic blastomeres
100 4
Reaggregation phases
8 dpf 22-26 RP Embryonic blastomeres remain distributed across yolk, but a subpopulation are beginning to migrate towards a small area of the yolk where the future embryo will form. No discernable embryonic axis present
100 4
Solid neural keel
10 dpf 28 SNK Presence of a solid neural keel, head fold, and Kupffer’s vesicle. No somites present 50 4
Diapause II 32 dpf 33 DII Presence of optic cups and associated lenses, otic vesicles, functional heart, and 38 to 40 pairs of somites. Heart rate of 0 to 10 bpm
100 3
Three-quarter overgrowth
9 dpd 39 3/4 OG Embryo occupies about three-fourths of the perimeter of the yolk. Eyes are heavily pigmented with gold colored material. Presence of incompletely developed gut, liver, and swimbladder
40 4
Diapause III 24 dpd 43 DIII Fully formed larva that has completed embryonic development, but has not yet hatched 40 4
Adult liver Adult N/A Liver Whole liver from an adult female 1 3
a
WS, Wourms’Stage, stages based on [3].
dpd, Days post diapause; dpf, Days post fertilization; hpf, Hours post fertilization.
Figure 1Representative photographs of embryo stages used in this study. (A)Early cleavage,(B)Early hollow blastula,(C)50% epiboly,
in TRIzol reagent at a ratio of 100 mg liver per mL of TRIzol. Immediately after addition of TRIzol, embryos or livers were homogenized using an IKA Ultra-Turrax T8 (Wilmington, NC, USA) at room temperature until lysis was complete. Homogenates were subjected to centrifugation at 10,000 ×g for 30 min at 4°C to re-move cellular debris. Supernatants were transferred into new tubes and 0.2 mL of chloroform per mL of TRIzol was added. Samples were gently mixed by vor-texing and subjected to centrifugation for 20 min at 10,000 ×g at 4°C. The clear aqueous phase was re-moved carefully and transferred into a fresh tube. RNA was precipitated using a high salt method by addition of equal volumes (1.25 mL of each per mL of TRIzol used) of a solution containing 0.8 M sodium citrate and 1.2 M NaCl and 100% isopropanol. Samples were vortexed gently and incubated at −20°C overnight to precipitate the RNA. The following day, samples were subjected to centrifugation at 10,000 ×gfor 30 min at 4°C. Supernatants were decanted carefully so as to not disturb the RNA pellet. The RNA pellet was washed with 1 mL of 60% ethanol (EtOH) followed by centrifu-gation at 10,000 ×g for 30 min at 4°C. Supernatants were decanted and the wash step repeated. After the final wash, EtOH was removed and the pellet was cen-trifuged at 10,000 ×g for 1 min at 4°C to collect re-sidual EtOH. The rere-sidual EtOH was removed and remaining EtOH was allowed to evaporate for 10 to 15 min. RNA pellets were resuspended in 25 to 55μL of 1 mM sodium citrate (pH 6.4). Incubation of sam-ples for 4 to 5 min at 55°C facilitated RNA pellet resus-pension. Sample concentrations and A260/A280 ratios
were determined using the Infinite M200 Pro plate reader equipped with a NanoQuant plate (Tecan, San Jose, CA, USA) using 2 μL of sample and default soft-ware settings (i-control softsoft-ware, Tecan). RNA integ-rity was determined by agarose gel electrophoresis of 0.5μg of total RNA and observing distinct banding for 18S and 28S rRNA subunits. Average A260/A280 ratios
of 1.7 to 2.2 were routinely obtained with the exception of DII embryos, which had low ratios (mean 1.3 ± 0.12 SD) but retained 18S and 28S rRNA banding after gel electrophoresis that was comparable to other stages. Samples were stored at −80°C or used immediately as template for reverse transcription reactions.
Identification and PCR amplification of A. limnaeus RNA transcripts of interest
Austrofundulus limnaeus sequences for genes of interest were amplified from total RNA by polymerase chain re-action (PCR). Total RNA was reverse transcribed using the RevertAid first strand cDNA synthesis kit (Fermentas #K1621). Prior to addition of enzymes, RNA was mixed with primer, heated to 65°C for 5 min, and chilled rapidly
on ice. Reverse transcription (RT) reactions (20 μL total volume) contained RNA (250 to 500 ng), 5μM anchored oligonucleotide dT primer (sequence: 5′TTT TTT TTT TTT TTT TTT TTV N 3′), 1 mM dNTP mix, 20 U Ribo-Lock RNAse inhibitor, 200 U of RevertAid M-MuLV re-verse transcriptase, in 1X RevertAid reaction buffer
(50 mM Tris–HCl pH 8.3, 50 mM KCl, 4 mM MgCl2,
10 mM DTT). Reactions were incubated at 42°C for 60 min and were terminated by incubation at 70°C for 5 min. The single-stranded cDNA was used immediately for PCR or was stored at−20°C.
Prior to PCR amplification, remaining RNA from the RT reaction was degraded by incubation at 65°C for 15 min in 200 mM NaOH and 100 mM EDTA. Follow-ing RNA degradation, pH was neutralized by addition of 1 M Tris (pH = 7.5) to a final concentration of 20 mM. The ssDNA samples were purified using the QIAquick PCR purification kit (Qiagen #28104) according to the manufacturer’s instructions and were eluted in 30μL of nuclease-free dH2O. RNA transcript sequences for genes
of interest from other vertebrates (Additional file 1: Table S1) were identified using NCBI GenBank database searches. Degenerate or specific primers were used de-pending on sequence conservation between species and were created using PrimaClade online software [47]. The PCR parameters were adjusted according to specific pri-mer pairs, and often one or more parameter had to be adjusted in order to cleanly amplify a particular gene of interest. In general, 1 to 5μL of purified cDNA, 5 to 10 pmol of both forward and reverse gene-specific primer (Integrated DNA Technologies), 0.125 UTaqpolymerase
(New England BioLabs #M0267L), and 2.5 μL 10X
ThermoPol buffer (New England BioLabs # M0267L) were used per 25 μL reaction. Reactions were cycled for 37 to 46 cycles with varying melting, annealing, and extension temperatures (Additional file 1: Table S1).
Cloning and sequencing of genes
Vector was mixed with 3 μL of purified PCR product and 3 Weiss units of T4 DNA ligase in 1X rapid ligation buffer. Samples were mixed and incubated overnight at 4°C. The next day, 2 μL of each ligation reaction was added to 20 to 30μL of competentEscherichia colicells (Strain JM109, Promega #L2001, >108 cfu μg−1) in 1.5 mL microcentrifuge tubes. Samples were mixed gen-tly and incubated on ice for 20 min. Cells were trans-formed by heat shock for 50 s in a 42°C water bath and were immediately returned to ice for 2 min. SOC medium (2% Bacto-tryptone, 0.5% yeast extract, 10 mM
NaCl, 0.5 mM KCl, 10 mM MgCl2, 10 mM, MgSO4,
20 mM glucose) was added to each tube of cells (19μL SOC medium per 1 μL of cells) and cells were trans-ferred to sterile 15 mL polypropylene round-bottom culture tubes. Cells were incubated for 1.5 h at 37°C while shaking (150 rpm). Following incubation, 40 to 60μL of the SOC cultures were plated onto agar screening plates (1.5% Bacto-agar, 1% Bacto-tryptone, 42.8 mM NaCl, 33.5 mM KCl, 1 mM CaCl20.02 mg mL−1X-Gal,
0.014 mg mL−1 IPTG, 0.1 mg mL−1 ampicillin sodium salt). Plates were incubated overnight at 37°C. White col-onies were selected using a sterile toothpick and used to inoculate 1 mL of lysogeny broth (1% Bacto-tryptone, 0.5% yeast extract, 171 mM NaCl 0.1 mg mL−1ampicillin sodium salt. Liquid cultures were incubated overnight at 37°C while shaking (200 rpm). The following day, cultures were subjected to centrifugation at 7,000 ×g for 3 min at room temperature to pellet cells. Plasmids were purified from the cell pellet using the QIAprep Spin Miniprep Kit (Qiagen, #27104) according to manufacturer’s instructions and were eluted in 30μL of nuclease-free water. Plasmid quantity was determined by measuring sample absorbance at 260 nm and quality was determined by the observation of A260/A280ratios between 1.8 and 2.0. Purified plasmids
were diluted with nuclease-free water and 500 ng of plas-mid template was mixed with 6.4 pmol of pUC/M13 re-verse primer (sequence 5′-TCA CAC AGG AAA CAG CTA TGA C-3′) in final volumes of 20μL. Plasmids were submitted for Sanger sequencing at the Oregon Health and Science University DNA Services Core (Portland, OR, USA) using an Applied Biosystems 3730xl capillary sequencer. Sequenced plasmids were visualized using FinchTV software (Geospiza, v. 1.4, 2013) and vector sequences were removed to reveal cloned A. limnaeus sequences. Sequence identity was inferred using NCBI blastx (non-redundant protein database) or blastn (nucleotide database) searches for the seven genes of interest (Additional file 2: Table S2 and Additional file 3: Table S3). Partial mRNA sequences forsox3andnoggin-2 were identified during clone screening using primers for sox2 and noggin-1, respectively. Sequences for β-actin and 18S rRNA were also cloned while screening for other genes.
Reverse transcription of total RNA for quantitative PCR
Treatment of RNA and cDNA prior to quantitative PCR (qPCR) was based on previously described methods [49]. RNA samples were treated with DNAse enzyme to degrade possible genomic DNA contaminants. DNAse reactions consisted of 5.5μg of total RNA for each sample, 2 U of RNAse-free DNAse I (New England Bio Labs #M0303S), 40 U of RiboLock RNase inhibitor (Thermo Scientific #EO0381), and 2 mM MgCl2, in a final volume of 16.5μL.
Samples were incubated at 37°C for 10 min followed by in-cubation at 90°C for 5 min. DNAse-treated total RNA (5μg) was reverse transcribed into single-stranded cDNA using 1 μL of iScript advanced reverse transcriptase in 1X iScript advanced reaction mix (Bio-Rad #170-8842) in a final volume of 20μL. The iScript advanced buffer contains both oligo(dT) and random primers. Samples were incubated at 42°C for 30 min followed by reaction termination at 85°C for 5 min. Samples were diluted 1:4 in nuclease-free water and stored at −20°C until use in qPCR.
qPCR primer-probe design and reaction conditions
Primer and probe sequences to be used for qPCR were created using the PrimerQuest tool and purchased from Integrated DNA Technologies (Additional file 4: Table S4) [50]. For probe chemistry we used PrimeTime ZEN Double-Quenched Probes. Probes were 5′ labeled with fluorescein (FAM), internally labeled with a ZEN quencher, and 3′ labeled with an IBFQ quencher [51]. Probes are hydrolyzed by the 5′> 3′exonuclease activity of the DNA polymerase, freeing the quenchers from the FAM dye. The difference in estimated melting temperature (Tm)
Technologies, Santa Clara, CA, USA). Standard curves were generated using 1 × 10⁻³, 1 × 10⁻⁴, 1 × 10⁻⁵, and 1 × 10⁻⁶ copies of synthetic standard. Reactions were initially heated at 95°C for 30 s to activate the DNA polymerase and subsequently thermocycled for 40 cycles by denaturation at 95°C for 30 s and annealing/elongation at 60°C for 30 s. Fluorescence readings (excitation 492 nm, emission 516 nm) were taken at the end of each elongation step. Quantification cycle (Cq) thresholds
were set automatically in Stratagene MxPro software (ver. 4.10, 2007) using adaptive baseline, moving average, and amplification-based threshold settings. Although rarely necessary, thresholds were manually adjusted to improve standard curve best-fit regressions.
Statistics
Fold changes for the genes were calculated relative to one of the SNK (10 dpf ) samples using the efficiency corrected ddCq method [52]. To correct for
between-plate variation, we used the efficiency of the standards run on each plate for the fold-change calculations. As suggested by Bustin and Nolan (2004), Cqvalues within
five cycles of the no template control or the 40th cycle were dropped from analysis to reduce the possibility of false positives [53]. Prior to statistical analysis, relative expression values were normalized relative toβ-actinor 18S rRNA expression and log2transformed. Differences
in relative expression between developmental stages were calculated using one-way Analysis of Variance (ANOVA) followed by Tukey’s multiple comparison test. Statistical significance was determined atP<0.05.
Results and discussion
Identification ofA. limnaeustranscripts
Partial mRNA sequences for A. limnaeus oct4, chordin, sox2,sox3,noggin-1,noggin-2, andfollistatinwere identi-fied using the blastx sequence alignment tool against se-quences in NCBI nucleotide databases for all vertebrates or against only D. rerio (Additional file 3: Table S3 and Additional file 5: Table S5). Putative conserved domains were also identified by sequence similarity using blastx. The oct4 transcript fragment (278 bp) isolated from A.
limnaeus included a POU-superfamily domain from
nucleotide residues 1 to 75 (E = 1.52 × 10⁻³) and a DNA binding domain from nucleotide residues 136 to 276 (E = 1.13 × 10⁻⁴). The A. limnaeus sox2 transcript frag-ment (287 bp) included a SOX transcription factor do-main from nucleotide residues 35 to 286 (E = 1.94 × 10⁻⁸). The transcript fragment forA. limnaeus sox3(295 bp) in-cluded a SOX transcription factor domain from nucleotide residues 53 to 124 (E = 3.02 × 10⁻³) and a SOX-TCF HMG-box, class I domain from nucleotide residues 191 to 295 (E = 1.52 × 10⁻⁶). The isolated A. limnaeus chordin transcript fragment (773 bp) included a CHRD (chordin)
superfamily domain from nucleotide residues 1 to 294 (E = 8.57 × 10⁻⁹) and a von Willebrand factor type C do-main from nucleotide residues 403 to 537 (E = 1.91 × 10⁻⁵). The identified A. limnaeus noggin-1 fragment included a Noggin superfamily domain from nucleotide residues 1 to 483 (E = 1.71 × 10−66) while the noggin-2 fragment included a Noggin superfamily domain from nucleotide residues 1 to 243 (E = 1.72 × 10⁻³⁵). TheA. limnaeus fol-listatin transcript fragment included a Follistatin-like SPARC (secreted protein, acidic, and rich in cysteines) domain from nucleotide residues 71 to 286 (E = 2.31 × 10⁻⁹) and between 521 to 661 (E = 1.20e-09). The follis-tatintranscript also included a Kazal type serine prote-ase inhibitor domain from nucleotide residues 176 to 280 (E = 3.19 × 10⁻⁷) and 362 to 505 (1.2 × 10⁻⁹). Nu-cleotide residues from 41 to 598 were identified as being a part of the high cysteine membrane protein group 4 (E = 7.82 × 10⁻³). For all genes tested, we observed dy-namic expression profiles across development. Add-itionally, we observed high r2 values for the synthetic standards following qPCR (>0.99). We did not observe substantial differences in expression after normalization to either β-actinor 18S rRNA (not shown), and there-fore we present data and focus our discussions on data normalized to expression ofβ-actin mRNA. Expression ofoct4,sox3,sox2,chordin,noggin-1,noggin-2, and fol-listatin was not observed in adult liver samples, and therefore we focus our discussion on embryonic pat-terns of expression.
Expression of pluripotency and neural differentiation regulators inA. limnaeus
oct4
The transcription factor oct4 is widely conserved be-tween vertebrates and is often associated with its ability to maintain pluripotency during development. Homo-logs to mammalian Oct4/Pou5f1 have been described in a wide range of species, including Xenopus, zebrafish, medaka, the goldfishCarassius auratus, and the chicken [30,31,54]. Although the zebrafishoct4gene was initially
known as pou2, the similarity to mammalian Oct4/
development for A. limnaeus. Interestingly, whereas me-daka oct4 may have similar functions to mammalian Oct4 in maintaining pluripotency, zebrafish oct4 may not be necessary for this purpose [54,57]. Localization of oct4 transcripts and protein in A. limnaeus embryos during
development will be necessary to determine if the spatial expression of the transcription factor is similar to other described taxa.
sox2 and sox3
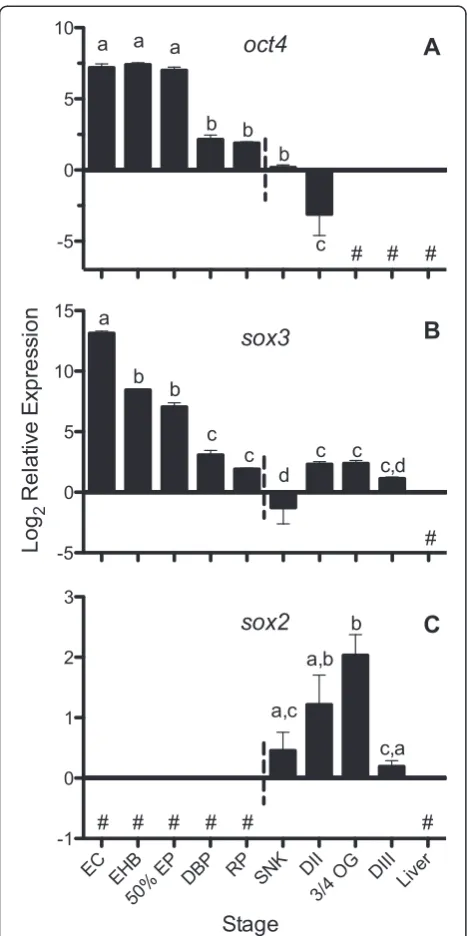
Similar to oct4 transcripts, we detected a high abun-dance ofsox3 transcripts beginning in earlyA. limnaeus development (Figure 2B), which suggests it is maternally inherited. sox3 transcript abundance was high during early cleavage, but expression generally decreased as de-velopment progressed (Figure 1B). In zebrafish, sox3 mRNA expression is detected starting at the 32-cell stage (Figure 3; the earliest stage sampled), suggesting maternal inheritance, and is detectable until 48 hpf (early hatching) [28,60]. We also observed sox3 expression for the entire duration of A. limnaeus embryonic development, but in contrast to zebrafish, we observed the highest expression of sox3 just following fertilization with a significant de-crease in expression during early development leading to lowest expression at the SNK stage (10 dpf ).A. limnaeus sox2transcripts were not detectable prior to reaching the SNK stage and had highest expression between DII and mid-organogenesis 3/4 OG (Figure 2C). In zebrafish,sox2 expression is not observed until 30% epiboly, and is asso-ciated with initiation of gastrulation [28]. Similarly, sox2 expression is not observed prior to epiboly in goldfish, with the first transcripts being detected at 75% epiboly [56]. Expression ofsox2inXenopushas been suggested to be activated bysox3, and thus it is not surprising we ob-served sox3 expression prior to sox2 [26]. In contrast to zebrafish and A. limnaeus, medaka sox2 expression ap-pears to be more transient, although the strongest ex-pression of sox2 is between the early neurula (1 dpf ) and 16 to 19 somites (2 dpf ) stages [32]. The Japanese flounderParalichthys olivaceusalso differs slightly from both zebrafish and medaka in that low expression of sox2 mRNA is first observed in the high blastula and peak expression occurs in the early to mid-gastrula [61]. Although the expression patterns ofsox2 appear to differ across development in these teleosts, they share the pat-tern of increased expression near the beginning of gastru-lation (Figure 3).
SOXB1 genes, includingsox2and sox3, work withoct4 to regulate neural fate and differentiation [62-64]. Ex-pression ofoct4early in development, and simultaneous expression ofsox2andsox3genes at the SNK stage (pre-sumably the time for neural induction) in A. limnaeus suggests that the function of these genes in regulating pluripotency and neurulation are conserved with other vertebrates. Interference with oct4 or sox3 function pro-duces gastrulation defects in Xenopus and zebrafish [55,65], and thus the expression of oct4 and sox3 in A. limnaeus embryos prior to axis formation also suggests a possible conserved role in gastrulation. In contrast to -5
0 5 10
# # #
a a a
b b
b
c
oct4
EC EHB 50% EP
DBP RP SNK DII
3/4 OG DIII Liver
-1 0 1 2 3
# # # # # #
a,c a,b
b
c,a
sox2
-5 0 5 10
15 a
b b
c c
d
c c
c,d
#
sox3
Log
2
Relat
iv
e
E
x
pr
es
s
ion
Stage
A
B
C
the strong upregulation ofsox3at 30% epiboly in zebrafish [27], sox3 is downregulated after 50% epiboly in A. lim-naeus. The developmental consequences of this reversal in sox3 expression during A. limnaeus development are unknown. Future studies that establish the molecular tar-gets and localization ofoct4,sox3, andsox2inA. limnaeus will be important in determining if the roles of these tran-scription factors are indeed similar to other vertebrates.
Expression of DV-patterning genes duringA. limnaeus
embryonic development
Chordin, noggin, and follistatin are potent BMP antagonists that are commonly associated with their role in DV pattern-ing. Gradients of BMP across the developing embryo are established by secretion of these BMP antagonists by the Spemann-Mangold organizer, a structure that forms during gastrulation and whose function in inducing dorsal struc-tures appears to be conserved between vertebrates [35].
chordin
Only one chordin gene has been identified in zebrafish and medaka and its expression is required for correct dorsal structure formation [44,45,66,67]. Expression of chordin is first observed in the late blastoderm of both
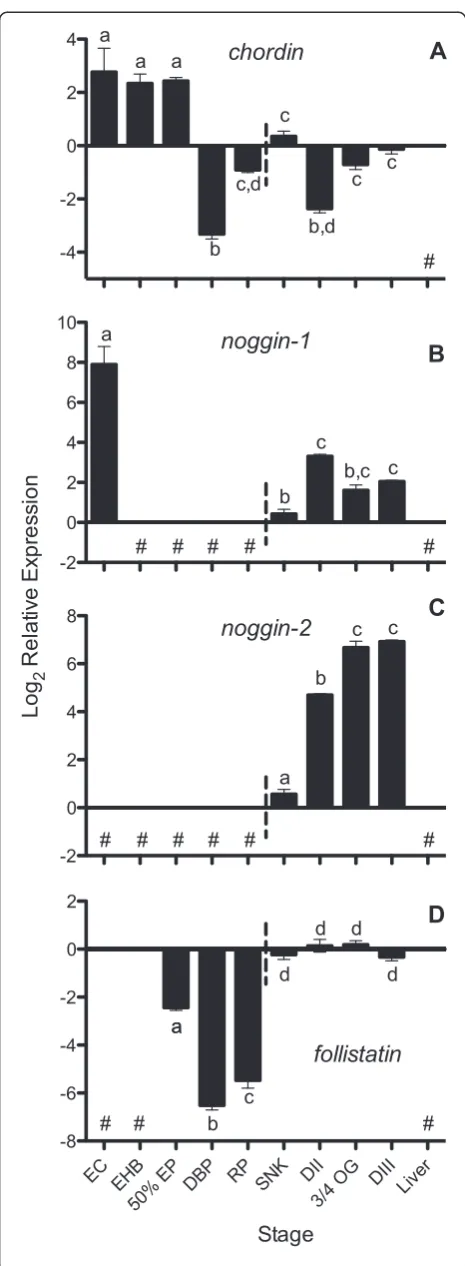
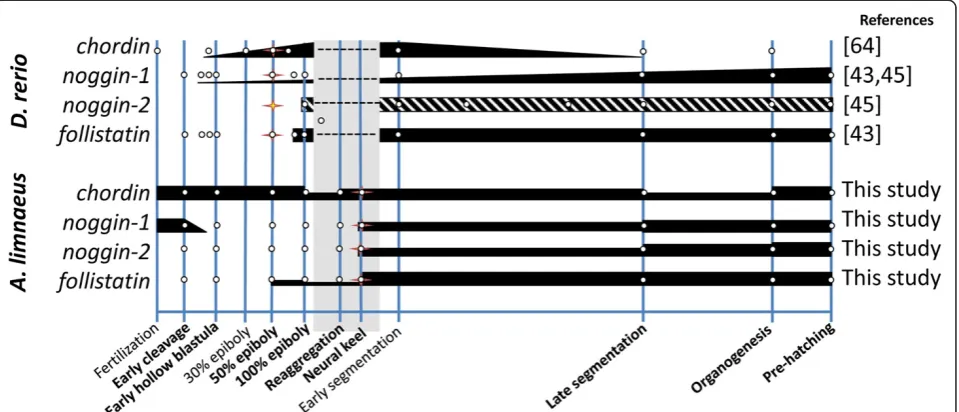
medaka and zebrafish, just prior to epiboly, and tran-scripts appear to be expressed until around the end of somitogenesis for both species. We detected chordin ex-pression throughoutA. limnaeusembryonic development (Figure 4A) with peak expression just after fertilization followed by a sharp drop after the completion of epiboly (4 dpf ). This pattern suggests maternal packaging of the chordin transcript, which appears to be a unique expres-sion pattern, compared to zebrafish (Figure 5), and may indicate a role forchordinexpression in the unique disper-sion and reaggregation phases of development observed in annual killifish.
noggin-1 and noggin-2
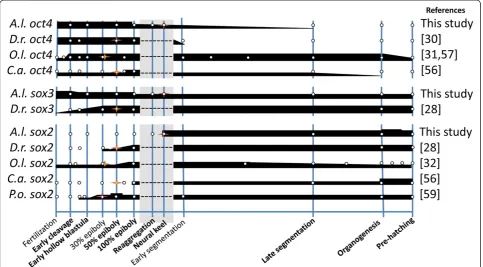
At least three noggin genes have been described in zebra-fish, with expression ofnoggin-1starting at the late blastula stage and noggin-2 appearing at the end of gastrulation [41]. High expression of noggin-1 was observed just after fertilization inA. limnaeus(EC stage), after which expres-sion became undetectable until the SNK stage at 10 dpf (Figure 4B). The constitutive expression of zebrafish nog-gin-1, beginning shortly before gastrulation and continuing for the duration of embryonic development (Figure 5), con-trasts with this expression profile ofA. limnaeus noggin-1 Figure 3Gene expression patterns ofoct4,sox3, andsox2during development inA. limnaeusand other teleost fishes.All data points (white dots) are inferred from available qPCR data. Thickness of the black bars represents relative expression levels within each species. The stage with the first visible evidence of embryogenesis is indicated with a star for all species. Developmental stages that are absent in species other than
A. limnaeusare indicated with a gray box. For data from this study, late segmentation and organogenesis stages would correspond to the DII and
9 dpd stages, respectively. Similar developmental stages were categorized based on previously reported characterizations [14,15,58,59].D.r,Danio
[41,43]. Expression of noggin-2 was first detected at the SNK stage inA. limnaeusin association with the formation of the embryonic axis, similar to zebrafish wherenoggin-2 is first detected in the axial mesoderm at the end of gas-trulation [41]. Expression of noggin-2 continued to in-crease during development reaching peak levels in mid to late organogenesis (3/4 OG) and DIII embryos (Figure 4C). After the SNK stage, expression of bothnoggin-1and nog-gin-2 was observed for the remainder of the embryonic stages, suggesting roles in DV patterning and neural devel-opment similar to other teleosts during these periods of development [41,43,68].
follistatin
While localization studies in zebrafish have determined that chordin and noggin are likely secreted as part of the organizer, follistatin appears to be absent in this structure [43,45].A. limnaeus follistatinexpression is first measur-able at 50% EB and increases dramatically between the late reaggregation and SNK stages of development (8 to 10 dpf ) after which it is expressed constitutively until the end of embryonic development (Figure 4D). This tim-ing of follistatin expression in A. limnaeus is similar to zebrafish (Figure 5) in that high expression of transcripts is not seen until the embryonic axis is visible, suggesting a role outside of the early gastrulation processes [43].
Expression of chordin, noggin-1, and noggin-2 at the first appearance of a visible embryonic axis, suggests that these factors may play a role in DV patterning inA. lim-naeusthat is similar to other described vertebrates, such as zebrafish (Figure 5). However, contrasting to zebrafish embryos, the surprising observation of maternally pack-agedchordinandnoggin-1during early cleavage suggests that these genes may have a unique function during early development in A. limnaeus. Transcript localization and protein expression studies for these genes will be ne-cessary to determine where these genes are expressed during development and may clarify their roles in A.
limnaeusmorphogenesis.
The dispersed blastomere stage may prolong an undifferentiated state that can buffer environmental stress
In zebrafish, previously reported transcript data shows that simultaneous expression ofchordin,noggin-1,noggin-2, -2
0 2 4 6 8 10
# # # # #
a
b
b,c c
c
noggin-1
-4 -2 0 2 4
# a
a a
b c,d
c
b,d
c c
chordin
-2 0 2 4 6 8
a b
c c
# # # # #
noggin-2
#
EC EHB 50% EP
DBP RP SNK DII
3/4 OG DIII Liver
-8 -6 -4 -2 0 2
# # #
a a
b c
d
d d
d
follistatin
Stage
Log
2
R
e
la
ti
ve
Exp
re
ssi
o
n
A
B
C
D
Figure 4Expression of putativechordin(A),noggin-1(B),
noggin-2(C), andfollistatin(D) transcripts duringA. limnaeus
follistatin, andsox2is only observed after commencement of germ layer formation. Similarly, we do not observe sim-ultaneous expression of these five genes until after forma-tion of the solid neural keel when there is a visible embryonic axis (Figures 3 and 5). Cross-species compari-sons ofsox2transcripts also reveal thatsox2expression is generally strongest following gastrulation (Figure 3), simi-lar to our observation of highestsox2expression following axis formation (Figure 2). Taken together, expression pro-files of the genes tested in this study suggest that gastrula-tion and axis formagastrula-tion in A. limnaeusis not completed until late in the reaggregation process or perhaps shortly after (between 8 and 10 dpf ).
Wourms [2] suggested that the dispersed cells might be‘developmentally equivalent’and therefore able to re-place cells that are damaged or destroyed after environ-mental insult. Recently, we have shown thatA. limnaeus embryos irradiated with ultraviolet-C (254 nm) during the dispersed blastomere phases (4 dpf ) suffer a delay in development, but are able to develop normally at doses that cause a high degree of abnormal development in SNK stage embryos [21]. Taken together with the gene expression profiles in this report, these data support the hypothesis that the dispersed cell phase in annual killi-fish can serve to buffer development against potentially teratogenic insults through the prolonged maintenance of pluripotency and the delay of sensitive developmental processes (for example, gastrulation and axis formation) until the environment is favorable for normal development.
The fact that many species of annual killifish can either substantially prolong D/R or enter diapause at this stage in response to environmental stress [3,4,11] suggests a mechanism for embryos to survive prolonged bouts of what would otherwise be lethal or teratogenic environ-mental stress. To our knowledge, this is the first evidence supporting this type of mechanism for dealing with envir-onmental stress during development.
Gene expression during diapause II and implications for the annual killifish life history
In all lineages of annual killifish, the processes of D/R and the ability to arrest development in diapause always co-occur despite the lack of a necessary connection be-tween the two processes. This has led us to hypothesize that the molecular mechanisms that support the two processes may be somehow linked. We observed mRNA expression of oct4, sox3, sox2, chordin, follistatin, nog-gin-1, andnoggin-2 in DII embryos. Perhaps most inter-esting is the high and prolonged expression of chordin for the entire duration of embryonic development in A. limnaeuswhich is in contrast to the pattern observed in zebrafish (Figure 5). While the genes investigated in this study are of central importance to normal development, it is not clear why their expression would be maintained during diapause II. Previous work suggests low rates of protein turnover during diapause II, but the reduction is not complete and some transcripts are very likely trans-lated during dormancy [69]. Presently, it is unclear if Figure 5Gene expression patterns ofchordin,noggin-1,noggin-2, andfollistatinduring development inA. limnaeusand zebrafish.
these seven mRNAs in DII embryos are: (1) actively translated and have a role in maintaining diapause; (2) stabilized in order to support rapid resumption of devel-opment once diapause is terminated; or (3) leftover from pre-DII development. Further studies of the action of these genes before, during, and after diapause II, especially the prolonged expression ofchordin, might lead to inter-esting discoveries on the molecular regulation and evolu-tion of this complex developmental pattern.
Conclusions
The expression of oct4, sox3, sox2, chordin, follistatin,
noggin-1, and noggin-2 are dynamic across embryonic
development in A. limnaeus. Our data suggest that A. limnaeusembryonic cells begin to acquire specific iden-tities after the D/R process is completed and gastrulation commences. The dispersed blastomeres during the D/R stage are very likely pluripotent and lack spatial orienta-tion, and this may benefit the embryos by delaying the sensitive process of gastrulation and axis formation until environmental conditions are favorable. The implications for this work reach far beyond the peculiar developmen-tal patterns of annual killifish, and suggest that even highly conserved developmental pathways that are re-quired for the formation of the basic vertebrate body plan can be altered in response to intense selective pres-sure to generate unique life histories and alter the timing of early development.
Additional files
Additional file 1: Table S1.Degenerate primers for fragment isolation. Additional file 2: Table S2.Isolated and clonedA. limnaeusgene fragments.
Additional file 3: Table S3.Blast results of cloned fragments. Additional file 4: Table S4.qPCR primers and probes. Additional file 5: Table S5.Top blastx searches toD. rerio.
Abbreviations
ANOVA:Analysis of the variance; BMP: Bone morphogenetic protein; EtOH: Ethanol; dpf: Days post fertilization; dpd: Days post diapause; DI: Diapause I; DII: Diapause II; DIII: Diapause III;
D/R: Dispersion-reaggregation; DV: Dorsal-ventral; FAM: Fluorescein; PCR: Polymerase chain reaction; qPCR: Quantitative polymerase chain-reaction; SMO: Spemann-Mangold organizer; EC: Early cleavage; EHB: Early hollow blastula; 50% EP: 50% epiboly; DBP: Dispersed blastomere phases; RP: Reaggregation phases; SNK: Solid neural keel; 3/4 OG: Three-quarters overgrowth.
Competing interests
The authors declare that they have no competing interests.
Authors’contributions
JW participated in the design of the study, carried out the molecular experiments and gene identifications, performed statistical analysis, and drafted the manuscript. JP conceived of the study, participated in the study design, aided in statistical analysis, and helped revise the manuscript. Both authors read and approved the final manuscript.
Acknowledgements
We thank Kim Brown for providing Stratagene Mx3005P thermocycler access. We thank Robert Drewes and colleagues at the California Academy of Sciences for helping obtain the representative embryo photographs. This work was funded by a National Institutes of Health, National Heart, Lung, and Blood Institute grant R01 #HL095454 to JEP.
Received: 11 September 2014 Accepted: 19 December 2014 Published: 21 January 2015
References
1. Solnica-Krezel L. Conserved patterns of cell movements during vertebrate gastrulation. Curr Biol. 2005;15:R213–28.
2. Wourms JP. The developmental biology of annual fish II. Naturally occuring dispersion and reaggregation of blastomeres during the development of annual fish eggs. J Exp Zool. 1972;182:169–200.
3. Wourms JP. Developmental biology of annual fishes I. Stages in the normal development ofAustrofundulus myersiDahl. J Exp Zool. 1972;182:143–68. 4. Wourms JP. The developmental biology of annual fishes III. Pre-embryonic
and embryonic diapause of variable duration in the eggs of annual fishes. J Exp Zool. 1972;182:389–414.
5. Podrabsky JE, Hrbek T, Hand SC. Physical and chemical characteristics of ephemeral pond habitats in the Maracaibo basin and Llanos region of Venezuela. Hydrobiologia. 1998;362:67–78.
6. Hrbek T, Taphorn DC, Thomerson JE. Molecular phylogeny ofAustrofundulus
Myers (Cyprinodontiformes: Rivulidae), with revision of the genus and the description of four new species. Zootaxa. 2005;825:1–39.
7. Podrabsky JE, Carpenter JF, Hand SC. Survival of water stress in annual fish embryos: dehydration avoidance and egg envelope amyloid fibers. Am J Physiol. 2001;280:R123–31.
8. Podrabsky JE, Lopez JP, Fan TWM, Higashi R, Somero GN. Extreme anoxia tolerance in embryos of the annual killifishAustrofundulus limnaeus: Insights from a metabolomics analysis. J Exp Biol. 2007;210:2253–66.
9. Podrabsky JE, Riggs CL, Duerr JM. Anoxia tolerance during vertebrate development - insights from studies on the annual killifishAustrofundulus
limnaeus. In: Padilla P, editor. Anoxia. Rijeka: InTech; 2012. p. 3–24.
10. Myers GS. Annual fishes. Aquarium J. 1952;23:125–41.
11. Genade T, Benedetti M, Terzibasi E, Roncaglia P, Valenzano DR, Cattaneo A, et al. Annual fishes of the genus Nothobranchius as a model system for aging research. Aging Cell. 2005;4:223–33.
12. Podrabsky JE, Hand SC. The bioenergetics of embryonic diapause in an annual killifish. Austrofundulus limnaeus. J Exp Biol. 1999;202:2567–80. 13. Machado BE, Podrabsky JE. Salinity tolerance in diapausing embryos of the
annual killifishAustrofundulus limnaeusis supported by exceptionally low water and ion permeability. J Comp Physiol B. 2007;177:809–20. 14. Iwamatsu T. Stages of normal development in the medaka Oryzias latipes.
Mech Dev. 2004;121:605–18.
15. Kimmel CB, Ballard WW, Kimmel SR, Ullmann B, Schilling TF. Stages of embryonic development of the zebrafish. Dev Dyn. 1995;203:253–310. 16. Armstrong PB, Child JS. Stages in the normal development ofFundulus
heteroclitus. Biol Bull. 1965;128:143–68.
17. Mourabit S, Edenbrow M, Croft DP, Kudoh T. Embryonic development of the self-fertilizing Mangrove KillifishKryptolebias marmoratus. Dev Dyn. 2011;240:1694–704.
18. Lesseps R, Hall M, Murnane MB. Contact inhibition of cell movement in living embryos of an annual fish,Nothobranchius korthausae: its role in the switch from persistent to random cell movement. J Exp Zool. 1979;207:459–70.
19. Lesseps RJ, Lapeyre MV, Hall MV. Tissue culture evidence on the control of the switch from contact inhibition of cell movement to overlapping behavior in annual fish embryos ofNothobranchius korthausae. J Exp Zool. 1979;210:521–8.
20. Berois N, Arezo MJ, Papa NG, Clivio GA. Annual fish: developmental adaptations for an extreme environment. Wiley Interdiscip Rev Dev Biol. 2012;1:595–602.
21. Wagner J, Podrabsky JE. Extreme tolerance and developmental buffering of UV-C induced DNA damage in embryos of the annual killifishAustrofundulus
limnaeus. J Exp Zool. 2015;323:10–30.
23. Yu J, Vodyanik MA, Smuga-Otto K, Antosiewicz-Bourget J, Frane JL, Tian S, et al. Induced pluripotent stem cell lines derived from human somatic cells. Science. 2007;318:1917–20.
24. Masui S, Nakatake Y, Toyooka Y, Shimosato D, Yagi R, Takahashi K, et al. Pluripotency governed by Sox2 via regulation of Oct3/4 expression in mouse embryonic stem cells. Nat Cell Biol. 2007;9:625–35.
25. Kamachi Y, Uchikawa M, Collignon J, Lovell-Badge R, Kondoh H. Involvement of Sox1, 2 and 3 in the early and subsequent molecular events of lens induction. Development. 1998;125:2521–32.
26. Rogers CD, Harafuji N, Archer T, Cunningham DD, Casey ES.Xenopus Sox3
activatessox2andgemininand indirectly repressesXvent2expression to induce neural progenitor formation at the expense of non-neural ectodermal derivatives. Mech Dev. 2009;126:42–55.
27. Wood HB, Episkopou V. Comparative expression of the mouseSox1,Sox2
andSox3genes from pre-gastrulation to early somite stages. Mech Dev. 1999;86:197–201.
28. Okuda Y, Yoda H, Uchikawa M, Furutani-Seiki M, Takeda H, Kondoh H, et al. Comparative genomic and expression analysis of group B1 sox genes in zebrafish indicates their diversification during vertebrate evolution. Dev Dyn. 2006;235:811–25.
29. Reim G, Brand M. Maternal control of vertebrate dorsoventral axis formation and epiboly by the POU domain protein Spg/Pou2/Oct4. Development. 2006;133:2757–70.
30. Takeda H, Matsuzaki T, Oki T, Miyagawa T, Amanuma H. A novel POU domain gene, zebrafish pou2: expression and roles of two alternatively spliced twin products in early development. Genes Dev. 1994;8:45–59. 31. Wang D, Manali D, Wang T, Bhat N, Hong N, Li Z, et al. Identification of
pluripotency genes in the fish medaka. Int J Biol Sci. 2011;7:440–51. 32. Cui J, Shen X, Zhao H, Nagahama Y. Genome-wide analysis of Sox genes in
Medaka (Oryzias latipes) and their expression pattern in embryonic development. Cytogenet Genome Res. 2011;134:283–94.
33. Onichtchouk D, Geier F, Polok B, Messerschmidt DM, Mössner R, Wendik B, et al. Zebrafish Pou5f1-dependent transcriptional networks in temporal control of early development. Mol Syst Biol. 2010;6:354.
34. Hamburger V. The Heritage of Experimental Embryology: Hans Spemann and the Organizer. New York: Oxford University Press; 1988.
35. De Robertis E, Larrain J, Oelgeschläger M, Wessely O. The establishment of Spemann’s organizer and patterning of the vertebrate embryo. Nat Rev Genet. 2000;1:171–81.
36. Piccolo S, Sasai Y, Lu B, De Robertis EM. Dorsoventral patterning in Xenopus: inhibition of ventral signals by direct binding of chordin to BMP-4. Cell. 1996;86:589–98.
37. Sasai Y, Lu B, Steinbeisser H, Geissert D, Gont LK, De Robertis EM. Xenopus
chordin: a novel dorsalizing factor activated by organizer-specific homeobox
genes. Cell. 1994;79:779–90.
38. Smith WC, Harland RM. Expression cloning of noggin, a new dorsalizing factor localized to the Spemann organizer in Xenopus embryos. Cell. 1992;70:829–40.
39. Hemmati-Brivanlou A, Kelly OG, Melton DA. Follistatin, an antagonist of activin, is expressed in the Spemann organizer and displays direct neuralizing activity. Cell. 1994;77:283–95.
40. S-i I, Yamamoto TS. Direct binding of follistatin to a complex of bone-morphogenetic protein and its receptor inhibits ventral and epidermal cell fates in earlyXenopusembryo. Proc Natl Acad Sci. 1998;95:9337–42. 41. Fürthauer M, Thisse B, Thisse C. Three differentnoggingenes antagonize the
activity of bone morphogenetic proteins in the zebrafish embryo. Dev Biol. 1999;214:181–96.
42. Eroshkin FM, Ermakova GV, Bayramov AV, Zaraisky AG. Multiplenogginsin vertebrate genome: cloning and expression ofnoggin2andnoggin4in
Xenopus laevis. Gene Expr Patterns. 2006;6:180–6.
43. Bauer H, Meier A, Hild M, Stachel S, Economides A, Hazelett D, et al. Follistatin and noggin are excluded from the zebrafish organizer. Dev Biol. 1998;204:488–507.
44. Schulte-Merker S, Lee KJ, McMahon AP, Hammerschmidt M. The zebrafish organizer requires chordino. Nature. 1997;387:862–3.
45. Dal-Pra S, Fürthauer M, Van-Celst J, Thisse B, Thisse C. Noggin1 and follistatin-like2 function redundantly to chordin to antagonize BMP activity. Dev Biol. 2006;298:514–26.
46. Podrabsky JE. Husbandry of the annual killifishAustrofundulus limnaeuswith special emphasis on the collection and rearing of embryos. Environ Biol Fish. 1999;54:421–31.
47. Gadberry MD, Malcomber ST, Doust AN, Kellogg EA. Primaclade - a flexible tool to find conserved PCR primers across multiple species. Bioinformatics. 2005;21:1263–4.
48. Sambrook J, Fritsch EF, Maniatis T. Molecular Cloning. A laboratory Manual, 3rd edn. New York: Cold Spring Harbor Press; 1989.
49. Schmittgen TD, Livak KJ. Analyzing real-time PCR data by the comparative CT method. Nat Protoc. 2008;3:1101–8.
50. Primerquest [http://www.idtdna.com/Primerquest/Home/Index] 51. PrimeTime ZEN double-quenched probes
[http://idtdna.com//catalog/pri-metime/zenoverview.pdf]
52. Pfaffl MW. A new mathematical model for relative quantification in real-time RT-PCR. Nucleic Acids Res. 2001;29:e45–e45.
53. Bustin SA, Nolan T. Pitfalls of quantitative real-time reverse-transcription polymerase chain reaction. J Biomol Tech. 2004;15:155-166.
54. Morrison GM, Brickman JM. Conserved roles for Oct4 homologues in maintaining multipotency during early vertebrate development. Development. 2006;133:2011–22.
55. Burgess S, Reim G, Chen W, Hopkins N, Brand M. The zebrafish spiel-ohne-grenzen (spg) gene encodes the POU domain protein Pou2 related to mammalian Oct4 and is essential for formation of the midbrain and hindbrain, and for pre-gastrula morphogenesis. Development. 2002;129:905–16. 56. Marandel L, Labbe C, Bobe J. Do not put all teleosts in one net: focus on
thesox2andpou2genes. Comp Biochem Physiol B Biochem Mol Biol. 2013;164:69–79.
57. Sánchez-Sánchez AV, Camp E, García-España A, Leal‐Tassias A, Mullor JL. Medaka Oct4 is expressed during early embryo development, and in primordial germ cells and adult gonads. Dev Dyn. 2010;239:672–9. 58. Martinez GM, Bolker JA. Embryonic and larval staging of summer flounder
(Paralichthys dentatus). J Morphol. 2003;255:162–76.
59. Tsai H-Y, Chang M, Liu S-C, Abe G, Ota KG. Embryonic development of goldfish (Carassius auratus): a model for the study of evolutionary change in developmental mechanisms by artificial selection. Dev Dyn. 2013;242:1262–83.
60. Zimmerman LB, de Jesús-Escobar JM, Harland RM. The Spemann organizer signal noggin binds and inactivates bone morphogenetic protein 4. Cell. 1996;86:599–606.
61. Gao J, Wang Z, Shao K, Fan L, Yang L, Song H, et al. Identification and characterization of aSox2homolog in the Japanese flounderParalichthys
olivaceus. Gene. 2014;544:165–76.
62. Dee CT, Hirst CS, Shih Y-H, Tripathi VB, Patient RK, Scotting PJ. Sox3 regulates both neural fate and differentiation in the zebrafish ectoderm. Dev Biol. 2008;320:289–301.
63. Archer TC, Jin J, Casey ES. Interaction of Sox1, Sox2, Sox3 and Oct4 during primary neurogenesis. Dev Biol. 2011;350:429–40.
64. Okuda Y, Ogura E, Kondoh H, Kamachi Y. B1 SOX coordinate cell specification with patterning and morphogenesis in the early zebrafish embryo. PLoS Genet. 2010;6:e1000936.
65. Zhang C, Basta T, Hernandez-Lagunas L, Simpson P, Stemple DL, Artinger KB, et al. Repression of nodal expression by maternal B1-type SOXs regulates germ layer formation inXenopusand zebrafish. Dev Biol. 2004;273:23–37. 66. Miller-Bertoglio VE, Fisher S, Sánchez A, Mullins MC, Halpern ME. Differential
regulation ofchordinexpression domains in mutant zebrafish. Dev Biol. 1997;192:537–50.
67. Takashima S, Shimada A, Kobayashi D, Yokoi H, Narita T, Jindo T, et al. Phenotypic analysis of a novel chordin mutant in medaka. Dev Dyn. 2007;236:2298–310.
68. Lamb TM, Knecht AK, Smith WC, Stachel SE, Economides AN, Stahl N, et al. Neural induction by the secreted polypeptide noggin. Science.
1993;262:713–8.
69. Podrabsky JE, Hand SC. Depression of protein synthesis during diapause in embryos of the annual killifishAustrofundulus limnaeus. Physiol Biochem Zool. 2000;73:799–808.
doi:10.1186/2041-9139-6-2
Cite this article as:Wagner and Podrabsky:Gene expression patterns