Big Data Compression Technology Based on Internet of
Vehicles
https://doi.org/10.3991/ijoe.v15i01.9773
Guohua Xiong
Guandong Construction Polytechnic, Guangdong, China [email protected]
Abstract—To ensure the high efficiency of the development of car networking technology, large data compression technology based on car networking was studied. First, RFID technology and vehicle networking, big data technology in vehicle networking, RFID path data compression technology in the Internet of vehicles were introduced. Then, RFID path data compression verification experiments were performed. The results showed that when the data volume was relatively small, there was no obvious change in the compression ratio under the fixed threshold and the threshold change. However, when the amount of data gradually increased, the compression ratio under the condition of changing the threshold was slightly higher than the fixed threshold. Therefore, RFID path big data processing is feasible, and compression technology is efficient.
Keywords—Car networking, big data compression technology, RFID technology
1
Introduction
RFID (Radio Frequency Identification) is a non-contact automatic identification technology realized by radio frequency communication, which can quickly and efficiently read and store object information during motion. Car networking means that the electronic tag loaded on the vehicle is recognized by RFID. On the information network platform, attribute information of all vehicles including static and dynamic information is extracted and utilized. According to different users, the needs of the functions are different. The vehicle's operating conditions and surrounding environment are effectively regulated and integrated services are provided.
intelligent transportation and in-vehicle information services. Using modern information communication integrated technology applications such as vehicle electronic identification, sensors, wireless mobile communications, satellite positioning and mass data processing, all road traffic infrastructure in the network as well as basic attributes, static and dynamic information of the vehicle are collected and identified. Through the network information system, information is intelligently managed and served. It is widely used in energy conservation and emission reduction, logistics and transportation, traffic safety, traffic congestion, transportation services, emergency rescue, intelligent toll, urban management and personal information integrated services.
2
State of the Art
In summary, the above research is mainly aimed at the cleaning of RFID data, storage compression of RFID data, detection of RFID events, clustering analysis of RFID data and frequent pattern mining. However, there is no related research on the integration of car networking technology. Therefore, according to the above research status, the big data compression technology based on car networking is studied. Combined with the characteristics of the RFID path data in car networking, the collected massive path data is compressed and experimentally simulated.
3
Methodology
3.1 RFID technology and car networking
Using GPS and Beidou and other positioning technologies and wireless transmission technologies such as GPRS and 3G, the reader reads the RFID electronic tag information loaded on the vehicle. The running state and driving information of the vehicle are extracted, and parameters useful to the user, such as the driving position of the vehicle, are acquired, and information transmission and sharing are realized. Using RFID technology and sensing technology, the status of transportation infrastructure such as roads and bridges is acquired. Under the support of the Internet information platform, the vehicle's operating conditions are monitored and various traffic integrated information services are provided.
RFID technology is an automatic identification technology based on wireless communication. The reader in the RFID system uses the radio signal to communicate with the electronic tag, acquires the tag information and provides it to the subsequent processing system, and completes the task of automatically identifying and controlling the reading and writing of the data.
As the data carrier of the radio frequency identification system, the electronic tag is mainly composed of a tag antenna and a tag-dedicated chip. According to different electronic tag power supply methods, it can be divided into three types: active electronic tags, passive electronic tags and semi-passive electronic tags. The internal battery is equipped with an active electronic tag, the battery without a built-in battery is a passive electronic tag, and the part that relies on the battery is a semi-passive electronic tag. According to different frequencies, electronic tags can be divided into four categories: low frequency, high frequency, ultra-high frequency and microwave electronic tags.
transportation efficiency has increased by about 70%. The capacity of existing road networks has been increased by 2-3 times. It can not only improve production and living efficiency, reduce operating costs, but also make full use of social public resources, so that the government's management funds are greatly reduced.
Radio frequency identification technology can quickly and accurately identify high-speed moving targets. Compared with traditional traffic information collection technology, radio frequency identification technology has unparalleled advantages, which has become the main means of future traffic information collection and supervision. Its wide application in traffic management has finally become the development trend of intelligent transportation in the future.
3.2 Big data technology for car networking
The data platform support system is responsible for storing and processing the vast amounts of data generated by on-grid vehicles and facilities. At the same time, other service-based data is integrated, which provides support for intelligent traffic management and in-vehicle information services. Cloud computing technology will be one of the important supporting technologies for data platform support systems. The Traffic Management Center has an extensive database and data analysis capabilities to store and analyze data transmitted from roadside facility systems. The corresponding control command is sent according to the analysis result.
The platform support mainly provides technical support for the upper service entities in the car networking system. It mainly includes cloud search with intelligent semantic analysis, rapid collection and release of information, storage of massive geographic information, manual processing based on the combination of web crawling technology and Geocoding, and automatic updating of data by computer and establishment of publishing system. Using user behavior data, the data warehouse is built and user behavior motives are analyzed. The platform combines current traffic conditions with historical data, seamlessly links pedestrian navigation and car navigation, and further develops dynamic navigation based on real-time traffic. In the car networking technology white paper, the car networking system is divided into six parts according to the technical system, as shown in Figure 1. The massive data processing in the platform is mainly the preprocessing, storage and data analysis of related data such as vehicles and road conditions.
Data preprocessing: Since information acquisition and transmission may cause errors, the cloud platform system first needs to perform data preprocessing after receiving the number, including data deduplication, filtering, and calibration. Many car networking typical applications have real-time processing features. The car networking platform should support the real-time processing and decision making of massive amounts of data that is continuously input in the form of a stream.
queried, and an overall storage scheme combining hardware and software is established.
Data analysis: The analysis and mining of massive data requires the establishment of a corresponding data mining and analysis platform to support the drilling and statistical analysis of different dimensions of the data. It also provides support for domain-specific analysis needs such as traffic flow forecasting, travel time estimation, mobile trajectory analysis, and geographic correlation analysis. Car networking technology system is shown in Figure 1.
Fig. 1. Car networking technology system
3.3 The generation and characteristics of RFID path data
RFID systems generally consist of three main parts: an electronic tag, a reader, and an antenna. When the system works, the reader first sends the command signal to the electronic tag via the antenna. Then, after the tag is responded, the information stored inside the tag is backscattered to the antenna, and the antenna receives the returned information and hands it to the reader for identification operation. Finally, the result of the identification is passed to the computer system, and the recognition process is completed. The composition of the RFID system is shown in Figure 2.
Fig. 2. Schematic diagram of RFID system Platform
Auxiliary
High efficiency Intelligence Development
Safety guarantee
Motor vehicles drive into the radio frequency signal
area
The electronic tag obtains the induced current,
energy activation
Authentication between the electronic label and
the card reader
The electronic label sends the information inside the label to the card reader The card reader sends the
information / data transfer server The command center gets
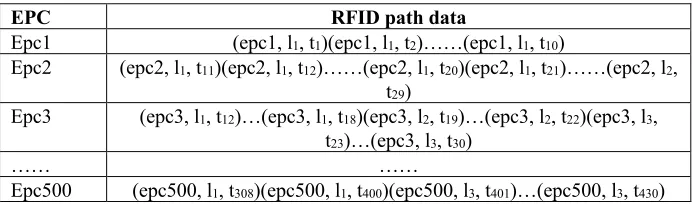
When the electronic tag is sensed by the RFID reader, a data set of the type <EPC, Location, Time> is generated, as shown in Table 1. Among them, EPC (Electronic Product Code) represents the electronic product code, which is unique. Location indicates the location of the object as it is scanned by the reader. Time indicates the time of the tuple, which is the scan time of the reader.
Table 1. Original RFID path data set
EPC RFID path data
Epc1 (epc1, l1, t1)(epc1, l1, t2)……(epc1, l1, t10)
Epc2 (epc2, l1, t11)(epc2, l1, t12)……(epc2, l1, t20)(epc2, l1, t21)……(epc2, l2, t29)
Epc3 (epc3, l1, t12)…(epc3, l1, t18)(epc3, l2, t19)…(epc3, l2, t22)(epc3, l3, t23)…(epc3, l3, t30)
…… ……
Epc500 (epc500, l1, t308)(epc500, l1, t400)(epc500, l3, t401)…(epc500, l3, t430)
After observing the data in Table 1, it is seen that the RFID path is time dependent. Each location is accompanied by a time message. There have been more in-depth studies on common data sets. However, there is a certain difference between the RFID path data and the ordinary data, which is suitable for the research method of the common path. In general, it is not fully applicable to RFID path data.
The following are the characteristics of the RFID path data:
Massive: In the commercial sector, the flow of goods is frequent. The information of the object is collected by the reader, and the amount of data generated is very large.
Redundancy: Redundancy is more evident in RFID data. The reason for this is that the RF signal is constantly being sent by the reader. However, the coverage of the RF signal may overlap, and both spatial and temporal redundancy may occur.
Continuity: In the RFID application environment, a large number of tags often send information to the reader constantly, which enables the continuously transmitted data to be transmitted to the server in a certain time sequence, thereby forming a data stream with continuous nature. In some cases, data needs to be processed in a timely manner.
Dispersion: RFID is used in logistics management because the circulation of goods is very wide. For example, clothes produced in China can be sold to Europe, so RFID data is scattered in different places.
3.4 Preprocessing of RFID data
RFID data is exploding after the widespread adoption of radio frequency identification technology. How to store these massive data and save storage space, while meeting various query requirements, has prompted RFID data storage and management issues to become a research hotspot. In the practical application of car networking RFID, a large amount of path information is generated at any time. For example, a reader is installed at the intersection of the main street, and relevant RFID path data is generated at regular intervals. If the data is not preprocessed, the amount of data used for data mining and data compression is very large. The path data is processed from both geographic location and time information to improve the efficiency and accuracy of data compression.
The reader installed at the intersection will continuously scan the electronic tags in the range. If a car stays in a certain place for a longer period, the RFID system will generate more data tuples in the form of EPC, Location, and Time. The geographic location between these tuples is the same. These duplicate data are called redundant data. These redundant data need to be processed, and the original data shown in Table 1 can be converted into a static record of a shape (such as EPC, Location, Time_In, Timeout).
3.5 RFID path big data compression in car networking
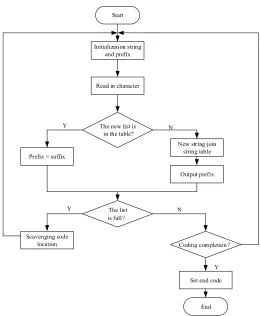
According to reversibility, data compression is divided into two types: lossy compression and lossless compression. Based on the typical lossless compression algorithm LZW, it is improved and verified. Lossless compression refers to the removal of redundant information in the source, but it does not affect the information entropy. When decompressed, the compressed data can be fully recovered. The LZW compression algorithm was jointly proposed by Lemple-Ziv-Welch, which was formed on the basis of the classical compression algorithm LZ78. It is a practical algorithm. Figure 3 is a flow chart of the LZW algorithm.
LZW is a dictionary model compression algorithm. The initialization of the dictionary string table is to take advantage of all possible characters. During compression, if the current string has appeared in the dictionary table, the next character is read and added to the current string. Next, it is determined whether the matching character has appeared in the dictionary, and continues according to this method. Conversely, if the current string does not appear, the current string is added to the dictionary and the dictionary index of the largest matching string is output. In the same way, when the file is decompressed, as long as the dictionary string table synchronized with the compression process is maintained, the dictionary is restored, thereby realizing the decompression of the file.
Fig. 3. Flow chart of LZW algorithm
Therefore, the longer the term in the dictionary, the higher the compression ratio will be. Therefore, increasing the storage capacity of the dictionary can effectively increase the compression ratio. However, the size of the dictionary is affected by the memory of the computer. In order to realize the storage function of RFID path data, a compression algorithm based on LZW is proposed, which is further improved to make it suitable for compression of RFID tag data.
The improved process of the LZW encoding algorithm is as follows:
Step1: The dictionary is initialized to a single character that may appear, and the current prefix P is initialized to be empty, so that the threshold is 1;
Step2: The current character C:= the next character in the character stream;
Step3: Is P+C in the dictionary?
If "yes", extend P with C, that is, let P:=P+C;
If "No", the code word W corresponding to the current prefix P is output; P+C is added to the dictionary; let P:=C;
Step4: Is the dictionary filled?
Initialization string and prefix
Read in character
The new list is in the table?
Prefix = suffix
New string join string table
Output prefix
The list is full?
Scavenging code
location Coding completion?
Set end code
End Start
Y N
Y N
If "yes", the compression ratio is calculated. If the compression ratio is greater than the threshold, the threshold = compression ratio is first used to continue compression; if the compression ratio is less than the threshold, the dictionary excess entries are deleted;
If "No", return to step 2.
The traditional LZW algorithm empties and rebuilds the dictionary when it is full. This results in a low compression efficiency at the beginning of each reconstruction. The threshold determination method will be improved to improve the dictionary compression ratio. When the dictionary is filled, a length of bit stream is tested. The test data stream is compressed using an existing dictionary, and the compression ratio of the data stream is obtained after compression. The formula of the compression ratio is expressed as:
(1) By comparing with the specified threshold, when the compression ratio is greater than the threshold, the dictionary is used to compress and judge the remaining characters. When the resulting compression ratio is less than the threshold, the extra entries in the dictionary are deleted. According to a specific application environment, the improvement of the threshold judgment operation method is that the initial threshold is set to a fixed value of 1, and then the threshold is judged. If the compression rate of the data stream is less than the threshold, the extra entries in the dictionary are deleted. If it is greater than the threshold, the new threshold is set to the compression ratio obtained by the test, and then the operation of the threshold judgment is continued. A threshold that is too large will remove the entry. If the operation of updating the dictionary is too frequent, the compression efficiency is lowered. If the threshold is too small, the dictionary will not be updated in time, which will still reduce the efficiency of compression. The improved threshold determination method will be more flexible. The dictionary is updated as needed, which increases the compression ratio and also reduces the time.
4
Result Analysis and Discussion
4.1 Experimental environment and experimental data set
Experimental hardware environment: Intel (R) Core (TM) i32. 4GHz CPU, 4GB of memory. Experimental software environment: Microsoft Windows 7. The experimental algorithm is implemented in Microsoft Visual C++ 6.0 programming software.
The experimental data is the analog data generated by the RFID data generator. There are three main parts: the EPC unique identification code, time information and geographic location. The experimental data format is shown in Table 2.
Table 2. Format of experimental data
EPC code Time information Number of geographical locations
Epc1 2016-10-05 17:59 Lbbb
Epc2 2016-10-05 18:05 L07e
Epc3 2016-10-05 18:11 L042
Epc4 2016-10-05 18:18 Lbbb
Epc5 2016-10-05 18:26 L041
Epc6 2016-10-05 18:30 L061
Epc7 2016-10-05 18:37 L136
Epc8 2016-10-05 18:38 L277
Epc9 2016-10-05 18:48 L1b9
Epc10 2016-10-05 18:54 L00c
Epc11 2016-10-05 19:01 L041
Epc12 2016-10-05 19:10 L277
4.2 Verification of MBPrime encoding method
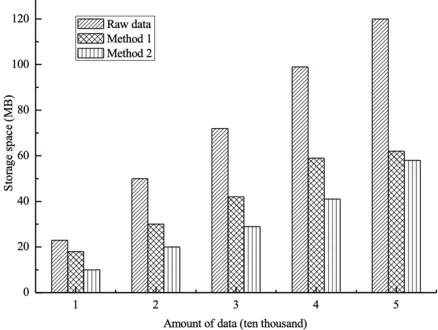
When the amount of data is increased from 10,000 to 50,000, the storage method based on prime number coding (method 1) and the MBPrime code storage method (method 2) (without considering non-path attributes) in the traditional data management method are compared from two aspects respectively. The big data compression effect and the corresponding time of the data query are shown in Figure 4.
Fig. 4. Block diagram of the hardware of the control system
PrimeLabel encoding method. It can be seen that the RFID location information will have a good effect when encoded by the MBPrime method.
The following is a comparison of query performance in three storage scenarios. The experiment performs object tracking query on RFID path data, which is a typical object tracking query. The motion path of the specified object of the EPC code is found, as shown in Figure 5.
Fig. 5. Response time of object tracking query
As can be seen from Figure 5, it takes a long time to track the object on the original data set. In particular, more and more time is required as the amount of data increases. The prime coded storage model is compared to the MBPrime coded storage model. When the amount of data is small, the query performance is small. As the amount of data increases, the time of prime coding increases faster than the time of the MBPrime coded storage model.
4.3 Verification of R-LZW compression algorithm
The experimental data is 100,000 preprocessed path data sets to verify the efficiency of the improved algorithm. Several commonly used compression algorithms are used to compress it. Then, it is compared with the performance of the R-LZW compression algorithm. The compression ratio and the time consumed by compression are the main comparison criteria. Table 3 compares the performance of each algorithm.
Table 3. Comparison of performance of each algorithm
Algorithm Compression ratio (%) Time consumption (S)
LZ77 39 4.2
LZ78 49 4
LZW 59 3
From the experimental results in Table 3, the improved R-LZW algorithm has a higher compression ratio than the LZ77, LZ78, and LZW compression algorithms. Compression takes less time than several other common compression algorithms. From the original LZ77 algorithm to the final improved R-LZW algorithm, the compression ratio increased by 28%. Therefore, it is found from this experiment that the improved algorithm is more suitable for compressing RFID path data. It not only increases the space storage rate of RFID tags, but also shortens the compression time.
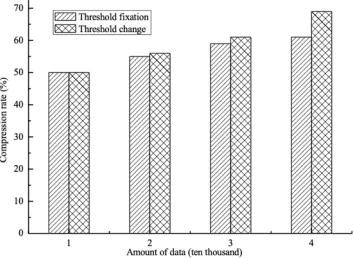
The second experiment will verify the threshold judgment method in the R-LZW algorithm. Four data sets are used, namely 1×10⁴, 2×10⁴, 3×10⁴, 4×10⁴. The data set was experimentally verified using two different threshold judgment methods. The results are shown in Figure 6.
Fig. 6. Comparison of different threshold judgment methods
When the amount of data is relatively small, there is no significant change in the compression ratio between the threshold and the threshold change. However, when the amount of data is gradually increased, the compression rate in the case where the threshold is changed is slightly higher than the fixed threshold. The experimental results demonstrate the feasibility of this method for RFID path data processing and the efficiency of compression.
5
Conclusion
6
References
[1]Kim, D. H., Choi, K. H., Li, K. J., Lee, Y. S. (2015). Performance of vehicle speed estimation using wireless sensor networks: a region-based approach. Journal of Supercomputing, 71(6): 2101-2120 https://doi.org/10.1007/s11227-014-1306-7
[2]Grishentsev, A. Y., Korobeynikov, A. G., Korikov, C. C., Velichko, E. N. (2016). Method for compression of optical observation data based on analysis of differential structure. Optical Memory & Neural Networks, 25(1): 32-39 https://doi.org/10.310 3/S1060992X16010045
[3]Heo, G., & Jeon, J. (2017). A study on the data compression technology-based intelligent data acquisition (idaq) system for structural health monitoring of civil structures. Sensors, 17(7): 1620 https://doi.org/10.3390/s17071620
[4]He, W., Yan, G., Da Xu, L. (2014). Developing vehicular data cloud services in the IoT environment. IEEE Transactions on Industrial Informatics, 10(2): 1587-1595
https://doi.org/10.1109/TII.2014.2299233
[5]Amadeo, M., Campolo, C., Molinaro, A. (2016). Information-centric networking for connected vehicles: a survey and future perspectives. IEEE Communications Magazine, 54(2): 98-104 https://doi.org/10.1109/MCOM.2016.7402268
[6]Chen, M., Zhang, Y., Hu, L., Taleb, T., Sheng, Z. (2015). Cloud-based wireless network: Virtualized, reconfigurable, smart wireless network to enable 5G technologies. Mobile Networks and Applications, 20(6): 704-712 https://doi.org/10.1007/s11036-015-0590-7
[7]Checko, A., Christiansen, H. L., Yan, Y., Scolari, L., Kardaras, G., Berger, M. S., & Dittmann, L. (2015). Cloud RAN for mobile networks—A technology overview. IEEE Communications surveys & tutorials, 17(1): 405-426 https://doi.org/10.1109/CO MST.2014.2355255
[8]Da, Xu, L., He, W., Li, S. (2014). Internet of things in industries: A survey. IEEE Transactions on industrial informatics, 10(4): 2233-2243 https://doi.org/10.1109/ TII.2014.2300753
7
Author
Guohua Xiong is a Researcher of Guandong Construction Polytechnic, Guangdong, China. His research interests include Car Networking.