R E S E A R C H
Open Access
Pleiotropic effects of a single gene on skeletal
development and sensory system patterning in
sticklebacks
Margaret G Mills
1,2, Anna K Greenwood
1and Catherine L Peichel
1*Abstract
Background:Adaptation to a new environment can be facilitated by co-inheritance of a suite of phenotypes that are all advantageous in the new habitat. Although experimental evidence demonstrates that multiple phenotypes often map to the same genomic regions, it is challenging to determine whether phenotypes are associated due to pleiotropic effects of a single gene or to multiple tightly linked genes. In the threespine stickleback fish (Gasterosteus aculeatus), multiple phenotypes are associated with a genomic region around the geneEctodysplasin(Eda), but only the presence of bony lateral plates has been conclusively shown to be caused byEda.
Results:Here, we ask whether pleiotropy or linkage is responsible for the association between lateral plates and the distribution of the neuromasts of the lateral line. We first identify a strong correlation between plate appearance and changes in the spatial distribution of neuromasts through development. We then use anEda transgene to induce the formation of ectopic plates in low plated fish, which also results in alterations to
neuromast distribution. Our results also show that other loci may modify the effects ofEdaon plate formation and neuromast distribution.
Conclusions:Together, these results demonstrate thatEdahas pleiotropic effects on at least two phenotypes, highlighting the role of pleiotropy in the genetic basis of adaptation.
Keywords:Pleiotropy, Genetics of adaptation, Lateral line, Neuromast, Dermal skeleton
Background
Adaptation to a new environment often requires changes in numerous phenotypic traits [1-3]. Mechanisms that lead to the co-inheritance of suites of phenotypes might therefore facilitate adaptation [4-6]. Indeed, in many cases of adaptation to divergent habitats, experimental evidence demonstrates that multiple phenotypic traits map to the same genomic regions [7-15]. However, whether pheno-types that co-vary are caused by allelic variation in the same gene (that is, pleiotropy) or in tightly linked genes is only known in a handful of cases because identification and experimental manipulation of the gene(s) are required [16-23]. The extensive phenotypic diversification of three-spine stickleback fish (Gasterosteus aculeatus) in fresh-water habitats provides a tractable system to address this
question [24]. Marine and freshwater sticklebacks from independently derived populations have diverged in a suite of physiological, morphological and behavioral traits [25,26]. Many phenotypic traits and measures of fitness that differ between stickleback populations have been linked to a single genomic region surrounding the Ectodysplasingene (Eda) on chromosome 4 [27-38]. How-ever, only a single trait - bony lateral plates - has actually been demonstrated to be controlled byEda[39].
Here, we ask whether pleiotropy or linkage is respon-sible for the correlation between lateral plate presence and another trait: the distribution of the neuromasts of the lateral line [38]. The lateral line sensory system in aquatic vertebrates detects water motion and has been shown to play a role in schooling, predator avoidance, prey capture, and other behaviors [40-45]. The lateral line system comprises clusters of sensory hair cells called neuromasts, which are arranged in distinct lines on the body and head. Threespine sticklebacks possess twelve * Correspondence:[email protected]
1
Divisions of Human Biology and Basic Sciences, Fred Hutchinson Cancer Research Center, 1100 Fairview Avenue North, Seattle 98109, WA, USA Full list of author information is available at the end of the article
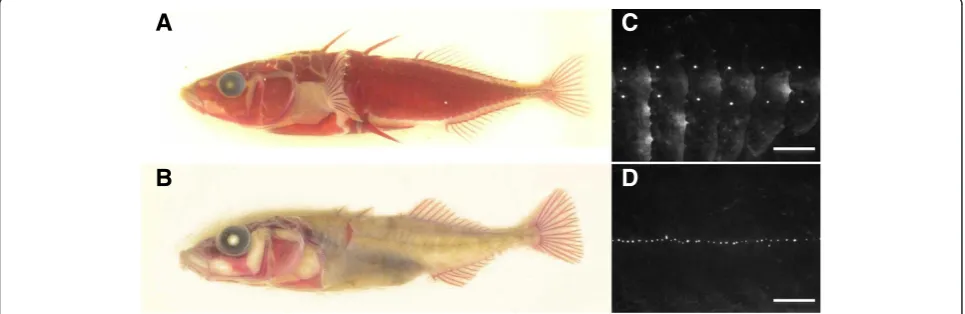
lines of superficial neuromasts: nine on the head, two on the trunk, and one at the base of the caudal fin [46]. The number of neuromasts in each line varies in sticklebacks from different habitats in parallel with the environment [46], suggesting that the differences among populations might be adaptive. Lateral line variation across stickleback populations is particularly striking in the lines along the trunk, both in the number of neuromasts and in the distribution of those neuromasts. Specifically, variation in neuromast distribution is correlated with the presence of bony lateral plates (Figure 1) [46], a trait that varies con-sistently and predictably in marine versus freshwater environments [47-49]. Neuromasts on the trunk of stick-lebacks can be separated into two anatomical regions [46]: those located in body segments anterior to the second dorsal spine are considered ‘Ma’ (main trunk line, anter-ior) and those located in body segments posterior to this boundary are called ‘Mp’ (main trunk line, posterior; Figure 2D). Marine sticklebacks, like those from the Pacific Ocean in Japan (‘JP’) or Manchester Clam Bay in Washington State, USA (‘MC’), have a complete set of bony plates along their entire flank, in body segments coincident with both Ma and Mp (Figure 1). They typic-ally have a vertical line of neuromasts, with pairs of neu-romasts (one dorsal and one ventral to the midline; hereafter called a‘dorso-ventral’distribution) on each of the plates coincident with Mp and clusters of multiple vertically arranged neuromasts on each of the plates co-incident with Ma [38,46]. Most freshwater populations also have bony plates in the region of the Ma line, and these plates possess a dorso-ventral distribution of neu-romasts. However, most freshwater sticklebacks are low plated; that is, they have no bony plates in the region of
the Mp line, and each body segment in this region has a single neuromast that is located along the midline [46]. Several freshwater populations, including benthic stick-lebacks from Paxton Lake in British Columbia, Canada (‘PB’), exhibit striking reduction in plate number, with very few plates in the region of the Ma line in addition to a complete lack of plates in the region of the Mp line. The neuromasts in both the Ma and Mp lines are found in a nearly continuous row along the midline (Figure 1), although there are a few neuromasts dorsal to the midline in the Ma line even in the absence of plates (Figure 3A). These fish also exhibit extra trunk neuromasts, with up to five neuromasts per body segment [38,46].
Our previous quantitative trait locus (QTL) mapping study of variation in the lateral line between JP and PB sticklebacks uncovered tight genetic linkage between neuromast distribution and lateral plate presence in the Mp line [38]. The presence of plates in the Mp region was strongly associated with a dorso-ventral distribution of neuromasts in F2 hybrids, and both the number of plates and neuromast distribution in the region of Mp (but not Ma) mapped to a region of chromosome 4 con-taining the gene Eda. This gene was previously shown to be responsible for the difference in plate number between complete and low plated sticklebacks [39]. We focus here on dissecting the developmental and genetic relationship betweenEda, lateral plates, and neuromast distribution in the Mp line.
Methods Fish care
All animal protocols were approved by the Fred Hutchinson Cancer Research Center Institutional Care
A
B
D
C
and Use Committee (protocol #1575). All sticklebacks were lab reared from in vitrocrosses of fish from previ-ously studied populations [38,46]: marine sticklebacks from Manchester Clam Bay, Washington, USA (‘MC’) and from the Pacific Ocean, Akkeshi, Japan (‘JP’); and benthic sticklebacks from Paxton Lake, British Columbia, Canada (‘PB’). Fish were housed in 29-gallon glass aquaria with in-dependent filtration and air stone aeration. Water in each
tank contained 3.5 g/L Instant Ocean salts (Instant Ocean, Cincinnati, OH, USA) and 0.4 g/L NaHCO3. The fish were
kept at summer conditions of 15.5°C on a 16 h light/8 h dark cycle. Eggs and fry were contained in net breeders suspended from the side of the tank until 2 weeks after hatching. Young fish were fed brine shrimp nauplii twice daily, and adults were fed brine shrimp nauplii and frozen Mysis shrimp.
J
head tail
Ma Mp
SL Plates
6.5 7.5 8.0 11.2 14.3 17.8 15.6 19.0 18.6 17.1 19.1 18.3 18.8 20.0 20.0 22.3 19.9 20.4 21.3 20.9 21.6 22.2 22.9 23.2 23.7 24.3 24.6 25.3 25.6 27.1 27.9
0 0 0 0 3 8 9 9 13 16 17 18 18 18 19 19 22 23 23 25 26 33 33 33 33 33 33 33 33 33 33
no neuromasts Plate present
Midline neuro-masts only Vertical line of neuromasts
G E
H F
I
D 16.8 mm
C 14.2 mm
B 12.5 mm
A 11.0 mm
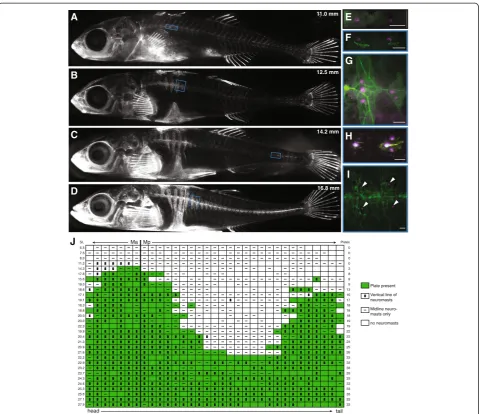
Figure 2Bony plates and neuromast distribution are correlated through development in completely plated fish. (A-D)Bone
Imaging of plates and neuromasts
To visualize neuromasts, live fish were placed in 0.025% 2-(4-(dimethylamino)styryl)-N-ethylpyridinium iodide (DAS-PEI; Invitrogen/Molecular Probes, Carlsbad, CA, USA) in zebrafish embryo medium (1 mM MgSO4, 120 μM
KH2PO4, 74μM Na2HPO4, 1 mM CaCl2, 500μM KCl,
15μM NaCl, 500 μM NaHCO3) for 15 minutes, rinsed
with clean embryo medium, then anesthetized with
fresh 0.013% MS-222 (Tricaine methanesulfonate; Argent Chemical Laboratories, Redmond, WA, USA) in embryo medium, adjusted to pH 7.2 with NaOH (Fisher Scientific, Pittsburgh, PA, USA). To visualize calcified bone, live fish were placed in 0.2% calcein (Sigma-Aldrich, St. Louis, MO, USA) in embryo medium for 10 minutes, washed twice with clean embryo medium, then anesthetized as after DASPEI staining. For double staining with calcein
E D C B A
34 mm 36 mm 37 mm 31 mm
and DASPEI, fish were stained first with calcein, returned to their tanks, and then stained with DASPEI one to two days later. Staining with both calcein and DASPEI was visualized using fluorescence microscopy (see below).
To describe the developmental processes by which the adult lateral line pattern is produced in completely plated populations, we followed clutches of marine (JP and MC) fish through development. We first used repeated calcein staining in JP fish to visualize calcified bone, which allowed us to characterize patterns of plate formation in individ-uals. Fish used for repeated imaging were kept in individual plastic cups starting at one week post hatching, in 100 ml of zebrafish embryo medium that was changed daily. For approximately two months they were stained once a week with calcein, lightly anesthetized, photographed under the microscope, and returned to their cups.
Unfortunately, we could not perform repeated DASPEI staining to visualize neuromasts on the same individuals because this leads to a loss of reliable neuromast stain-ing over time (MM, personal observation). Thus, we also stained an additional set of fish at a range of sizes after hatching; each individual fish was simultaneously stained with DASPEI and calcein, and then not stained again. Plate and neuromast phenotypes were scored as follows: within each body segment (generally myomeres), any calcein-stained bone (including the first sliver to appear around the central neuromast, Figure 2F) was scored as a plate; segments were scored as‘dorso-ventral’if they con-tained any neuromasts above or below the midline or‘ mid-line’ if they contained neuromasts located exclusively on the midline. The midline of neuromast placement was de-termined based on the midline ridge of plates (in plated segments) or in relation to the surrounding neuromasts (in unplated segments). The horizontal myoseptum was not used to define the midline because both the Ma and Mp lines are dorsal to the horizontal myoseptum in the body segments around the pectoral fin. Although neuromasts are likely located in the epithelium over the plates, we state that neuromasts are located‘on’plates for simplicity.
All microscopy was performed using a Nikon Eclipse 80i microscope (Nikon Instruments Inc., Melville, NY, USA) with FITC/Texas Red filter cubes and manual stage and focus. Images were recorded using a Photometrics Cool-snap ES2 camera (Photometrics, Tucson, AZ, USA), then pseudocolored and uniformly enhanced for bright-ness and contrast with NIS-Elements imaging software (Nikon Instruments Inc., Melville, NY, USA). Composite (whole body and whole flank) pictures were stitched to-gether using Adobe Photoshop.
Edagene expression
We made cDNA from developing PB and JP fry by collect-ing clutches of fish at 4 weeks post-hatchcollect-ing (after plates have begun to calcify). RNA was isolated separately from
whole trunk (all tissue posterior to the operculum) of 12 individuals from each population using TRIzol (Invitrogen, Carlsbad, CA, USA), then was reverse transcribed into cDNA using the SuperScript III kit (Invitrogen, Carlsbad, CA, USA). Relative expression of Eda in JP and PB fish was determined by performing qPCR on these cDNA samples (Forward: GGAGAGGGTCATGAGGAGAAGTT; Reverse: GTTATCCTGTGTGGCATGCAA), with 3 tech-nical replicates each of 12 biological replicates for each gene in each population. qPCR reactions were carried out and analyzed as described previously [50] usingEef1b2 as the reference gene (Forward: CCGCTGGTACAACCA CATCA; Reverse: ACTGACCCAGAGGCTTCTTCAC), and calculating primer efficiencies based on a standard curve made from serial dilutions of a pool of JP and PB cDNAs. Values reported areEdaexpression as a percent-age of reference gene expression.
Edatransgenics
TGTCCAGCAGATGGA), digested the T2-hsp:EGFP plas-mid (gift from Tim Howes and David Kingsley, Stanford University, Stanford, CA, USA) with BamHI and ClaI to remove hsp:EGFP, and combined all three components with InFusion (Clontech, Mountain View, CA, USA). We sequenced the final plasmid to verify all components had expected sequences. Single-cell stickleback embryos were each injected with approximately 1 nl of a solution con-taining 250 ng of the CMV:JP-Eda plasmid, 350 ng RNA encoding the Tol2 transposase enzyme (transcribed in vitro using the mMessage mMachine SP6 kit; Ambion, Austin, TX, USA), and 0.1% phenol red (Sigma-Aldrich, St. Louis, MO, USA). Microinjection was carried out as previously described [54].
We generated two populations of low platedEda trans-genics: PB pure crosses as well as PB x JP F3 hybrids. Parents for PB crosses were from wild-caught and/or lab-reared stocks. Parents for the PB x JP low plated F3 fish were F2 offspring from thein vitrocross of a PB female to a JP male. Low plated PB x JP F2s carrying the PB chromosome in the 7 Mb around the Eda locus were identified by genotyping with microsatellite markers in Eda (Stn382 at 12.8 Mb [39]) and in flanking regions (Stn47at 16.33 Mb [55] and a newly designed marker at 9.01 Mb (Forward primer: GCCATTAGCCAAGGACT ATGC; Reverse primer: CCTCTCTGTCCTTCTGTCA TCC)). F2s that were found to have only PB (low plated) alleles in this region were crossed to generate low plated F3s.
When injected fish were at least 25 mm in standard length, they and their uninjected siblings were stained with calcein. Any injected fish that had more plates on either side than the highest number of plates on any of its uninjected siblings was identified as a putative trans-genic. We looked independently at the number of plates on each side, rather than total number of plates, because we observed a difference in plate number on opposing sides of individual transgenic fish, likely owing to the mosaic integration of the transgene. A total of 11 inde-pendent PB clutches yielding 135 surviving fish were screened to identify 27 transgenics. A total of 12 inde-pendent PB x JP F3 clutches yielding 40 surviving fish were screened to identify 13 transgenics.
Statistical analysis
All statistics were performed in R (http://www.R-project. org). We used Kruskal-Wallis tests to evaluateEdaqPCR data as well as the effect of transgene and genetic back-ground on plate number. ThePvalues reported in the text have been corrected for multiple comparisons using Bonferroni correction. Data are reported as means ± standard error. Fisher’s exact test was used to analyze the relationship between plates and neuromast distribu-tion during development and as a result of transgenic
manipulation. We used the Test of Equal or Given Pro-portions to assess differences in the percentage of seg-ments with dorso-ventral neuromasts in control versus transgenic fish and between genetic backgrounds.
Results and discussion
Developmental correlation between lateral plate formation and neuromast distribution
To examine whether there was a developmental correl-ation between the formcorrel-ation of the lateral plates and the distribution of neuromasts, we used repeated calcein staining to follow plate formation across the develop-ment of individual fish from a completely plated marine population (JP). Plate formation in this population fol-lows the pattern described previously [56]. The first plates calcify near the Ma/Mp boundary (Figure 2A); additional plates are then added rostrally and caudally (Figure 2B). A second set of plates begins to calcify near the caudal fin (Figure 2C), and additional plates are then added to each set of plates until they join in the middle into a continuous series of plates (Figure 2D).
segments; Table 1; Fisher’s exact test, P <0.0001). Given the tight spatial correlation between the appearance of a neuromast and the beginning of plate calcification, it is tempting to speculate that neuromasts provide a location cue for plate formation, as has been hypothesized for dermal bones in the heads of other fishes (see [43,57] for reviews). Testing this hypothesis will require the identifi-cation of plate precursor cells, as well as development of a method for ablating neuromasts that leaves those plate precursor cells intact.
Transgenic expression ofEdareveals pleiotropic effects on lateral plate formation and neuromast distribution Our developmental analysis revealed a close relationship between plate formation and neuromast distribution. Previous work in our laboratory has shown strong pheno-typic correlations between lateral plate presence and lat-eral line distribution observed across complete- and low plated populations [46] as well as in genetic crosses [38]. Together, these findings led us to hypothesize that Eda has a pleiotropic effect on both phenotypes. To test this hypothesis, we used transgenesis to manipulate Eda ex-pression to drive ectopic plate formation in low plated sticklebacks. The completely plated (JP)Edaallele is dom-inant to the low plated (PB)Edaallele for plate formation [31,39], and we observed that overallEdaexpression is 1.7 fold higher in the bodies of JP fish than in PB fish once plate calcification begins (relative expression JP: 0.96 ± 0.09 (n = 12); PB: 0.57 ± 0.05 (n = 12); Kruskal-Wallis χ2 (1) = 9.3;P<0.0025). Thus, we used the broadly expressed human cytomegalovirus (CMV) promoter to upregulate Eda expression in PB fish. Injection of the CMV:Eda transgene into PB embryos caused formation of ectopic plates in both Ma and Mp (Figure 3B); we focus on Mp
because the distribution of neuromasts in Mp (but not Ma) is linked toEda[38]. Transgenic fish had significantly more plates in Mp than their uninjected siblings (unin-jected controls: 0.05 ± 0.05 (n = 21); transgenic fish: 3.1 ± 0.6 (n = 19); Kruskal-Wallisχ2(1) = 19; P<0.0001). Trans-genic fish also had significantly more segments in Mp that had dorso-ventral neuromasts (percentage of total seg-ments with dorso-ventral neuromasts in uninjected controls: 0.3% (1/343 segments; n = 13 fish); transgenic fish: 7.7% (21/272 segments; n = 11 fish); Kruskal-Wallis
χ2
(1) = 22,P<0.0001). This shift in neuromast distribu-tion was strongly associated with the presence of ec-topic plates (Figure 3A,B; Table 2; Fisher’s exact test, P <0.0001). In transgenic fish, neuromasts were located dorsal and/or ventral to the midline in 44.4% of the seg-ments with ectopic Mp plates, but in only 0.4% of unplated Mp segments. This result reveals thatEdahas pleiotropic effects on both neuromast distribution and plate development.
Although our results demonstrate that transgenic ex-pression ofEdain the PB background does lead both to ectopic plate formation and to changes in neuromast distribution, there are relatively few ectopic plates in the Mp line of PB transgenic fish and only half of these plates have a dorsal-ventral distribution of neuromasts. These findings are consistent with previous results demonstrat-ing that interactions betweenEdaand modifier loci in the PB background influence both plate number [31] and neuromast distribution [38]. To determine whether these modifiers were also affecting theEdatransgene, we gener-ated CMV:Eda transgenics in a second low plated back-ground: low plated PB x JP F3 hybrids. These hybrids were verified to be homozygous for PB alleles in at least a 7 Mbp region aroundEda,but should have an assortment of PB and JP alleles at other plate modifier loci. In this F3 hybrid background, the average number of plates in Mp increased dramatically, from 0.4 ± 0.1 in uninjected con-trols (n = 26) to 12 ± 3 in transgenic fish (n = 12) (Kruskal-Wallisχ2(1) = 18,P<0.001). This was a significantly higher number of ectopic Mp plates than that observed in PB transgenics (Table 2; Kruskal-Wallis χ2(1) = 6.2,P <0.05). In F3 hybrids, the Eda transgene also significantly Table 1 Plate presence and neuromast distribution are
correlated through development
Dorso-ventral Midline
Plate 289a 72a
No plate 3a 272a
a
Combined segment totals (average 25.5 segments per fish) for MC fry at a range of stages in plate development (n = 31 fish).
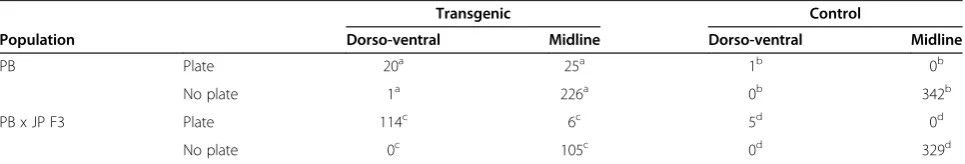
Table 2 Transgenic sticklebacks demonstrate thatEdaexpression affects both plate presence and neuromast distribution
Transgenic Control
Population Dorso-ventral Midline Dorso-ventral Midline
PB Plate 20a 25a 1b 0b
No plate 1a 226a 0b 342b
PB x JP F3 Plate 114c 6c 5d 0d
No plate 0c 105c 0d 329d
Combined segment totals (average 25.5 segments per fish) for:a
transgenic fish in PB background (n = 11 fish);b
uninjected control siblings in PB background (n = 13 fish);c
transgenic fish in PB x JP F3 background (n = 12 fish); andd
increased the number of Mp segments with a dorso-ventral distribution of neuromasts (percentage of total segments with dorso-ventral neuromasts in uninjected controls: 1.5% (n = 15); transgenic fish: 50.7% (n = 12); Kruskal-Wallisχ2(1) = 191,P<0.0001). Similar to the ef-fect of theEdatransgene in the PB background, the sig-nificant shift in the distribution of neuromasts was strongly linked to being located on plates (Figure 3C-E; Table 2; Fisher’s exact test, P <0.0001). However, com-pared with the pure PB background, a significantly higher proportion of these ectopic plates had a dorso-ventral distribution of neuromasts in F3 hybrids: neuro-masts were located dorsal and/or ventral to the midline on 95% of ectopic Mp plates in F3 transgenics versus 44.4% in PB transgenics (Table 2; Kruskal-Wallisχ2(1) = 51, P <0.0001). These results support previous genetic mapping studies demonstrating that modifier loci con-tribute to differences in these phenotypes between the JP and PB populations [31,38]. Additional genetic map-ping and cloning experiments are required to determine whether the modifier loci act independently or have pleiotropic effects on the two phenotypes.
Conclusions
These independent transgenic experiments provide strong support for the conclusion that Eda has pleio-tropic effects on both the development of the lateral plates and the patterning of the lateral line. There are two possible mechanisms to explain the pleiotropic ef-fects ofEda on these two phenotypes.Edacould have a direct effect on neuromast distribution that is independ-ent of its effect on plate developmindepend-ent. Alternatively,Eda could have an indirect effect on neuromast distribution, which is mediated by its influence on plate development. At this point, we cannot distinguish between these alter-natives. However, studies in medaka and zebrafish dem-onstrate that the presence of dermal bone affects the patterning of some neuromasts [58], suggesting that similar mechanisms might occur in sticklebacks. Testing these alternative mechanisms would require ablation of the lateral plate precursor cells without disruption of the neuromasts in a transgenic background.
While the molecular genetic basis of lateral plate vari-ation is now well-described [31,32,39], the selective forces that generate this variation remains a subject of debate [47,59]. Our results demonstrate that the re-peated loss of lateral plates in freshwater stickleback populations is accompanied by a change in the lateral line sensory system. Thus, our work suggests that re-peated selection for the low plated Eda allele in fresh-water could also be the result of selection on the lateral line, rather than on lateral plates. Furthermore, many other phenotypes have been linked to the region around Eda, such as pelvic spine length [37], body shape
[27,34,36], color [34], growth rate [28,29], salinity prefer-ence [30], and schooling behavior [60], all of which could also be targets of selection. Although associations betweenEdagenotype and survival and fitness in fresh-water have been previously demonstrated [28,29,33,35], these experiments could not distinguish between the ef-fects of Eda and linked loci. The transgenic fish gener-ated for this study, and any stable transgenic lines obtained from them, will enable a rigorous analysis of the pleiotropic effects of Eda on both phenotypes and fitness. Determining which traits are caused byEdaitself or by other loci in tight linkage withEdawill enable fu-ture studies to determine both the agents and pheno-typic targets of selection at this locus, thereby making key connections between genotype, phenotype and fit-ness [61,62].
Abbreviations
CMV:human cytomegalovirus; DASPEI: 2-(4-(dimethylamino)styryl)-N-ethylpyridinium iodide;Eda:Ectodysplasin; JP: Japanese Pacific Ocean marine; Ma: Main trunk line, anterior; MC: Manchester Clam Bay marine; Mp: main trunk line, posterior; PB: Paxton benthic; PB x JP F3: Paxton benthic x Japanese Pacific Ocean marine F3 hybrid; QTL: quantitative trait locus.
Competing interests
The authors declare that they have no competing interests.
Authors’contributions
MGM, AKG, and CLP conceived and designed the experiments, analyzed the data, and wrote the manuscript. MGM and AKG performed the experiments. All authors read and approved the final manuscript.
Acknowledgements
We thank Shaugnessy McCann for excellent fish care. This work was supported by National Institutes of Health Center of Excellence in Genomic Science Grant P50 HG002568 to CLP, National Science Foundation Grant IOS-1145866 to AKG and CLP, and National Science Foundation Graduate Research Fellowship DGE-0718124 to MGM.
Author details
1Divisions of Human Biology and Basic Sciences, Fred Hutchinson Cancer
Research Center, 1100 Fairview Avenue North, Seattle 98109, WA, USA.
2Graduate Program in Molecular and Cellular Biology, University of
Washington, 1959 NE Pacific Street, Health Sciences Building T-466, Seattle 98195, WA, USA.
Received: 8 October 2013 Accepted: 20 November 2013 Published: 5 February 2014
References
1. Fisher RA:The Genetical Theory of Natural Selection.Oxford: Oxford University Press; 1930.
2. Orr HA:Adaptation and the cost of complexity.Evolution2000,54:13–20. 3. Schluter D:The Ecology of Adaptive Radiation.Oxford: Oxford University
Press; 2000.
4. Lande R:Quantitative genetic analysis of multivariate evolution, applied to brain: body size allometry.Evolution1979,33:402–416.
5. Kirkpatrick M, Barton N:Chromosome inversions, local adaptation and speciation.Genetics2006,173:419–434.
6. Hoffmann AA, Rieseberg LH:Revisiting the impact of inversions in evolution: from population genetic markers to drivers of adaptive shifts and speciation?Annu Rev Ecol Evol Syst2008,39:21–42.
8. Albertson RC, Streelman JT, Kocher TD:Directional selection has shaped the oral jaws of Lake Malawi cichlid fishes.Proc Natl Acad Sci USA2003, 100:5252–5257.
9. Bratteler M, Lexer C, Widmer A:Genetic architecture of traits associated with serpentine adaptation ofSilene vulgaris.J Evol Biol2006, 19:1149–1156.
10. Hall MC, Basten CJ, Willis JH:Pleiotropic quantitative trait loci contribute to population divergence in traits associated with life-history variation in
Mimulus guttatus.Genetics2006,172:1829–1844.
11. Protas M, Tabansky I, Conrad M, Gross JB, Vidal O, Tabin CJ, Borowsky R: Multi-trait evolution in a cave fish,Astyanax mexicanus.Evol Dev2008, 10:196–209.
12. Lowry DB, Willis JH:A widespread chromosomal inversion polymorphism contributes to a major life-history transition, local adaptation, and repro-ductive isolation.PLoS Biol2010,8:e1000500.
13. Joron M, Frezal L, Jones RT, Chamberlain NL, Lee SF, Haag CR, Whibley A, Becuwe M, Baxter SW, Ferguson L, Wilkinson PA, Salazar C, Davidson C, Clark R, Quail MA, Beasley H, Glithero R, Lloyd C, Sims S, Jones MC, Rogers J, Jiggins CD, ffrench-Constant RH:Chromosomal rearrangements maintain a polymorphic supergene controlling butterfly mimicry.Nature2011, 477:203–206.
14. Parnell NF, Hulsey CD, Streelman JT:The genetic basis of a complex functional system.Evolution2012,66:3352–3366.
15. Yoshizawa M, Yamamoto Y, O’Quin KE, Jeffery WR:Evolution of an adaptive behavior and its sensory receptors promotes eye regression in blind cavefish.BMC Biol2012,10:108.
16. Phillips PC:Testing hypotheses regarding the genetics of adaptation. Genetica2005,123:15–24.
17. Carbone MA, Jordan KW, Lyman RF, Harbison ST, Leips J, Morgan TJ, DeLuca M, Awadalla P, Mackay TFC:Phenotypic variation and natural selection at
Catsup, a pleiotropic quantitative trait gene inDrosophila.Curr Biol2006,
16:912–919.
18. Flint J, Mackay TFC:Genetic architecture of quantitative traits in mice, flies, and humans.Genome Res2009,19:723–733.
19. Wittkopp PJ, Beldade P:Development and evolution of insect pigmentation: genetic mechanisms and the potential consequences of pleiotropy.Semin Cell Dev Biol2009,20:65–71.
20. Loehlin DW, Werren JH:Evolution of shape by multiple regulatory changes to a growth gene.Science2012,335:943–947.
21. Prasad VSK, Song BH, Olson-Manning C, Anderson JT, Lee CR, Schranz ME, Windsor AJ, Clauss MJ, Manzaneda AJ, Naqvi I, Reichelt M, Gershenzon J, Rupasinghe SG, Schuler MA, Mitchell-Olds T:A gain-of-function poly-morphism controlling complex traits and fitness in nature.Science2012, 337:1081–1084.
22. Hermann K, Klahre U, Moser M, Sheehan H, Mandel T, Kuhlemeier C: Tight genetic linkage of prezygotic barrier loci creates a multifunctional speciation island inPetunia.Curr Biol2013,23:873–877.
23. Linnen CR, Poh YP, Peterson BK, Barrett RDH, Larson JG, Jensen JD, Hoekstra HE:Adaptive evolution of multiple traits through multiple mutations at a single gene.Science2013,339:1312–1316.
24. Kingsley DM, Peichel CL:The molecular genetics of evolutionary change in sticklebacks.InBiology of the Three-Spined Stickleback.Edited by Östlund-Nilsson S, Mayer I, Huntingford F. Boca Raton: CRC Press; 2007:41–81. 25. Bell MA, Foster SA:The Evolutionary Biology of the Threespine Stickleback.
Oxford: Oxford University Press; 1994.
26. Östlund-Nilsson S, Mayer I, Huntingford F:Biology of the Three-Spined Stickle-back.Boca Raton: CRC Press; 2007.
27. Albert AYK, Sawaya S, Vines TH, Knecht AK, Miller CT, Summers BR, Balabhadra S, Kingsley DM, Schluter D:The genetics of adaptive shape shift in stickleback: pleiotropy and effect size.Evolution2008,62:76–85. 28. Barrett RDH, Rogers SM, Schluter D:Natural selection on a major armor
gene in threespine stickleback.Science2008,322:255–257. 29. Barrett RDH, Rogers SM, Schluter D:Environment specific pleiotropy
facilitates divergence at theEctodysplasinlocus in threespine stickleback. Evolution2009,63:2831–2837.
30. Barrett RDH, Vines TH, Bystriansky JS, Schulte PM:Should I stay or should I go? TheEctodysplasinlocus is associated with behavioural differences in threespine stickleback.Biol Lett2009,5:788–791.
31. Colosimo PF, Peichel CL, Nereng K, Blackman BK, Shapiro MD, Schluter D, Kingsley DM:The genetic architecture of parallel armor plate reduction in threespine sticklebacks.PLoS Biol2004,2:e109.
32. Cresko WA, Amores A, Wilson C, Murphy J, Currey M, Phillips P, Bell MA, Kimmel CB, Postlethwait JH:Parallel genetic basis for repeated evolution of armor loss in Alaskan threespine stickleback populations.Proc Natl Acad Sci USA2004,101:6050–6055.
33. Le Rouzic A, Østbye K, Klepaker TO, Hansen TF, Bernatchez L, Schluter D, Vøllestad LA:Strong and consistent natural selection associated with armour reduction in sticklebacks.Mol Ecol2011,20:2483–2493. 34. Malek TB, Boughman JW, Dworkin I, Peichel CL:Admixture mapping of
male nuptial colour and body shape in a recently formed hybrid population of threespine stickleback.Mol Ecol2012,21:5265–5279. 35. Marchinko KB:Predation’s role in repeated phenotypic and genetic
divergence of armor in threespine stickleback.Evolution2009,63:127–138. 36. Rogers SM, Tamkee P, Summers B, Balabahadra S, Marks M, Kingsley DM,
Schluter D:Genetic signature of adaptive peak shift in threespine stickleback.Evolution2012,66:2439–2450.
37. Shapiro MD, Marks ME, Peichel CL, Blackman BK, Nereng KS, Jónsson B, Schluter D, Kingsley DM:Genetic and developmental basis of evolutionary pelvic reduction in threespine sticklebacks.Nature2004, 428:717–723.
38. Wark AR, Mills MG, Dang LH, Chan YF, Jones FC, Brady SD, Absher DM, Grimwood J, Schmutz J, Myers RM, Kingsley DM, Peichel CL:Genetic architecture of variation in the lateral line sensory system of threespine sticklebacks.G3 (Bethesda)2012,2:1047–1056.
39. Colosimo PF, Hosemann KE, Balabhadra S, Villarreal G, Dickson MC, Grimwood J, Schmutz J, Myers RM, Schluter D, Kingsley DM:Widespread parallel evolution in sticklebacks by repeated fixation ofEctodysplasin
alleles.Science2005,307:1928–1933.
40. Bleckmann H, Zelick R:Lateral line system of fish.Integr Zool2009,4:13–25. 41. Mogdans J, Bleckmann H:Coping with flow: behavior, neurophysiology and
modeling of the fish lateral line system.Biol Cybern2012,106:627–642. 42. Dijkgraaf S:The functioning and significance of the lateral-line organs.
Biol Rev Camb Philos Soc1963,38:51–105.
43. Webb JF:Gross morphology and evolution of the mechanoreceptive lateral-line system in teleost fishes.Brain Behav Evol1989,33:34–53. 44. Bleckmann H:Peripheral and central processing of lateral line
information.J Comp Physiol A2008,194:145–158.
45. Coombs S, Görner P, Münz H:The Mechanosensory Lateral Line: Neurobiology and Evolution.New York: Springer-Verlag; 1989.
46. Wark AR, Peichel CL:Lateral line diversity among ecologically divergent threespine stickleback populations.J Exp Biol2010,213:108–117. 47. Barrett RDH:Adaptive evolution of lateral plates in three-spined
sticklebackGasterosteus aculeatus: a case study in functional analysis of natural variation.J Fish Biol2010,77:311–328.
48. Bell MA, Aguirre W:Contemporary evolution, allelic recycling, and adaptive radiation of the threespine stickleback.Evol Ecol Res2013, 15:377–411.
49. Reimchen TE, Bergstrom C, Nosil P:Natural selection and the adaptive radiation of Haida Gwaii stickleback.Evol Ecol Res2013,15:241–269. 50. Greenwood AK, Cech JN, Peichel CL:Molecular and developmental
contributions to divergent pigment patterns in marine and freshwater sticklebacks.Evol Dev2012,14:351–362.
51. Kawakami K, Shima A, Kawakami N:Identification of a functional transposase of the Tol2 element, an Ac-like element from the Japanese medaka fish, and its transposition in the zebrafish germ lineage. Proc Natl Acad Sci USA2000,97:11403–11408.
52. Yan M, Wang L-C, Hymowitz SG, Schilbach S, Lee J, Goddard A, de Vos AM, Gao W-Q, Dixit VM:Two-amino acid molecular switch in an epithelial morphogen that regulates binding to two distinct receptors. Science2000,290:523–527.
53. Kwan KM, Fujimoto E, Grabher C, Mangum BD, Hardy ME, Campbell DS, Parant JM, Yost HJ, Kanki JP, Chien C-B:The Tol2kit: a multisite gateway-based construction kit for Tol2 transposon transgenesis constructs. Dev Dyn2007,236:3088–3099.
54. Chan YF, Marks ME, Jones FC, Villarreal G, Shapiro MD, Brady SD, Southwick AM, Absher DM, Grimwood J, Schmutz J, Myers RM, Petrov D, Jonsson B, Schluter D, Bell MA, Kingsley DM:Adaptive evolution of pelvic reduction in sticklebacks by recurrent deletion of aPitx1enhancer.Science2010, 327:302–305.
56. Bell MA:Lateral plate polymorphism and ontogeny of the complete plate morph of threespine sticklebacks (Gasterosteus aculeatus).Evolution 1981,35:67–74.
57. Graham-Smith W:On the lateral lines and dermal bones in the parietal region of some crossopterygian and dipnoan fishes.Philos Trans R Soc Lond B Biol Sci1978,282:41–105.
58. Wada H, Ghysen A, Satou C, Higashijima S-I, Kawakami K, Hamaguchi S, Sakai-zumi M:Dermal morphogenesis controls lateral line patterning during post-embryonic development of teleost fish.Dev Biol2010,340:583–594. 59. Hendry AP, Peichel CL, Matthews B, Boughman JW, Nosil P:Stickleback
research: the now and the next.Evol Ecol Res2013,15:111–141. 60. Greenwood AK, Wark AR, Yoshida K, Peichel CL:Genetic and neural
modularity underlie the evolution of schooling behavior in threespine sticklebacks.Curr Biol2013,23:1884–1888.
61. Barrett RDH, Hoekstra HE:Molecular spandrels: tests of adaptation at the genetic level.Nat Rev Genet2011,12:767–780.
62. Irschick DJ, Albertson RC, Brennan P, Podos J, Johnson NA, Patek S, Dumont E:Evo-devo beyond morphology: from genes to resource use.Trends Ecol Evol2013,28:267–273.
doi:10.1186/2041-9139-5-5
Cite this article as:Millset al.:Pleiotropic effects of a single gene on skeletal development and sensory system patterning in sticklebacks.
EvoDevo20145:5.
Submit your next manuscript to BioMed Central and take full advantage of:
• Convenient online submission
• Thorough peer review
• No space constraints or color figure charges
• Immediate publication on acceptance
• Inclusion in PubMed, CAS, Scopus and Google Scholar
• Research which is freely available for redistribution