R E S E A R C H
Open Access
A quantitative atlas of Even-skipped and
Hunchback expression in
Clogmia albipunctata
(Diptera: Psychodidae) blastoderm embryos
Hilde Janssens
1†, Ken Siggens
2†, Damjan Cicin-Sain
1, Eva Jiménez-Guri
1, Marco Musy
1, Michael Akam
2and Johannes Jaeger
1*Abstract
Background:Comparative studies of developmental processes are one of the main approaches to evolutionary
developmental biology (evo-devo). Over recent years, there has been a shift of focus from the comparative study of particular regulatory genes to the level of whole gene networks. Reverse-engineering methods can be used to computationally reconstitute and analyze the function and dynamics of such networks. These methods require quantitative spatio-temporal expression data for model fitting. Obtaining such data in non-model organisms remains a major technical challenge, impeding the wider application of data-driven mathematical modeling to evo-devo.
Results:We have raised antibodies against four segmentation gene products in the moth midgeClogmia
albipunctata, a non-drosophilid dipteran species. We have used these antibodies to create a quantitative atlas of protein expression patterns for the gap genehunchback (hb), and the pair-rule geneeven-skipped (eve).Our data reveal differences in the dynamics of Hb boundary positioning and Eve stripe formation betweenC. albipunctata andDrosophila melanogaster. Despite these differences, the overall relative spatial arrangement of Hb and Eve domains is remarkably conserved between these two distantly related dipteran species.
Conclusions:We provide a proof of principle that it is possible to acquire quantitative gene expression data at high accuracy and spatio-temporal resolution in non-model organisms. Our quantitative data extend earlier qualitative studies of segmentation gene expression inC. albipunctata,and provide a starting point for comparative reverse-engineering studies of the evolutionary and developmental dynamics of the segmentation gene system.
Keywords:Clogmia albipunctata, Non-drosophilid diptera, Non-model organism, Pattern formation, Comparative
network analysis, Segmentation gene network, Hunchback, Even-skipped, Image bioinformatics, Quantitative expression data
Background
One of the main approaches to evolutionary develop-mental biology (evo-devo) is the comparative study of developmental processes (for example, see [1,2]). Much of this work focuses on molecular (mainly transcrip-tional) regulatory networks [3-5]. Such studies reveal which aspects of development are conserved and which
are more variable. This not only gives us insights into the evolutionary history of a developmental trait, but also enables us to better understand the functional prin-ciples of regulatory processes, and the constraints they impose on evolution (for example, see [6,7]).
The field of evo-devo is currently moving from com-parative studies of gene regulation at the level of individ-ual genes to more integrative approaches trying to compare the dynamics and function of entire regulatory networks (for example, see [4,5,8-19]). Only such a network-centered view can give us a rigorous under-standing of important systems-level concepts, such as
* Correspondence:yogi.jaeger@crg.eu †Equal contributors
1EMBL/CRG Research Unit in Systems Biology, Centre de Regulació Genòmica
(CRG), and Universitat Pompeu Fabra (UPF), Dr. Aiguader 88, 08003 Barcelona, Spain
Full list of author information is available at the end of the article
evolvability and robustness of developmental traits (for example, see [20-37]).
One particularly powerful approach to the integrative comparative study of development is the use of reverse-engineering approaches to reconstruct the structure and dynamics of regulatory networks across species [19]. This approach has a lot of potential since it does not require any genetic perturbations, which are often non-trivial to implement outside well established model organisms.
Reverse engineering of networks is based on quantita-tive measurement of gene expression patterns (reviewed in [19,38-41]). These data are then used to fit a gene net-work model. The resulting gene circuit solutions repre-sent specific instances of a network that are capable of reproducing the observed patterns. These networks can then be analyzed to gain insights into the regulatory pro-cesses underlying observed gene expression or pheno-typic traits (for example, see [42-49]).
In the context of pattern formation, it is especially im-portant to preserve the spatio-temporal aspects of the data to be fit, since the focus is on the regulation of tim-ing and spatial features of gene expression (such as do-main boundaries). For this reason, we need to adapt methods for quantitative microscopy and image bio-informatics (for example, see [50,51]) to a non-model or-ganism context. This poses a significant technical challenge which needs to be met if reverse-engineering methods are to be more widely applied in the context of evo-devo.
Here, we provide a proof of principle that quantitative measurements of expression patterns with high accur-acy and spatio-temporal resolution are possible in a non-model organism. We have raised antibodies against four segmentation gene products in the nematoceran moth midge Clogmia albipunctata (family: Psychodi-dae; Figure 1). Gap and pair-rule gene expression in this species shows a number of interesting qualitative differences compared to the standard model for dip-teran segmentation, the vinegar fly Drosophila melano-gaster. In particular, expression of posterior gap domains is modified and pair-rule stripes are delayed in
C. albipunctatacompared toD. melanogaster(Figure 1; [52-54]). To investigate these differences in more detail, we use immunofluorescence combined with confocal scanning microscopy and a data processing pipeline adapted fromD. melanogaster[50] to provide a quanti-tative atlas of protein expression patterns for the gap gene hunchback (hb), and the pair-rule gene even-skipped (eve). We analyze these expression patterns with regard to their timing and spatial registration. Our results show that the dynamics of Hb boundary posi-tioning and Eve stripe formation differ significantly be-tween C. albipunctata and D. melanogaster. Anterior
shifts in domain position as development proceeds are not only present, but much more pronounced in
C. albipunctata. Despite this, the relative arrangement of the anterior Hb domain and the anterior stripes of Eve is largely conserved across the evolutionary dis-tance between the two species. The quantitative dataset that we have produced provides a suitable starting point for future reverse-engineering approaches to study the mechanisms and dynamics of segmentation gene regulation inC. albipunctata.
Methods
Embryo collection and fixation
C. albipunctata culture and embryo collection methods have been described previously [54] (detailed protocols are available from the authors on request). Embryos were dissected from adult females, development was activated by osmotic shock, and embryos were left to develop until the desired stage on moist filter paper at 25°C. Blastoderm stage embryos were fixed at a number of time points of development up to a maximum of 8 hours after egg acti-vation (see Results for details). Fixation was performed using a modification of a previously described procedure [54]. Following dechorionation in 50% bleach, and fixation in a 1:1 mixture of 8% formaldehyde in PBS/heptane for 25 minutes, the formaldehyde/heptane was removed. Heptane was added to the embryos followed by an equal volume of methanol (pre-cooled to−80°C), and this mix-ture was shaken for 20 to 30 seconds to fracmix-ture the vitel-line layer. The heptane/methanol was removed and replaced with methanol. Embryos were transferred to a 10-ml syringe (fitted with a 24 g × 1 inch; 0.7 mm needle and with the syringe plunger removed) using additional methanol as required to aid the transfer of all of the em-bryos. With approximately 5 ml methanol/embryos in the syringe, the plunger was refitted, the embryos were dis-persed by shaking so as not to be sitting in the outlet port of the syringe, and the embryos were then rapidly expelled through the needle into a 15 ml glass vial. The embryos were then transferred to a 1.5 ml microcentrifuge tube and washed three times with methanol. Devitellinized em-bryos were stored in methanol at−20°C.
Antibody production
Polyclonal antisera were raised against C. albipunctata
50 μg protein per immunization injection (Eurogentec, Liège, Belgium).
C. albipunctata has two paralogues of the D. melano-gaster even-skipped gene (Calb-eve1 and Calb-eve2) which are both expressed in very similar patterns during the blastoderm stage [53,54]. Polyclonal antiserum against C. albipunctata Even-skipped1 protein (Calb-Eve1) was raised as follows. A pET-DEST42 vector/Eve1 cDNA construct was produced. Exponentially growing bacterial cultures were induced with 0.5 mM isopropyl β-D_1-thiogalactopyranoside (IPTG) for 2 hours and bacterial pellets were harvested and stored at −20°C. Cleared lysate preparation and purification of the 6xHis-tagged Eve1 protein under denaturing conditions were carried out using Ni-nitrilotriacetic acid (Ni-NTA) agar-ose protocols (Qiagen, Venlo, Limburg, Netherlands). Briefly, cells were lyzed in 8 M urea lysis buffer (Buffer B, Qiagen) for 1 hour with constant mixing. Following centrifugation, the solubilized protein supernatant was added to Ni-NTA Agarose and mixed at a low speed on a rotary shaker for 1 hour to allow binding of the His-tag. Subsequent recovery, washing and elution steps
were carried out using centrifugation for 5 seconds at 1000 g. Bound protein was eluted using Buffer E (8 M urea buffer pH 4.5, Qiagen). Finally, the purified Eve1 was dialyzed against deionized water then quantified and aliquoted for the immunization program. Antibodies were raised in two guinea pigs using 50 μg protein per immunization injection (Eurogentec, Liège, Belgium).
Antibody staining
Immunofluorescent protocol
Staged embryos were stained with antisera against Calb-Hb and Calb-Eve1. Briefly, embryos were rehydrated through graded methanol/PBT washes (PBT is PBS, 0.1% Tween) then washed 2x30 minutes in PBT. Em-bryos were incubated for 2x60 minutes in PBTB block-ing buffer (PBTB is PBT plus Western Blockblock-ing Reagent, Roche, Basel, Switzerland). Primary antibodies were pre-absorbed ontoD. melanogaster0–24 hour fixed embryos overnight at 4°C. Rabbit anti-Hb (serum SK4433) was preabsorbed at 1:100 dilution in PBT; guinea pig anti-Eve1 (serum SKC044) was preabsorbed at 1:25 dilution in PBT. Primary antibody stainings were done in 800μl
PBTB + 100 μl of each preabsorbed antibody (rabbit anti-Hb, guinea pig anti-Eve1) at 4°C overnight. Embryos were then washed 4×20 minutes in PBT followed by 2×30 minutes in PBTB. Secondary antibody incubations were done in 1 ml PBTB/antibody for 2 hours at room temperature. Secondary antibodies were anti-rabbit-Alexa647 and anti-guinea pig-Alexa555 at a dilution of 1:4000 (Molecular Probes, Life Technologies, Carlsbad, CA, USA). Embryos were washed 2×15 minutes in PBT and then counterstained for 10 minutes with Hoechst 34580 (Molecular Probes) at a dilution of 1:1000 in PBT. Embryos were washed 2×1 hour in PBT at room temperature, then washed in PBT overnight at 4°C; finally, the embryos were equilibrated overnight in 1,4-diazabicyclo[2.2.2]octane (DABCO) mounting solu-tion at 4°C (5% DABCO in 90% glycerol/PBS pH 8) prior to slide preparation.
Colorimetric (enzymatic) protocol
This assay is based on the following modifications of the immunofluorescent antibody staining procedure. Anti-guinea pig-AP conjugate (The Jackson Laboratory, Bar Harbor, ME, USA) was used as the secondary antibody. Detection was carried out using NBT/BCIP (Roche, Basel, Switzerland). Signal development was allowed to proceed at room temperature until patterning was visible and was stopped by washing with PBT; embryos were mounted as for confocal procedure.
Quantitative gene expression data
Image acquisition and data processing for C. albipunc-tata embryos stained using antisera against Calb-Hb and Calb-Eve1 was performed using a quantification pipeline involving the following steps: (1) images were acquired using a 20× water-immersion objective on a SP5 confocal microscope (Leica Microsystems, Wetzlar, Germany) as described previously [47]; (2) dorso-ventral (D-V) orientation was determined based on membrane morphology [55], and slanting of Eve stripes, as described in Results; (3) image segmentation was performed to iden-tify nuclei and measure fluorescence intensity per nucleus as described [50,56,57]; (4) embryos were sorted into time classes as described below; (5) non-specific background staining was removed as described [50,57,58]; (6) a strip along the lateral midline - covering 10% of the embryo’s height (D-V) - was extracted using a previously published graphical user interface [51]; (7) data registration was performed by spline approximation [50,57,59] using the BREReA software (http://urchin.spbcas.ru/downloads/ BREReA/BREReA.htm; successor of GCPReg [60]); (8) data integration was performed by collecting data points into 100 bins along the antero-posterior (A-P) axis and then averaging individual profiles for each gene and time class [50,57]; (9) integrated data were smoothened by
applying a Gaussian filter with a kernel width of three nu-clei; and (10) expression levels were scaled to facilitate comparison between datasets.
Positions of Calb-Eve protein stripes were calculated as described previously [61] by approximating the ex-pression data with quadratic splines [59]. Positions of the posterior boundaries of the anterior Hb domain were calculated by extracting points of half-maximum fluores-cence intensity using fast dyadic wavelets [59].
Time classification
Embryos were assigned to blastoderm cleavage cycles 10-14A (C10-C14A, C14A is the part of C14 that occurs before gastrulation [62]) based on the observed number of nuclei and nuclear density [55]. C14A embryos were further classified into 8 time classes (T1-T8) based on visual inspection of Calb-Eve protein staining. The as-signment of ambiguous cases was corrected using mem-brane morphology whenever possible (based on the morphological staging scheme described in [55]).
Because time classification of embryos could be af-fected by observer bias, we developed an algorithm to verify and confirm the staging of embryos for time clas-ses T5-T8. This involves searching for clusters of em-bryos which show Calb-Eve expression profiles of similar shape in a multidimensional space with a suitable defin-ition of a clustering metric. The algorithm follows two basic steps. All combinations of embryos that constitute our dataset are fitted against each other, two by two, and the corresponding probability of X2v is used to define a
relative distance between embryos. The second step is to build clusters of close-by embryos. We start by consider-ing individual embryos as clusters of one object. A hier-archical clustering method was then used: at each iteration, the two closest clusters are found and merged into a single cluster for which the distances to all the other clusters are recalculated as the mean of the initial two. The process can be stopped at any arbitrary num-ber of desired clusters (eight in our case). Additional sig-natures can be taken into consideration to improve algorithm performance and further refine the clustering: the relative ratio of intensities for stripes 1 and 6, and/or the ratio of their widths. These two additional factors can be merged into one single variable by a classic Prin-cipal Component Analysis method. Considering these additional signatures resulted in a final number of four clusters, which correspond to the previously established time classes T5-T8.
Statistical analysis of gene expression data
We applied a two-sided Welcht-test (both on unranked and ranked data) to calculate if total Eve domain width differs between C. albipunctata and D. melanogaster.
of stripe 1 to the peak of stripe 6 in C. albipunctata, and from the peak of stripe 1 to the peak of stripe 7 in
D. melanogaster.
Results and discussion
Polyclonal antisera againstC. albipunctatasegmentation proteins
We raised antibodies against the following proteins in
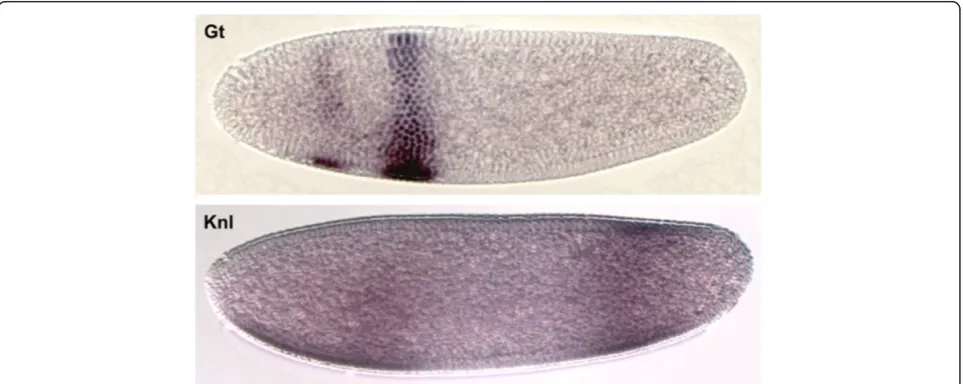
C. albipunctata: Gt, Knl, Hb, and Calb-Eve1 (see Additional file 1: Table S1). Test stains using a colorimetric (enzymatic) experimental protocol show that all these antisera produce staining patterns consistent with mRNA expression of the corresponding genes [54]. Example stains for Calb-Gt and Calb-Knl are shown in Figure 2. For Calb-Hb and Calb-Eve1, see our detailed ana-lysis based on immunofluorescent staining protocols below.
Immunofluorescent staining inC. albipunctataembryos We previously established an image acquisition and quan-tification method to generate gene expression datasets with high temporal and spatial resolution inD. melanoga-sterembryos (reviewed in [50]). Generating the same type of high-quality spatio-temporal data in a non-model or-ganism such asC. albipunctataturns out to be quite chal-lenging; in this species, embryos vary in shape, embryo morphology is less robust towards experimental proce-dures, antibody stainings are noisy, and the presence of the extraembryonic tissues (amnion and serosa) causes differential staining patterns along the D-V axis. For these reasons, considerable adaptation and optimization of embryo-fixation, dechorionation/devitellination, as well as immunofluorescent antibody staining protocols was re-quired to produce data of acceptable quality (see also
Methods). Using these adapted protocols, we stained a large number of C. albipunctata blastoderm embryos against Hb and Eve proteins (Figure 3A,B; see also Additional file 2: Table S2) while nuclei were visualized using a Hoechst34580 (Molecular Probes) counterstain (Figure 3C). For each embryo, we acquired images of the two data channels, and the nuclear channel (all at two different z-positions to capture as many blastoderm nuclei as possible) using confocal scanning microscopy. In addition, we imaged embryo morphology using differential interference con-trast (DIC; not shown).
We do not know whether the Calb-Eve1 antiserum also binds to the product of theeve2gene, which is very similar in sequence and shows an expression pattern similar to that of eve1 [53,54]. Therefore, we refer to these stains simply as‘Eve’below.
Embryo orientation
In a majority of embryos, membrane morphology [55] and/or the presence of extraembryonic tissues allowed us to determine the D-V orientation of the embryo. In case those features were not distinct enough to orient the embryos, we used the slanting of Eve stripes 1 and 2 as indicators, since these stripes slant to-wards the posterior in a consistent manner. In some of the younger embryos (pre-T3/T4), D-V alignment is harder to determine, but also less crucial due to the absence of significant D-V asymmetry in Hb and Eve expression patterns.
Image processing and data quantification
Nuclear images were processed using watershed-based image segmentation to generate a binary nuclear mask
(Figure 3D,E), where each nucleus is clearly separated from its neighbors [56]. We then extracted data from a 10% strip on the lateral side of the embryo: this region is determined manually as described in [51] (red lines in Figure 3E). This allows us to avoid measuring gene expression in the extraembryonic anlage, and to deal with the large variability in embryo shape. Next, non-specific background staining was removed, and data were registered in order to eliminate embryo-to-embryo variation, which is crucial for averaging data per gene and time class (Figure 3H–K, see Methods for details). This resulted in an integrated atlas of Hb and Eve expression in C. albipunctata based on a total of 484 selected embryos (Additional file 2: Table S2). This dataset is currently not hosted on any public database, but is available from the authors upon request.
Time classification
In a parallel effort to this study, we have carefully charac-terized C. albipunctatadevelopment and morphogenesis using live DIC imaging [55]. This work revealed that, just as in D. melanogaster, there are 14 cleavage cycles (C1-C14A) before gastrulation. Embryos can be assigned to separate cleavage cycles based on nuclear density and membrane morphology. Earlier work using quantitative expression data in D. melanogaster further subdivided C14A into eight separate time classes [50]. To facilitate comparisons between the two species, we also divide C14A in C. albipunctata into eight time classes (T1-T8; see also [55]). Assignment of embryos to these time classes is based on visual inspection of Eve expres-sion pattern and membrane morphology, verified by cluster analysis, as described in Methods. We detect a
positive correlation between assigned time class and age of embryos at fixation time (see Additional file 3: Table S3), further supporting our pattern-based sta-ging scheme.
Analysis of Eve protein expression inC. albipunctata Previous studies using antibody stains or in situ
hybridization of Calb-eve protein or mRNA revealed a heterochronic shift in the formation of Eve stripe 7, as only stripes 1 to 6 can be detected before gastrulation [52-55]. In addition, there seems to be a general delay in the formation of posterior evestripes [55]. Here, we ex-tend these earlier qualitative studies with a quantitative analysis of Eve expression at the protein level.
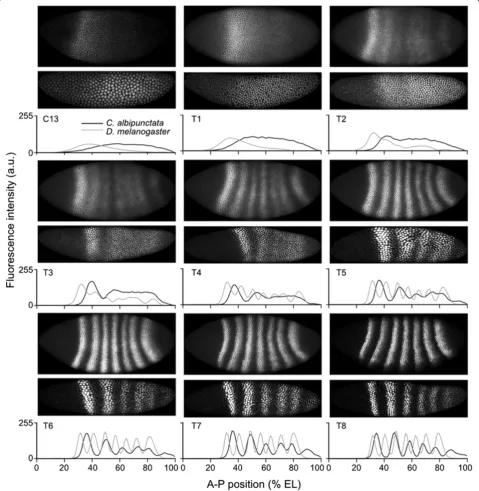
C. albipunctata evemRNA expression starts around C12 [55] or C13 [54]. The earliest clearly detectable Eve protein expression is visible at C13 in a broad region from approxi-mately 40% A-P position (where 0% is the anterior pole) to the posterior tip of the embryo (Figure 4). In D. mela-nogaster, Eve protein is detected as early as C12 - in a smaller domain, never reaching the posterior of the embryo [63].
The dynamics of Eve stripe formation differs signifi-cantly between the two species (Figure 4; see also [55]). InD. melanogaster, the initial broad Eve protein expres-sion pattern becomes divided into two sub-domains: the anterior one later splits into stripes 1-2-3, and the pos-terior one into stripes 4-5-6. Stripe 7 arises de novo -that is, as a separate new domain [63]. In contrast, Eve stripes inC. albipunctata generally form by budding off from the initial broad domain, one by one in a roughly anterior-to-posterior sequence. The only exception to this rule is stripe 6, which formsde novo.All stripes re-solve relatively late: stripe 1 forms first (T2), followed by stripe 2 (T3/T4), stripe 3 (T5) and then stripe 6 (T5/ T6). As inD. melanogaster,the last stripes to become re-solved are stripes 4 and 5, whose inter-stripe domain clears only around T7. The above indicates a general delay in stripe formation compared to D. melanogaster
where all 7 Eve stripes are clearly visible by T4 [63]. Moreover, in contrast toD. melanogaster, Eve stripe 6 in
C. albipunctata forms at the posterior pole of the em-bryo, its posterior boundary only retracting from the pole towards the end of T8. This creates an expression-free posterior region within which stripe 7 will form de novoafter the onset of gastrulation [52].
While stripe formation differs markedly between the two species, stripe maturation is quite similar. In both species, inter-stripe minima further clear and deepen, expression levels rise, stripes sharpen, and shift to the anterior of the embryo after their initial formation (see below, and [63]).
Our quantitative results on the dynamics of Eve pro-tein stripe formation and maturation are consistent with
those revealed by earlier studies at the level of eve
mRNA [54,55].
Analysis of Hb protein expression inC. albipunctata Two qualitative differences inhbexpression betweenC. albi-punctataandD. melanogasterhad been reported previously [52,54]: (1)C. albipunctatalacks a posteriorhbdomain be-fore gastrulation; and (2) hb is expressed in the antero-dorsal anlage of the serosa, an extraembryonic tissue. Here, we extend these earlier qualitative studies at the level ofhb
mRNA with a quantitative analysis of Hb protein expression. InD. melanogaster, maternal Hb protein forms an A-P gradient around C10 [63,64]. InC. albipunctata, Hb pro-tein can be detected slightly later: in C12 embryos, we can occasionally detect ubiquitous Hb staining, or the onset of a shallow A-P gradient. The first clear zygotic Hb protein expression is detected in C13 (Figure 5), consistent with the reported timing of mRNA expression [54]. While García-Solache and colleagues [54] reported an early homogenoushbmRNA expression throughout the anter-ior 60% of the embryo, Hb protein extends more poster-iorly, reaching 75 to 80% A-P position (Figure 5). During C14A, Hb protein clears from the posterior of the embryo, and the posterior boundary of the Hb protein domain sharpens and shifts anteriorly to about 60% A-P position (compared to about 50% in the mRNA data [54]). Such an anterior shift is never observed in D. mela-nogaster (see also below). The Hb domain reaches its maximum expression level at T3, compared to T4 in
D. melanogaster (Figure 5; see also [63]).
Towards the end of C14A, the anterior Hb domain of
D. melanogastersplits into several parts, with the stron-gest expression at the most posterior end of the original domain (the parasegment-4 or PS4 stripe; [63]). Simi-larly, the anteriorhb mRNA domain in C. albipunctata
resolves into multiple bands at that stage [54]. In con-trast, Hb protein expression seems to be less complex: expression decreases anteriorly, resulting in retraction from the anterior pole (Figure 5, T5-T8). This retraction only occurs in the embryonic anlage, while Hb remains expressed in the antero-dorsal anlage of the extraembry-onic tissues (Figure 5, especially T6 and T8, the effect is less clear, but still visible, in the embryo shown for T7). The anterior Hb protein domain never splits into sub-domains, showing broad expression from 25 to 52% A-P position in the embryonic anlage. The only slightly non-uniform expression feature in this domain is a plateau of lower expression levels towards the anterior (Figure 5).
C. albipunctataHb and Eve expression domains shift anteriorly over time
As reported for eve mRNA [54,55], each Eve protein stripe is located more posteriorly inC. albipunctatathan
its equivalent in D. melanogaster (Figure 6, Figure 7A, Additional file 4: Table S4). In fact, stripes 3–6 are ini-tially located more than one stripe’s width more poster-ior than their D. melanogastercounterparts (Figure 7A).
Figure 4Comparison of quantitative Eve protein expression patterns betweenClogmia albipunctataandDrosophila melanogaster.
This raises the question whether this posterior displace-ment could involve reduced anterior domain shifts in
C. albipunctata compared toD. melanogaster [63]. Our data reveal that this is not the case. On average, the shift of Eve stripes towards the anterior is twice as strong in
C. albipunctata(5.31 nuclei) as inD. melanogaster(2.56 nuclei; see Additional file 4: Table S4), and every Eve stripe (except stripe 6) shifts over a larger number of nu-clei inC. albipunctatacompared to theirD. melanogaster
counterparts (Figure 7A,B; Additional file 4: Table S4).
Figure 5Comparison of quantitative Hb protein expression patterns betweenClogmia albipunctataandDrosophila melanogaster.
The fact that the shift mechanism inD. melanogasterdoes not depend on diffusion and hence nuclear spacing [43] makes it unlikely that this difference is caused by the re-duced nuclear density observed inC. albipunctata[55]. A more complicated underlying cause for this difference is further suggested by the observation thatC. albipunc-tata stripes 2 and 4 even“overtake” aD. melanogaster
stripe (stripes 3 and 6, respectively; see Figure 7A). Interestingly, whereas in D. melanogaster the posterior Eve stripes shift more than the anterior stripes,C. albi-punctata Eve stripes show the reverse (Figure 7A,B; Additional file 4: Table S4).
In D. melanogaster, the posterior boundary of the anterior Hb domain remains at a constant position over time [63]. In contrast, this boundary shifts mark-edly to the anterior in C. albipunctata mRNA in situ
stains [54]. Our measurements confirm this result at the protein level: the posterior boundary of anterior Hb shows a small shift of about 2.15% egg length be-tween T3 and T8.
In D. melanogaster, the anterior Hb domain overlaps with Eve stripes 1 and 2 from the time point on when they become detectable (Figure 6). In contrast, the rela-tive domain positions of Eve and Hb are much more dy-namic inC. albipunctata (Figure 6): during early C14A, the anterior Hb domain only overlaps with Eve stripe 1. Since Eve stripes 1 and 2 shift further anterior than the posterior boundary of the anterior Hb domain (5.72 and 6.99 versus 2.15% EL, respectively; see Additional file 4: Table S4), Eve stripe 2 eventually passes the position of
the Hb border resulting in a similar relative arrangement of domains as seen in D. melanogaster by the end of C14A.
Analysis of movies based on live DIC imaging of early development inC. albipunctatashow that nuclei do not move at all during blastoderm-stage interphases [55]. This implies that the observed anterior domain shifts are due to dynamic gene regulatory interactions, rather than physical relocation of nuclei, a conclusion also found in
D. melanogaster[44,65].
Finally, we have measured the total width of the Eve domain in both species at different time points to inves-tigate whether stripe shifts and refinement lead to com-paction of the Eve-expression regions as seen in D. melanogaster [63]. Our measurements indicate that the Eve domain does not contract inC. albipunctata, but in-stead retains its total width as expression shifts anteri-orly (Figure 7C; Additional file 5: Table S5). This is due to the increased shift in anterior, compared to posterior stripe positions (Figure 7A). Interestingly, the total rela-tive width of Eve expression - measured as the distance between the peaks of stripe 1 and 6 - is wider inC. albi-punctata both compared to the distances between stripes 1/6 and 1/7 inD. melanogaster(Figure 7C). Conclusions
In this paper, we present a quantitative analysis of the spatio-temporal protein expression patterns of two seg-mentation genes - the gap gene hb, and the pair-rule gene eve - in a non-drosophilid dipteran, the moth
Figure 6Relative positioning of Eve and Hb protein expression domains is conserved inClogmia albipunctatacompared toDrosophila
midgeC. albipunctata. Our work extends earlier quali-tative studies of segmentation gene expression in this species [52-55]. We confirm that the formation of Eve stripes is delayed in C. albipunctata compared to
D. melanogaster, and that gap and pair-rule patterns shift anteriorly over time in this species. In addition, we show that domain shifts are much larger than those in D. melanogaster, and describe the precise dynamics by which the relative arrangement of the Hb domains with anterior Eve stripes is established. To our know-ledge, no gene expression patterns have been studied with such accuracy and spatio-temporal resolution in any organism outside well established experimental model systems.
Our work provides a proof of principle that such de-tailed and systematic quantitative analyses of spatio-temporal gene expression are feasible in non-model organisms. Our data provide a powerful resource for reverse-engineering developmental gene regulatory net-works [42-49]. We expect that increased availability of such data will promote the use of reverse-engineering methods for the comparative study of the evolution of developmental processes [19]. Ultimately, the computa-tional reconstitution and analysis of developmental gene regulatory networks will lead to a much more systematic and quantitative understanding of the non-linear map from genotype to phenotype, tackling a central problem in current evo-devo [34,66].
Figure 7Eve protein expression dynamics and variability inClogmia albipunctatacompared toDrosophila melanogaster.
Additional files
Additional file 1: Table S1.Polyclonal antisera againstC. albipunctata Segmentation Proteins. This table summarizes the polyclonal antisera we have raised for this study.‘Protein’indicates theC. albipunctatagene products against which antibodies were raised. Gene nomenclature as in García-Solache and colleagues,Dev Biol2010, 344:308–318.‘Species’ indicates which animal was used for the immunization protocol.‘Serum’ identifies distinct immunization reactions (two injections into different animals per gene product).‘Rating’:‘+++’indicates minimal background and clear signal;‘++’indicates that higher concentrations of antibody are needed and background is significant;‘+’indicates a recognizable staining pattern, but low signal-to-noise ratio. Rating scheme equivalent to that used in Kosman and colleagues,Dev Genes Evol1998,
208:290–294.
Additional file 2: Table S2.Number of embryo expression profiles used for data quantification, per gene and time class.
Additional file 3: Table S3.Number of embryos per time class according to physiological age. This table plots the number of embryos per assigned time class (C10-C13, C14A: T1-T8) versus the time of fixation (in hours:minutes after egg activation). See Methods in the main text for details on egg activation, embryo fixation, and assignment of embryos to time classes.
Additional file 4: Table S4.Average positions and shifts of Eve stripe peaks inC. albipunctata(Ca) andD. melanogaster(Dm) embryos. This table shows the position (in % position along the A-P axis, where 0% is the anterior pole) of the point of maximum intensity within each visible Eve stripe from T3 to T8. The bottom row shows the extent (in % embryo length) of anterior temporal shifts in peak position for each detectable Eve stripe, calculated from the time of stripe appearance to T8. Positions and shifts are calculated from integrated data. See Methods in the main text for details.
Additional file 5: Table S5.Width of the Eve domain inC. albipunctata andD. melanogasterembryos. Data shown for time classes T5-T8. Total domain widths (in % egg length) are calculated - from integrated data - as reaching from the peak of Eve stripe 1 to the peak of Eve stripe 6 (C. albipunctata) or stripe 7 (D. melanogaster). See Methods in the main text for details.
Abbreviations
D-V:Dorso-ventral; A-P: Antero-posterior; EL: Egg length; Calb-Gt:C. albipunctataGiant; Calb-Hb:C. albipunctataHunchback; Calb-Knl:C. albipunctataKnirps-like; Calb-Eve:C. albipunctataEven-skipped; DIC: Differential interference contrast; PBS: Phosphate-buffered saline; evo-devo: Evolutionary developmental biology; a.u.: Arbitrary units.
Competing interests
The authors declare that they have no competing interests.
Authors’contributions
HJ performed data processing and analysis. KS performed the experimental and microscopy work. DCS developed software tools for data processing and analysis. EJG contributed to image processing and helped with time classification of embryos. MM developed the clustering algorithm for time classification. MA and JJ designed the study. HJ and JJ wrote the manuscript. All authors read and approved the final manuscript.
Acknowledgments
We thank Anton Crombach for help with statistical testing, and Maria Iliakova for contributions to image processing and data quantification. Urs Schmidt-Ott and Mónica García-Solache provided help and advice onClogmiaprotocols. Work in Cambridge and Barcelona was funded by the UK Biotechnology and Biological Sciences Research Council (grant number BB/D00513), by the MEC-EMBL agreement for the EMBL/CRG Research Unit in Systems Biology, SGR Grant 406 from the Catalan funding agency AGAUR, and by grants BFU2009-10184 and BFU2012-33775 from the Spanish Ministerio de Economia y Competitividad (MINECO; formerly MICINN).
Author details
1
EMBL/CRG Research Unit in Systems Biology, Centre de Regulació Genòmica (CRG), and Universitat Pompeu Fabra (UPF), Dr. Aiguader 88, 08003 Barcelona, Spain.2Department of Zoology, Downing Street, Cambridge CB2 3EJ UK.
Received: 17 September 2013 Accepted: 22 November 2013 Published: 7 January 2014
References
1. Müller GB:Evo-devo: extending the evolutionary synthesis.Nat Rev Genet 2007,8:943–949.
2. Wilkins AS:The Evolution of Developmental Pathways.Sunderland, MA: Sinauer Associates; 2002.
3. Davidson EH:The Regulatory Genome: Gene Regulatory Networks in Development and Evolution.Burlington, MA: Academic; 2006.
4. Stern DL, Orgogozo V:The loci of evolution: how predictable is genetic evolution?Evolution2008,62:2155–2177.
5. Stern DL, Orgogozo V:Is genetic evolution predictable?Science2009, 323:746–751.
6. Maynard Smith J, Burian R, Kauffman S, Alberch P, Campbell J, Goodwin B, Lande R, Raup D, Wolpert L:Developmental constraints and evolution. Q Rev Biol1985,60:265–287.
7. Salazar-Ciudad I, Marín-Riera M:Adaptive dynamics under development-based genotype-phenotype maps.Nature2013,497:361–364. 8. Hinman VF, Nguyen AT, Cameron A, Davidson EH:Developmental gene
regulatory network architecture across 500 million years of echinoderm evolution.Proc Natl Acad Sci USA2003,100:13356-13361.
9. Davidson EH, Erwin DH:Gene regulatory networks and the evolution of animal body plans.Science2006,311:796–800.
10. Hinman V, Davidson EH:Evolutionary plasticity of developmental gene regulatory network architecture.Proc Natl Acad Sci USA2007, 104:19404–19409.
11. Wilkins AS:Between“design”and“bricolage”: genetic networks, levels of selection, and adaptive evolution.Proc Natl Acad Sci USA2007, 104:8590–8596.
12. Gao F, Davidson EH:Transfer of a large gene regulatory apparatus to a new developmental address in echinoid evolution.Proc Natl Acad Sci USA 2008,105:6091–6096.
13. Erwin DH, Davidson EH:The evolution of hierarchical gene regulatory networks.Nat Rev Genet2009,10:141–148.
14. Davidson EH:Emerging properties of animal gene regulatory networks. Nature2010,468:911–920.
15. Davidson EH:Evolutionary bioscience as regulatory systems biology. Dev Biol2011,357:35–40.
16. Monteiro A:Gene regulatory networks reused to build novel traits. Bioessays2011,34:181–186.
17. Peter IS, Davidson EH:Evolution of gene regulatory networks controlling body plan development.Cell2011,144:970–985.
18. Jaeger J, Irons D, Monk N:The inheritance of process: a dynamical systems approach.J Exp Zool B Mol Dev Evol2012,318:591–612. 19. Jaeger J, Crombach A:Life’s attractors: understanding developmental
systems through reverse engineering andin silicoevolution. In Evolutionary Systems Biology.Edited by Soyer O. Berlin: Springer; 2012:93–120.
20. Waddington CH:The Strategy of the Genes.London, UK: George Allen & Unwin Ltd; 1957.
21. Maynard Smith J:Natural selection and the concept of a protein space. Nature1970,225:563–564.
22. Dawkins R:The evolution of evolvability.InArtificial Life, the Proceedings of an Interdisciplinary Workshop on the Synthesis and Simulation of Living Systems.Edited by Langton C. Redwood City, CA: Addison-Wesley; 1989:201–220.
23. Wagner GP, Altenberg L:Complex adaptations and the evolution of evolvability.Evolution1996,50:967–976.
24. Kirschner M, Gerhart J:Evolvability.Proc Natl Acad Sci USA1998, 95:8420–8427.
25. Flatt T:The evolutionary genetics of canalization.Q Rev Biol2005, 80:287–316.
27. Aldana M, Balleza E, Kauffman S, Resendiz O:Robustness and evolvability in genetic regulatory networks.J Theor Biol2007,245:433–448. 28. Gerhart J, Kirschner M:The theory of facilitated variation.Proc Natl Acad
Sci USA2007,104:8582–8589.
29. Hendrikse JL, Parsons TE, Hallgrímsson B:Evolvability as the proper focus of evolutionary developmental biology.Evol Dev2007,9:393–401. 30. Pigliucci M:Is evolvability evolvable?Nat Rev Genet2008,9:75–82. 31. Wagner A:Robustness and evolvability: a paradox resolved.Proc R Soc B
2008,275:91–100.
32. Masel J, Siegal ML:Robustness: mechanisms and consequences. Trends Genet2009,25:395–403.
33. Masel J, Trotter MV:Robustness and evolvability.Trends Genet2010, 26:406–414.
34. Pigliucci M:Genotype-phenotype mapping and the end of the‘genes as blueprint’metaphor.Philos Trans R Soc Lond B Biol Sci2010,365:557–566. 35. Wagner GP, Zhang J:The pleiotropic structure of the genotype-phenotype
map: the evolvability of complex organisms.Nat Rev Genet2011, 12:204–213.
36. Wagner A:The Origins of Evolutionary Innovations: A Theory of Transformative Change in Living Systems.Oxford: Oxford University Press; 2011.
37. Wagner A:The role of robustness in phenotypic adaptation and innovation.Proc R Soc B2012,279:1249–1258.
38. Banga JR:Optimization in computational systems biology.BMC Syst Biol 2008,2:47.
39. Ashyraliyev M, Fomekong-Nanfack Y, Kaandorp JA, Blom J:Systems biology: parameter estimation for biochemical models.FEBS J2009,276:886–902. 40. Hecker M, Lambeck S, Toepfer S, Van Someren E, Guthke R:Gene regulatory
network inference: data integration in dynamic models - a review. BioSystems2009,96:86–103.
41. Jaeger J, Monk NAM:Reverse engineering of gene regulatory networks. InLearning and Inference in Computational Systems Biology.Edited by Lawrence ND, Girolami M, Rattray M, Sanguinetti G. Cambridge, MA: MIT Press; 2010:9–34.
42. Reinitz J, Mjolsness E, Sharp DH:Cooperative control of positional information inDrosophilabybicoidand maternalhunchback.J Exp Zool 1995,271:47–56.
43. Jaeger J, Surkova S, Blagov M, Janssens H, Kosman D, Kozlov KN, Manu, Myasnikova E, Vanario-Alonso CE, Samsonova M, Sharp DH, Reinitz J: Dynamic control of positional information in the earlyDrosophila
embryo.Nature2004,430:368–371.
44. Perkins TJ, Jaeger J, Reinitz J, Glass L:Reverse engineering the gap gene network.PLoS Comput Biol2006,2:e51.
45. Manu, Surkova S, Spirov AV, Gursky V, Janssens H, Kim A-R, Radulescu O, Vanario-Alonso CE, Sharp DH, Samsonova M, Reinitz J:Canalization of gene expression in theDrosophilablastoderm by gap gene cross regulation. PLoS Biol2009,7:e1000049.
46. Manu, Surkova S, Spirov AV, Gursky V, Janssens H, Kim A-R, Radulescu O, Vanario-Alonso CE, Sharp DH, Samsonova M, Reinitz J:Canalization of gene expression and domain shifts in theDrosophilablastoderm by dynamical attractors.PLoS Comput Biol2009,5:e1000303.
47. Ashyraliyev M, Siggens K, Janssens H, Blom J, Akam M, Jaeger J:Gene circuit analysis of the terminal gap genehuckebein.PLoS Comput Biol 2009,5:e1000548.
48. Crombach A, Wotton KR, Cicin-Sain D, Ashyraliyev M, Jaeger J:Efficient reverse-engineering of a developmental gene regulatory network. PLoS Comput Biol2012,8:e1002589.
49. Becker K, Balsa-Canto E, Cicin-Sain D, Hoermann A, Janssens H, Banga JR, Jaeger J:Reverse-engineering post-transcriptional regulation of gap genes inDrosophila melanogaster.PLoS Comput Biol2013,9:e1003281. 50. Surkova S, Myasnikova E, Janssens H, Kozlov KN, Samsonova AA, Reinitz J,
Samsonova M:Pipeline for acquisition of quantitative data on segmentation gene expression from confocal images.Fly2008,2:1–9. 51. Crombach A, Cicin-Sain D, Wotton KR, Jaeger J:Medium-throughput
processing of whole mountin situhybridisation experiments into gene expression domains.PLoS ONE2012,7:e46658.
52. Rohr KB, Tautz D, Sander K:Segmentation gene expression in the mothmidgeClogmia albipunctata(Diptera, psychodidae) and other primitive dipterans.Dev Genes Evol1999,209:145–154.
53. Bullock SL, Stauber M, Prell A, Hughes JR, Ish-Horowicz D, Schmidt-Ott U: Differential cytoplasmic mRNA localisation adjusts pair-rule transcription
factor activity to cytoarchitecture in dipteran evolution. Development2004,131:4251–4261.
54. García Solache MA, Jaeger J, Akam M:A systematic analysis of the gap gene system in the moth midgeClogmia albipunctata.Dev Biol2010, 344:306–318.
55. Jiménez-Guri E, Wotton KR, Gavilán B, Jaeger J:A staging scheme for the development of the moth midgeClogmia albipunctata.PLoS ONE2014, 9(1):e84422.
56. Janssens H, Kosman D, Vanario-Alonso CE, Jaeger J, Samsonova M, Reinitz J: A high-throughput method for quantifying gene expression data from earlyDrosophilaembryos.Dev Genes Evol2005,215:374–381.
57. Surkova S, Myasnikova E, Kozlov KN, Pisarev A, Reinitz J, Samsonova M: Quantitative imaging of gene expression inDrosophilaembryos. In Imaging in Developmental Biology.Edited by Sharpe J, Wong RA. Cold Spring Harbor, NY: Cold Spring Harbor Press; 2011:683–698.
58. Myasnikova E, Samsonova M, Kosman D, Reinitz J:Removal of background signal fromin situdata on the expression of segmentation genes in
Drosophila.Dev Genes Evol2005,215:320–326.
59. Myasnikova E, Samsonova A, Kozlov KN, Samsonova M, Reinitz J: Registration of the expression patterns ofDrosophilasegmentation genes by two independent methods.Bioinformatics2001,17:3–12. 60. Kozlov KN, Myasnikova E, Samsonova AA, Surkova S, Reinitz J, Samsonova M:
GCPReg package for registration of the segmentation gene expression data inDrosophila.Fly2009,3:151–156.
61. Janssens H, Crombach A, Wotton KR, Cicin-Sain D, Surkova S, Lim CL, Samsonova M, Akam M, Jaeger J:Lack oftaillessleads to an increase in expression variability inDrosophilaembryos.Dev Biol2013,377:305–317. 62. Foe VE, Alberts BM:Studies of nuclear and cytoplasmic behaviour during
the five mitotic cycles that precede gastrulation inDrosophila
embryogenesis.J Cell Sci1983,61:31–70.
63. Surkova S, Kosman D, Kozlov K, Manu, Myasnikova E, Samsonova AA, Spirov A, Vanario-Alonso CE, Samsonova M, Reinitz J:Characterization of theDrosophilasegment determination morphome.Dev Biol2008, 313:844–862.
64. Tautz D:Regulation of theDrosophilasegmentation genehunchbackby two maternal morphogenetic centres.Nature1988,332:281–284. 65. Keränen SV, Fowlkes CC, Luengo Hendriks CL, Sudar D, Knowles DW, Malik J,
Biggin MD:Three-dimensional morphology and gene expression in the
Drosophilablastoderm at cellular resolution II: dynamics.Genome Biol 2006,7:R124.
66. Alberch P:From genes to phenotype: dynamical systems and evolvability.Genetica1991,84:5–11.
doi:10.1186/2041-9139-5-1
Cite this article as:Janssenset al.:A quantitative atlas of Even-skipped and Hunchback expression inClogmia albipunctata(Diptera: Psychodidae) blastoderm embryos.EvoDevo20135:1.
Submit your next manuscript to BioMed Central and take full advantage of:
• Convenient online submission
• Thorough peer review
• No space constraints or color figure charges
• Immediate publication on acceptance
• Inclusion in PubMed, CAS, Scopus and Google Scholar
• Research which is freely available for redistribution