DOI: 10.22075/JRCE.2018.14724.1269
journal homepage: http://civiljournal.semnan.ac.ir/
Evaluating
the Application
of
Reinforcement
Correction Factor for Concrete Core Testing
K. Momeni1, R. Madandoust1* and M.M. Ranjbar1
1. Department of Civil Engineering, University of Guilan, P.O. Box 3756, Rasht, Iran
Corresponding author:[email protected]
ARTICLE INFO ABSTRACT
Article history:
Received: 05 May 2018 Accepted: 14 July 2018
This study investigates the reinforcement correction factor of concrete core in more detail to prepare appropriate outlines for interpretation of results. This investigation aims to minimize uncertainties involved to carry out the more realistic condition assessment of suspect buildings before taking up retrofitting/strengthening measures. For this purpose, an extensive experimental program including different concrete strength level, moisture condition, core size, length-to-diameter (L/D) ratio of core and steel bar size with various configurations was under taken. The effect of variation of foregoing parameters on the ratio of average compressive strength of cores containing steel bars to that of corresponding plain specimens was probed. The results show that the correction factors are highly dependent on the values of volume percentage and position of reinforcing bars in the core, which are extremely interrelated. Hence, the experimental results do not show a good agreement with the provisions by the British Standard 6089 and Concrete Society Report No.11. Therefore, a statistical analysis on the prediction of cube compressive strength using linear and nonlinear regression models is accomplished. The results showed that regression models have great ability as a feasible tool for prediction of compressive strength on the basis of core testing in the presence of steel bars. However, the most accurate results obtained by nonlinear equations in comparison with linear models.
Keywords: Concrete, Core test, Correction factor, Reinforcement, Regression.
1. Introduction
After identification of suspect areas in a concrete structure, detailed assessment of the in-situ quality is needed to be done to plan
in-situ concrete properties can be considerably difficult; wherever possible the aim of testing should be to compare suspect concrete with similar concrete in other parts of the structure which is known to be satisfactory.
The testing methods for in-situ strength assessment vary from very indirect surface hardness test to the direct testing of concrete strength by removing cores. It should be emphasized that a great deal of proficiency is required for interpretation of field observations and test results to make a reliable assessment of the condition as well as for analyzing and evaluating safety to recommend the most appropriate retrofitting/strengthening measures.
Core testing is the most direct method to assess the in-situ concrete compressive strength in an existing structure, generally related to suspected construction malpractice or deficiency of concrete supply, to carry out the condition assessment of buildings before taking up repair and upgrading work. Although this test is quite simple to conduct, the results obtained may sometimes contain considerable errors because of the great variety of parameters involved.
The general problems of core testing are well known. The factors including core diameter, length-to-diameter ratio (L/D), concrete age, aggregate characteristics, direction of coring and the moisture condition at the time of testing are known which affect the relationship between core strength and the corresponding standard cube or cylinder strength are fully reported by Bungey [1,2]and other researchers [3-6].
Another potential factor influencing the testing of cores is the presence of reinforcing bars within the core. The effects of the
presence of steel bars on the strength of cores have been investigated by only a few researchers [7-9] Reinforcement bars passing through a core will increase the uncertainty of results and should be avoided wherever possible [10]. However, in heavy reinforced regions in some structures it may be impossible to avoid it.
If, for whatever reason, cores cut through steel bars, the requirement concerning these cores is laid down in the national annex to BS EN 12504-1, British Standard BS 6089, BS 1881: part 120 and also the Concrete Society Report No.11 give correction factors for the presence of one or more reinforcing bars in the core. Recently, a modification to the current code provisions is presented by Khoury et al. (2014)[9]. Whereas, some standard codes such as ACI 214, BS EN 13791 and ASTM C42 [2][11] recommend that core specimens for compression tests should preferably not contain reinforcing bars.
cylinders with L/D ratio of 1.0 has shown no significant negative influence on the strength. The Concrete Society Report No.11 indicates a reduction in strength as a function of the size and position of the steel reinforcement bars.
The above conflicting conclusions regarding core strength results calls for closer study in reliable evaluating of core strength. Therefore, the purpose of the present study is to attempt to shed light on the foregoing topics based on an extensive experimental program. In this regard, core test is assessed in more detail with particular attention to the practical factors for the presence of one or more reinforcing bars in different configuration. Moreover, on the basis of the extensive experimental data obtained, linear and nonlinear regression models for predicting the standard cube compressive strength have been developed. The results of regression analysis of the data and performance of the obtained models are also presented and discussed.
2. Experimental Program
The concrete mixtures were proportioned to give 56-day cube strengths of 21.3 to 48.1 MPa with water/cement ratios of 0.55 and 0.4. The cement contents were considered at values of 250 kg/m3 and 380 kg/m3. The amount of well-graded fine aggregate and coarse aggregate with a nominal maximum size of 19 mm were experimentally determined as approximately 905– 985 kg/m3 and 953–1020 kg/m3, respectively. Type II Portland cement, washed river sand and crushed limestone aggregate were used in all the mixes.
The effects of embedded steel bars on strength of concrete cores by different
parameters namely; core diameter, L/D ratio, moisture condition of the core, concrete strength level as well as rebar size and its position in the core were examined. For each mix 300 × 300 × 1000 mm reinforced and unreinforced concrete beams were cast and cured under laboratory conditions with relative humidity and temperature of 70% and approximately 25 ºC respectively, along with 100 mm control cubes. The reinforcing bars used were deformed steel bars of 10 mm and 16 mm diameter. Cores with 75 mm diameter by 150 mm length and 100 mm diameter by L/D ratios of 1 and 2 were cut from the prepared beams by drilling in a direction perpendicular to the casting direction of the concrete. The core specimens were trimmed and capped with a sulfur-mortar compound. For evaluating the significance of moisture condition of the core at the time of testing, two different curing conditions include keeping cores dry in air for 7 days and soaked for 2 days before testing were considered.
At least 480 cores were tested for compressive strength at the age of 56-days, and each result is the average of at least three specimens. The details of test programme are summarized in Table 1.
3. Discussion on Obtaining Results
Regarding the Effect of Rebars in
the Core
expected a reliable relationship for correcting compressive strength results of cores with
rebar, due to the uncertainties involved to the test.
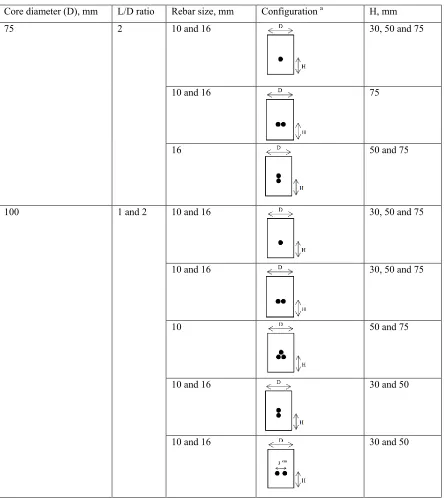
Table 1. details of the test programme.
Core diameter (D), mm L/D ratio Rebar size, mm Configuration a H, mm
75 2 10 and 16 30, 50 and 75
10 and 16 75
16 50 and 75
100 1 and 2 10 and 16
30, 50 and 75
10 and 16 30, 50 and 75
10 50 and 75
10 and 16 30 and 50
10 and 16 30 and 50
a For each particular configuration, the combination of different sized steel bars in one core is not considered.
As an indicator of the effect of reinforcement bars in the core, the term ‘relative strength’ is considered in the presentation of results. This is defined as the ratio of the average
bars on core strength is illustrated substantially by the ‘volume fraction factor of steel bars’. This idea has also been considered by Loo et al. (1989) [8] to examine the effect of embedded reinforcement on strength of concrete cylinders.
3.1. Effect of Length-to-Diameter Ratio
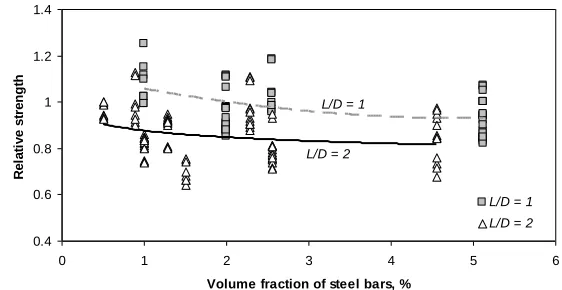
Fig. 1 shows the variation of relative strength ratio versus volume percentage of steel bars for two different L/D ratios of 1 and 2. This deliberation was taken irrespective of concrete strength level, core size, moisture condition and configuration of steel bars.
Fig. 1. Variation of relative strength ratio versus volume fraction of steel bars for two values of L/D
ratios. The tests results confirmed that presence of steel bars reduces significantly the strength of cores with L/D ratio of 2, but this effect diminishes for L/D ratio of 1. Unexpectedly, it seems that compressive strength is improved by the inclusion of steel bars for cores with L/D ratio of 1 and steel inclusion lower than 2%. However, such behaviour was similarly reported by Loo et al. (1989) [8]. This phenomenon is probably due to the effect of the state of stress distribution in the core, especially on the bonding between steel bar and the concrete. Also, it can be stated that the values of strength ratio is higher (close to 1) for L/D=1 than those for L/D=2, in general. This effect is may be linked to the stress distribution in cores with various values of L/D ratio.
In a compression test, an element within the specimen is subjected to a shearing and compression stresses, due to the end restraint and friction acting of the testing machine
platens. This effect diminishes with the distance from the concrete-platen interface. As a result of this fact, there is a relatively undamaged cone or pyramid of height roughly equal to 3
2 1
D . Thus, if the core
longer than about 1.7D, a part of it will be free from the restraining action of the platens [3]. In this region a foreign object such as a steel bar, which has a much higher modulus of elasticity, is likely to produce stress concentrations. This phenomenon accelerates the failure of concrete core specimens [8]. However, Neville (1996) [3] believes that it may be anticipated that specimens whose length is less than 1.5D show a considerably higher strength than those with a greater height.
This figure also clearly demonstrates that the L/D ratio has a great effect on correction factor for interpretation of core test results, with a particular attention to volume
0.4 0.6 0.8 1 1.2 1.4
0 1 2 3 4 5 6
Volume fraction of steel bars, %
R
e
la
ti
v
e
s
tr
e
ng
th
L/D = 1 L/D = 2 L/D = 1
percentage of steel bars. Therefore, the correction factor recommended in BS 1881: Part 120 and Concrete Society Report No.11 should be accompanied by considerable caution when attempting to evaluate the strength of cores including steel bars.
Besides, on the basis of data obtained herein through testing large number of cores, it seems that as much as 3.5% by volume of reinforcement bars had no more declining effect on the measured strength of concrete cores, as this trend has a tendency to reach constant reduction values of 5% and 15% for L/D ratios of 1 and 2, respectively.
3.2. Effect of Core Size
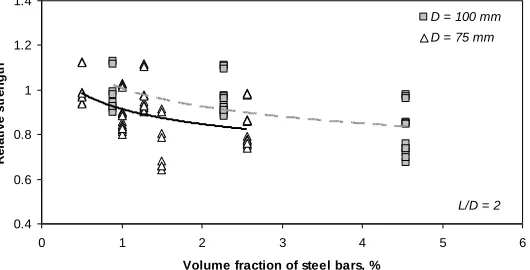
The effect of core diameter on general variation of relative strength ratio for different volume percentage of steel bars is illustrated by Fig. 2. This has been considered for L/D=2, regardless of concrete strength level, moisture condition, size and position of steel bars. This study examines the results of tests applied on the 75mm and 100mm diameter cores. There is conflicting experimental evidence concerning the strength of cores with different diameters. Based on literature, some investigators found no effects [12,13], whilst other state the strength of small cores to be less than the one
referred to standard diameter (D = 100 mm) [14].
According to the results, it can be concluded that core size significantly affect the relative strength for a given volume fraction of steel bars. In reference to Figs. 2, the interpretation of results for two different diameters of cores merits particular consideration and must be considered separately.
However, it seems that for a specified value of steel volume fraction, a simple conversion factor may be applied to convert the strength of 75 mm diameter cores to the strength of standard 100 mm diameter cores. Based on data obtained in this study, this value can be averagely deduced equal to 1.034.
Although these explanations need further experimental verification, the current test results show that the effect of steel bars on core strength varies substantially with the core size. Actually, greater attention needs to be devoted to the estimation of the strength of cores including reinforcing bars.
It should be mentioned that the highly dispersion in values of relative strength is related to the neglecting the effects concrete strength level, moisture condition and configuration of steel bars.
Fig. 2. Variation of relative strength ratio versus steel volume fraction for two different core diameters.
0.4 0.6 0.8 1 1.2 1.4
0 1 2 3 4 5 6
Volume fraction of steel bars, %
R
e
la
ti
v
e
s
tr
e
ng
th
D = 100 mm D = 75 mm
3.3. Effect of Concrete Strength Level
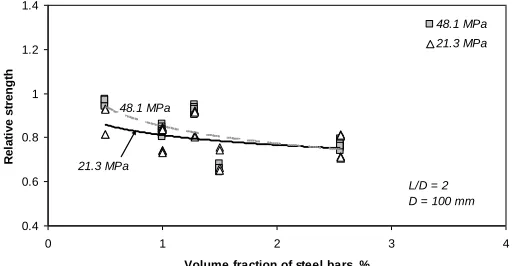
The effect of concrete strength level on general variation of relative strength versus steel volume fraction is presented in Fig. 3.
This consideration was taken for 100mm diameter cores and L/D ratio of 2, irrespective of moisture condition and size and location of steel bars.
Fig. 3. Variation of relative strength ratio versus steel volume fraction for two concrete strength levels.
The most important point revealed by this figure is that, the correction factors may be a function of the strength level of the concrete. The most probably explanation lies in this fact that cutting damage related to the low strength level of concrete is greater than high strength level. However, the difference of these functions has a tendency to decrease with steel volume percentage of core to reach constant relative strength value of 77% for steel volume fraction of 2.56%. The limitations of correction factors which are constant irrespective of strength are clear, and this further highlights the difficulties in achieving accurate estimates of cores containing reinforcing bars.
3.4. Effect of Moisture Condition
Fig. 4 shows the overall trend of relative strength ratio versus steel volume percentage for two moisture condition of cores, irrespective of strength level, core size, L/D ratio and configuration of steel bars. It can be generally stated that the mean values of relative core strength is higher for air-dried for 7 days than those for soaked for 2 days. The strength of cores left to dry in air for 7 days is found to be on average 9.4% greater than that of soaked cores before testing. Similar findings have also been reported by [1,3,15]
Fig. 4. Variation of relative strength ratio versus steel volume fraction for different moisture conditions.
0.4 0.6 0.8 1 1.2 1.4
0 1 2 3 4
Volume fraction of steel bars, %
R
e
la
ti
v
e
s
tr
e
ng
th
48.1 MPa 21.3 MPa
L/D = 2 D = 100 mm 48.1 MPa
21.3 MPa
0.4 0.6 0.8 1 1.2 1.4
0 1 2 3 4 5 6
Volume fraction of steel bars, %
R
e
la
ti
v
e
s
tr
e
ng
th
Soak ed for 2 days
Air-dried for 7 days
Therefore, it is very imperative that the relative moisture conditions of core and in-situ concrete are taken into account in determining actual in-situ concrete strengths. The importance of the careful control of the moisture condition of the core at the time of testing lies in the fact that this condition influences the apparent strength of the core [10]. The problem is that the difference is variable and uncertain.
Based on Fig. 4, it can be explained that the relative strength ratio is not significantly changed as a function of steel volume fraction, within the range of 0.5-5.12%, for a specific moisture condition. So, it seems that the moisture condition of core has only marginal influence upon test.
3.5. Effect of Reinforcing Bar Size
The effect of reinforcing bar size on overall variation of relative core strength versus steel
volume fraction is depicted in Fig. 5. This consideration was taken for 100 mm diameter cores and L/D ratio of 2, irrespective of concrete strength level, moisture condition and position of steel bars. In reference to Figs. 5, it seems that for a specified bar size, relative strength is declined by the inclusion of steel bars. It is difficult to infer the actual factor that caused the decrease in relative strength. According to this illustration, for a given steel volume fraction, 10 mm bar size has a greater adverse effect than larger size. This phenomenon is may be justified by the effect of the number of steel bars as well as their configuration on the state of stress distribution in the core. However, this explanation needs further tentative verification.
Fig. 5. Variation of relative strength ratio versus steel volume fraction for different bar sizes.
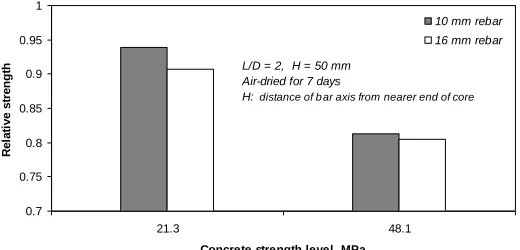
Fig. 6. Effect of strength level of concrete on relative strength ratio for different bar sizes.
0.4 0.6 0.8 1 1.2 1.4
0 1 2 3 4
Volume fraction of steel bars, %
R
e
la
ti
v
e
s
tr
e
ng
th
d rebar = 10 mm d rebar = 16 mm
L/D = 2 D = 100 mm 16 mm
10 mm
0.7 0.75 0.8 0.85 0.9 0.95 1
21.3 48.1
Concrete strength level, MPa
R
e
la
ti
v
e
s
tr
e
ng
th
10 mm rebar 16 mm rebar
L/D = 2, H = 50 mm Air-dried for 7 days
From Fig. 6, it can be stated that the mean values of relative strength is higher (closer to 1) for 10 mm diameter bar than those for 16 mm. For example, according to this figure, the mean values of relative core strength are 0.939 and 0.813 relating to concrete strength levels of 21.3 MPa and 48.1 MPa for 10 mm bar size, respectively. However, the corresponding values are found to be 0.907 and 0.805 for 16 mm bar size. Moreover, the reduction is found to be more significant for low strength concrete. This trend is similar to that obtained by Khoury et al. (2014) [9].
3.6. Effect of Distance of Bar Axis from Nearer End of Core (H)
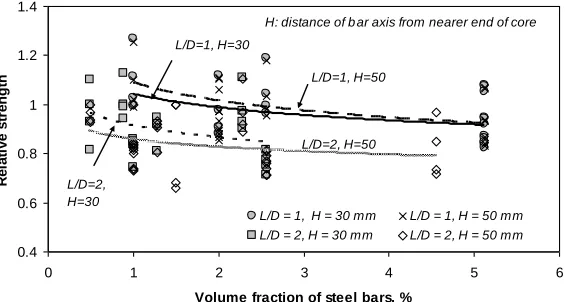
Fig. 7 exhibits the effect of distance of steel bars from nearer end of core (H) on overall variation of relative strength of cores versus steel volume fraction. This has been considered irrespective of concrete strength level, moisture condition and configuration of steel bars.
Fig. 7. Variation of relative strength ratio versus steel volume fraction for different values of L/D ratio and
H. It can be stated that the values of strength ratio related to H = 30 mm is obviously closer to 1 than those for 50 mm. Also, for a given L/D ratio, the effect of H on variations has a tendency to diminish with steel volume percentage. This finding demonstrates the significance of this major factor to permit the reliable interpretation of results of core containing steel bars.
It should be said that the highly scattering in values of relative strength is related to neglecting the effects of other influencing parameters, namely; concrete strength level, moisture condition and sizes of cores and steel bars.
For cores with L/D ratio of 1, the state of triaxial stresses prevails over the whole length of the core. Failure of concrete core in such situations is anticipated to be by crushing in the central region and by dilation of peripheral concrete. So, it may be expected that the presence of steel bars here has not harmful effect. However, for core specimens with L/D ratio of 2.0, in central portion which is subjected to a uniaxial compressive stress, presence of steel bar is likely to produce stress concentrations at its interface with the surrounding concrete which may be resulted and accelerated the failure of concrete test specimens in early bond failure [8]. Despite the fact these
0.4 0.6 0.8 1 1.2 1.4
0 1 2 3 4 5 6
Volume fraction of steel bars, %
R
e
la
ti
v
e
s
tr
e
ng
th
L/D = 1, H = 30 mm L/D = 1, H = 50 mm L/D = 2, H = 30 mm L/D = 2, H = 50 mm H: distance of b ar axis from nearer end of core
L/D=1, H=50
L/D=2, H=30
L/D=1, H=30
explanations need further experimental verification. Though, the current test results show that the effect of steel bars on core strength varies substantially with L/D ratio, irrespective of H values.
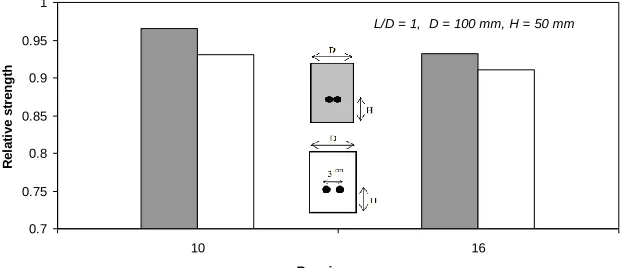
3.7. Effect of Symmetric Deviation of Bars from the Main Axis of Core
The effect of symmetric bars deviation on variation of core strength ratio for 10 and 16 mm diameter of steel bars is illustrated by Fig. 8. It can be stated that the mean values of relative strength is higher (closer to 1) for
one diameter distance of bars than those for 30 mm distance. For instance, according to this depiction for 10 mm bar size, the mean values of relative core strength are 0.966 and 0.932 concerning to one diameter symmetric distance of bars and 30 mm distance, respectively. However, the corresponding values are found to be 0.930 and 0.910 for 16 mm bar size. Moreover, the reduction is more significant for low strength concrete. This trend is similar to that obtained by Khoury et al. (2014) [9].
Fig. 8. Effect of symmetric deviation of bars on relative strength of cores for different bar sizes.
It is clearly revealed from results that the symmetric deviation of bars from the major axis of the core causes additional strength reduction; up to 11.5% for 16 mm bar size, as compared to corresponding core specimen but without deviation, up to 9.5%, providing other variable and uncertainty. This behaviour may be due to the damage through cutting operation and the developed stress concentration around steel bars, accelerated the failure of core. Similar findings have also been reported by Khoury et al. (2014) [9]. However, this result may be required further experimental examination.
4. Statistical Modeling
The major activity in statistics is the building of statistical models that hopefully reflect the
important aspects of the object of study with some degree of realism. In particular, the aim of regression analysis is to constructed mathematical models which describe or explain relationships that may exist between variables [16].
This part of the study presented here aims to predict the standard cube strength of concrete (fcube) by means of core test results as a
function of affecting parameters, namely, L/D ratio, core diameter (Dcore), size (drebar)
and number (Nrebar) of reinforcing bars,
symmetric deviation of bars from the main axis of core (SD), distance of bar axis from nearer end of core (H) and core strength (fcore) for two different curing regimes. In
other words, samples incorporated these parameters considered as explanatory
0.7 0.75 0.8 0.85 0.9 0.95 1
10 16
Bar size, mm
R
e
la
ti
v
e
s
tr
e
ng
th
(independent) variables and cube compressive strength regarded as the response (dependent) variable. It can be stated that while dealing with a large number of independent variables, it is important to derive the best combination of these variables to predict the dependent variable. So, fcube may be expected to be reasonably
related to the aforementioned variables by equation of the type:
(1)
4.1. Linear Models
The response variable y may be related to k regressor variables. The model
k ixi
y
1
0
is called a multiple
linear regression model with k regressor variables. This model describes a hyperplane in the k-dimensional space of the regressor variables. The method of least squares is typically used to estimate the regression coefficients,i,i0,1,...,k, in a multiple linear regression model [17]. SPSS (Statistical Package for the Social Sciences) was used to build the models.
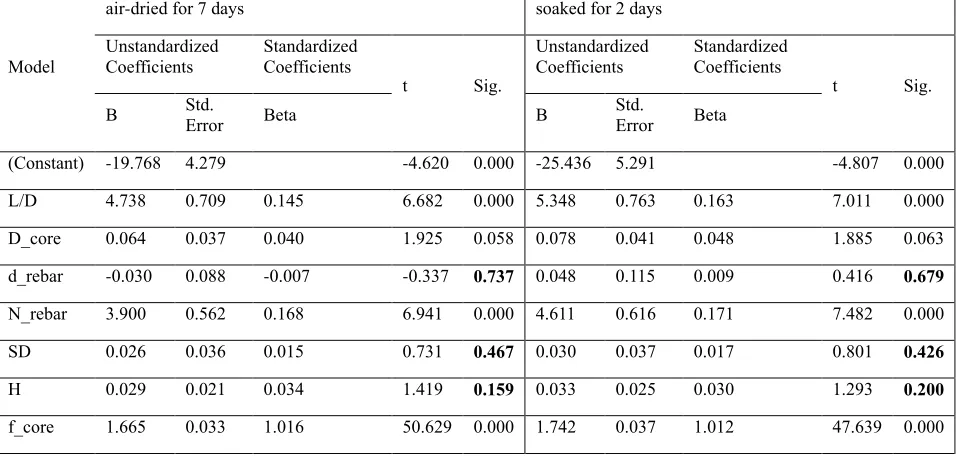
Significance of regression coefficients for estimation of cube compressive strength is listed in Table 2, which also shows the standardized regression coefficients, Beta, t-value (at the 95% confidence level) and Sig (p)-value.
Table 2. Significance of Regression Coefficients.
Model
air-dried for 7 days soaked for 2 days
Unstandardized
Coefficients Standardized Coefficients
t Sig.
Unstandardized
Coefficients Standardized Coefficients
t Sig.
B Std. Error Beta B Std. Error Beta
(Constant) -19.768 4.279 -4.620 0.000 -25.436 5.291 -4.807 0.000
L/D 4.738 0.709 0.145 6.682 0.000 5.348 0.763 0.163 7.011 0.000
D_core 0.064 0.037 0.040 1.925 0.058 0.078 0.041 0.048 1.885 0.063
d_rebar -0.030 0.088 -0.007 -0.337 0.737 0.048 0.115 0.009 0.416 0.679
N_rebar 3.900 0.562 0.168 6.941 0.000 4.611 0.616 0.171 7.482 0.000
SD 0.026 0.036 0.015 0.731 0.467 0.030 0.037 0.017 0.801 0.426
H 0.029 0.021 0.034 1.419 0.159 0.033 0.025 0.030 1.293 0.200
f_core 1.665 0.033 1.016 50.629 0.000 1.742 0.037 1.012 47.639 0.000
a. Dependent Variable: fcube
The t and Sig (p) values give a rough indication of the impact of each predictor variable in which a big absolute t-value and small p-value (< 0.05) suggests that a predictor variable is having a large impact on the criterion variable. In other words, the predictor variables with t-value less than 0.05
at the 95% confidence level is considered to be significant to the model. As mentioned above, with reference to Table 2, the variables d_rebar, SD and H are disqualified to be
regarded as effective variables in the obtaining linear models for both curing regimes, respectively. Also, it can be
L/D,Dcore,drebar,Nrebar,SD,H, fcore, fcube
0generally stated that the variables in the order of decreasing level of sensitivity based on the values of standardized regression coefficients are fcore, Nrebar , L/D and Dcore, respectively.
However, the Sig (p)-values of Dcore are
found marginally higher than the specified value of 0.05, it can not be conclusively proved for disregarding this factor.
4.2. Nonlinear Models
Mathematical models have been tentatively established to be applied to the estimation of the cube compressive strength of concrete. Then again, a nonlinear model could have been used based on the functions of
polynomial, rational, exponential, etc. or combination of them. However, it may often be valuable to know before-hand the expression that best describes the influence of independent variables on the response phenomenon. That expression could have been defined through an iterative process, by trying various equations until one is achieved that is fully capable of appropriately expressing the modeled process. Final decisions on the best forms are made after evaluation of all selected models. The general form of nonlinear prediction equation is as follows.
core
rebar rebar
corecube D H d N SD f
D L
f
0.1 4 5 6
2
1 1 1
/ 5 . 1
1 3
(2) Where aiare constants.
To the authors' knowledge, there has not been a study considering the effect of all these parameters simultaneously.
The major issue is to find an appropriate nonlinear function with statistically
well-adjusted coefficients, ai. Two separate models
concerning to the different curing condition were established. The coefficients of equations are determined through this analysis using Levenberg–Marquardt algorithm which has been presented in Tables 3.
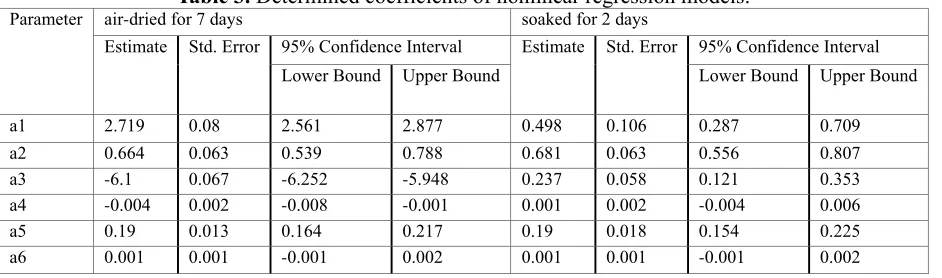
Table 3. Determined coefficients of nonlinear regression models.
Parameter air-dried for 7 days soaked for 2 days
Estimate Std. Error 95% Confidence Interval Estimate Std. Error 95% Confidence Interval Lower Bound Upper Bound Lower Bound Upper Bound
a1 2.719 0.08 2.561 2.877 0.498 0.106 0.287 0.709
a2 0.664 0.063 0.539 0.788 0.681 0.063 0.556 0.807
a3 -6.1 0.067 -6.252 -5.948 0.237 0.058 0.121 0.353 a4 -0.004 0.002 -0.008 -0.001 0.001 0.002 -0.004 0.006
a5 0.19 0.013 0.164 0.217 0.19 0.018 0.154 0.225
4.3. Comparison of Models
4.3.1. Modeling Performance Criterions
In general, the coefficient of determination between the measured and predicted values is a good indicator to check the prediction performance of the model. The higher the value of R2 means that there is a good correlation between the experimentally measured values and the predicted values using the developed models. As the number of independent variables increases, R2 will be greater. Therefore, R2 should be adjusted (
2 adj
R ). Besides, in this work, Root Mean Square Error (RMSE), Values Account For (VAF) and the mean absolute percentage error (MAPE) indices were calculated to compare the performance of the prediction capacity of predictive models developed.
2
2
1 1
1 R
p n
n
Radj
(3)
n y y
n RMSE
1
2 1
(4)
100var var
1
y y y
VAF (5)
n
y y y n MAPE
1
100 1
(6)
Where y, y’, p and n are the observed value, predicted value, the number of model parameters and the number of scenarios, respectively.
4.3.2. Performance of the Proposed Models
The error estimation parameters namely, 2 adj
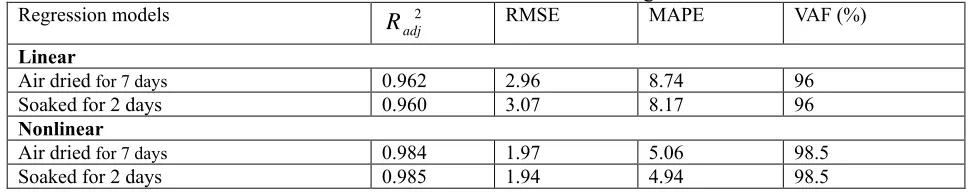
R , RMSE, MAPE, VAF, on the basis of the performance of the model are given in Table 4. The results of these statistical evaluations confirm the accuracy gained by the proposed relationships so that over 95% of the variation in response value can be explained by the fitted models. Moreover, with reference to this table, it can be emphasized the nonlinear equations proposed for the cube compressive strength prediction produced the most accurate results compared to linear equations.
Table 4. Statistical evaluations of linear/nonlinear regression models.
Regression models 2
adj
R RMSE MAPE VAF (%)
Linear
Air dried for 7 days 0.962 2.96 8.74 96
Soaked for 2 days 0.960 3.07 8.17 96
Nonlinear
Air dried for 7 days 0.984 1.97 5.06 98.5
Soaked for 2 days 0.985 1.94 4.94 98.5
It must be emphasized that the validity of models for various types of concretes and also outside the considered data range, which has been regarded in this study, requires
further verification and may be followed by a different pattern.
prediction ability of the nonlinear models. As can be seen from this figure, the actual and predicted values of cube compressive
strength are well correlated in which the representative points are generally closely congregated to the perfect prediction line.
(a)
(b)
Fig. 9. Experimental values versus predicted results; (a) air-dried samples, (b) soaked samples.
5. Interpretation of Results
Core test may be reliable; however the interpretation of the results may be uncertain. Actually, extensive literature survey indicates that different codes give different in-situ strength from one core test result.
Results of extensive laboratory tests obtained herein intensely confirmed that the variability the core strength is directly related to factors
influencing concrete core strength, namely; concrete characteristics as well as size, location and position of reinforcing bars. Based on the experimental findings, it is believed that a reduction in measured core strength occurs for a core containing reinforcing steel depending on the foregoing parameters and correction factor to account for this reduction (Freinf) depends on them.
Therefore, a complicated procedure may be necessary to obtain a reliable estimate of this
0 30 60
0 30 60
fcube_Experimental, MPa
fc
u
b
e
_
R
e
g
re
s
s
io
n
M
o
d
e
ls
,
M
Pa
Linear
Nonlinear
Air-dried samples fcube = 48.1 MPa
Line of Equality
fcube = 21.3 MPa
0 30 60
0 30 60
fcube_Experimental, MPa
fc
u
b
e
_
R
e
g
re
s
s
io
n
M
o
d
e
ls
,
M
Pa
Linear
Nonlinear
Soaked samples fcube = 48.1 MPa
Line of Equality
factor. Results of about 480 cores were considered with different configurations steel bar sizes of 10 and 16 mm. In general, the presence of reinforcing steel bars in the core samples reduces the measured core strength. Even when the correction factor is appropriate, it must be considered as an average value with some scatter around it. Thus, it is possible that in a particular case the one or more correction factors used are to be excessive. So, applying several correction factors, one after another, introduce additional uncertainties about the estimation of strength.
The authors believe that published strength correction factors, especially reinforcement correction factor, are not necessarily exact and may not be universally applicable because they have been derived empirically from specific sets of data.
In reference to sections 3.1 to 3.7, it could be generally stated that the correction factors of cores containing steel bars are dependent on the values of volume percentage of reinforcing bars, which are strongly interrelated; hence it is preferable to avoid the application of several corrections for each particular situation, independently.
From statistical analysis, it can be stated that the linear and nonlinear regression models have a great ability of modelling and prediction using experimental data, in which the coefficient of determination R2 in both
models indicate a significant high correlation. Moreover, the comparison of performance criterions of models revealed that the nonlinear model has higher prediction ability than the linear one. As a result, the researchers, having simultaneously considered factors such as fcore, L/D, Dcore,
drebar, Nrebar, SD and H, determined the
prediction of standard cube strength of concrete by applying the approaches that showed the highest reliability.
6. Conclusion
According to the results obtained experimentally, it could be generally stated that the measured strength of a core depends on factors that include the L/D ratio, core size, concrete strength level, curing condition and the presence of reinforcement. Considerable investigation has been carried out concerning these factors, with particular consideration of volume fraction of steel bars in cores and variation of cores strength ratio. Moreover, linear and nonlinear regression models were employed for predicting the standard cube strength based on core testing in the presence of reinforcing bars.
The following conclusions can be drawn from this investigation:
- It can be realized that presence of steel bars reduces considerably the strength of cores with L/D ratio of 2, but this effect decreases for L/D ratio of 1.
- It seems that compressive strength of core is improved by the inclusion of steel bars for cores with L/D ratio of 1 and steel inclusion lower than 2%.
- According to the experimental results obtained, it seems that as much as 3.5% by volume of reinforcement bars had no more decreasing effect on the measured strength of concrete cores, as this trend has a tendency to reach constant reduction values of 7% and 15% for L/D ratios of 1 and 2, respectively.
considered separately. However, for a specified value of steel volume fraction, a simple conversion factor may be applied to convert the strength of 75 mm diameter cores to the strength of standard 100 mm diameter cores.
- It is revealed that the correction factors is may be a function of the level of strength of the concrete. However, the difference of these functions has a tendency to decrease with steel volume percentage of core to reach constant relative strength value of 77% for steel volume fraction of 2.56%.
- Generally, the strength of cores left to dry in air for 7 days is found to be on average 9.4% greater than that of soaked cores before testing.
- As indicated in this paper, it can be stated that the relative strength ratio is not significantly changed as a function of steel volume fraction, within the range of 0.5-5.12%, for a specific moisture condition. So, it seems that the moisture condition of core has only secondary influence upon test.
- It is observed that, for a specified bar size, relative strength is declined by the inclusion of steel bars. However, it is difficult to infer from this observation the actual factor that caused the decrease in relative strength.
- It can be stated that the values of strength ratio related to H (distance of steel bars from nearer end of core) value of 30 mm is obviously closer to 1 than those for 50 mm. This difference has a tendency to decease with steel volume percentage.
- It is clearly revealed from results, the symmetric deviation of bars from the major axis of the core causes additional strength reduction; up to 11.5% for 16 mm bar size, as
compared to corresponding core specimen but without deviation, up to 9.5%.
- The results obtained from the regression models showed a great degree of accuracy with the experimental results for both linear and nonlinear models considered, indicating the reliable prediction of standard cube strength based on core test results, including reinforcing bars. Also, results showed that the nonlinear equations provided most accurate results compared to linear models.
REFERENCES
[1] Bungey JH, Millard SG and Grantham MG (2006) Testing of concrete in structures. Fourth ed., Taylor & Francis, London and New York, 352p.
[2] Bungey JH (1979) Determining concrete strength by using small-diameter cores. Magazine of Concrete Research 31(107): 91-98.
[3] Neville AM (1996) Properties of concrete. Fourth ed., John Wiley and Sons, Inc., New York, 844p.
[4] Meininger RC, Wagner FT and Hall KW (1977) Concrete core strength-the effect of Length to Diameter ratio. Journal of Testing and Evaluation, 5(3): 147-153. [5] Yip WK and Tam CT (1988) Concrete
strength evaluation through the use of small diameter cores. Magazine of Concrete Research, 40(143): 99-105. [6] Munday JGL and Dhir RK (1984)
Assessment of in situ concrete quality by core testing. In Situ/Nondestructive Testing of Concrete. SP-82, American Concrete Institute, Detroit, 393-410. [7] Gaynor RD (1965) Effect of horizontal
reinforcing steel on the strength of molded cylinders. J. Am. Concr. Inst., 62(7): 837-840.
[9] Khoury S, Aliabdo AA and Ghazy A (2014) Reliability of core test – Critical assessment and proposed new approach. Alexandria Engineering Journal 53: 169– 184.
[10] Neville A (2001) Core tests – Easy to perform, not easy to interpret. Concrete International, 23(11): 59–68.
[11] ASTM (2008) C42: Standard method of obtaining and testing drilled cores and sawn beams of concrete. American Society for Testing and Materials, Philadelphia. [12] Meininger RC (1968) Effect of core
diameter on measured concrete strength. Journal of Materials, 3(2): 320-336. [13] Lewis RK (1976) Effect of core diameter on
the observed on the strength of concrete cores. Research Report No.50, Commonwealth Scientific and Industrial Research Organization, Division of Building Research, 13 pp.
[14] Campbell RH and Tobin RE (1967) core and cylinder strengths of natural and lightweight concrete. ACI Journal, Proceedings 64(4): 190-195.
[15] Bartlett FM and MacGregor JG (1994) Effect of Moisture Condition on Concrete Core Strengths. ACI Materials Journal, 91(3): 227-236.
[16] Seber GAF and Lee AJ (2003) Linear Regression Analysis. Second Edition, John Wiley & Sons Inc