Estimation of zeolite application effect on solute transport
parameters at different soils using HYDRUS-1D model
M. Fooladi Dorhani
*, A. R. Sepaskhah
Department of Water Engineering, Faculty of Agriculture
,
Shiraz University, Shiraz, I. R. Iran*Corresponding Author: [email protected]
ARTICLE INFO ABSTRACT-Application of models for simulation of solute and pollutants transport in soil can reduce time and costs for remediation process. HYDRUS-1D model was developed to simulate the one–dimensional flow of soil water, heat, solute and viruses in variably saturated–unsaturated porous media. The objective of this investigation is to determine the solute transport parameters in disturbed soil columns with different textures at different rates of zeolite application using HYDRUS-1D model. For this study, the loam soil, the sandy loam soil and the clay loam soil with zeolite application rates of 0 (control) and 8 g kg-1 were used. The approximate concentration of effluents
measured by other investigators (0-2.26 mg cm-3) is used to determine the transport
parameters. The value of immobile water content ( im) decreased and the value of hydrodynamic dispersion coefficient increased in lighter soil texture. According to hydraulic parameters considered and regression equation proposed by other researchers, the decreasing trend of im is valid with increasing saturated hydraulic conductivity. The predicted dispersivity ( ) in control treatment was in the range of value of for disturbed soil reported by other researchers. The trend of solute transport parameters calculated by breakthrough curve using the analytical method by other researchers is similar to the estimated values by the HYDRUS-1D model. The values of Willmott’s agreement index are more than 90% for all soil treatments and normalized root mean square error is about 20% for most treatments that indicated the good accuracy of model for predicting solute transport coefficients.
Article history: Received 7 May 2016 Accepted 16 October 2016 Available online 8 July 2017
Keywords: Chloride
Inverse simulation HYDRUS-1D
Solute transport parameters Zeolite
INTRODUCTION
The environmental pollution is a global problem that occurs as a result of several factors such as soil erosion, indiscriminate disposal of fertilizers, pesticides, sediment and other organic matter and minerals. Solute transport in the soil can affect the quality of surface water and groundwater resources. In recent years, many laboratory and field studies on the solute transport have been conducted (Jaynes et al., 1988). In order to
minimize contamination, Abu zreig and Abuashour
(2004)investigated Atrazine dissipation using disturbed soil columns under saturated condition in the sandy loam and loam soils. Also, the chloride transport was studied as an inert tracer. The results indicated that the hydrodynamic dispersion coefficient is much higher in sandy loam soil than in loam soil for two solutes. Therefore, the leaching of Atrazine in sandy loam soil is much higher due to macro pores and pore–water velocity. Investigations of solute transport are important in many processes of edaphology and water, such as contamination of soil and groundwater resources and leaching of nutrient in the soil. Describing these processes is required to gain a deeper knowledge of the modeling of solute transport in soil. A wide range of models exist for simulation of solute transport in soil
(van Genuchten and Wagenet,1989). Solute transport is expressed by different mathematical equations. The knowledge of solute transport behavior depends on the accurate determination of the transport parameters in the equation. There are several methods to determine or estimate the solute transport parameters. Inverse estimation of the solute transport parameters is mainly limited to the one-dimensional analysis in the laboratory. By application of models, it is possible to predict the movement of solutes and pollutants in soil with less expensive and less time consuming experiments. HYDRUS-1D model is used to simulate the one-dimensional flow, heat and solute in porous media at saturated-unsaturated conditions. Furthermore, this model takes to account all processes such as different initial conditions, boundary input and output of water and solute and root water uptake (Simunek et al.,1998). Previous studies have shown that water flow and solute transport processes are influenced by zeolite application (Pepper et al., 1982;Sepaskhah and Yousefi, 2007), soil type (Tabarzad et al., 2011; Saadat et al., 2012), field and laboratory experiments (Abbasi et al., 2003), undisturbed and disturbed soils(Tabarzad et al., 2011; Saadat et al., 2012) and initial water content and
32 application of tracer type (Katterer et al., 2001). Zeolite
application increased the pore water velocity and prevented the leaching ammonium under saturated condition (Sepaskhah and Yousefi,2007;Moradzadeh et
al., 2014), and application of zeolite to sandy soil
increased the soil water retention and decreased leaching of ammonium and nitrate (Pepper et al., 1982). Tabarzad et al. (2011) investigated mass exchange coefficient (&) and immobile water content ( im) of
undisturbed soils with different textures in laboratory and saturated condition. A solution of CaCl2 was used as an input tracer. Results indicated that the value of &
has decreased and im has increased in heavier soil
textures. Furthermore, the coupled of HYDRUS-1D and PHREEQC models was applied to simulate the transport of heavy metals and other substances in the soil. The results of simulation of long-term leaching of heavy metals (Cd, Zn, Pb), soil dominant cations and chloride in a contaminated soil profile by using the coupled model indicated that it can be used in the saturated and unsaturated conditions (Jacques et al., 2002). Moradi et al. (2005) simulated Cd profile in the lime soil treated with sewage sludge after 185 and 617 days using MACRO and HYDRUS models. Results of a recent study indicated that the results of Macro model can be in good agreement with observations. In order to study the effects of potassium zeolite application on nitrate and ammonium ions sorption and retention, a research has been conducted in a sandy loam soil under saturated condition in which Ca-K-zeolite application increased the pore water velocity, and prevented the leaching of ammonium. Also, solute transport parameters were estimated with physical equilibrium convection-dispersion (CDE) and physical non-equilibrium mobile-immobile (MIM) transport models inversely using HYDRUS-1D code (Moradzadeh et al., 2014). The MIM method predicted the observed breakthrough curves better than the CDE model for chloride transport
in porous media (Jacques et al., 2002). Moreover,
HYDRUS-1D model was applied for simulating the nitrate leaching and deep percolation from furrow irrigation fields with a very high accuracy (Tafteh and Sepaskhah, 2012). Abbasi et al. (2003) estimated the solute transport parameters and the soil hydraulic properties under transient conditions. They estimated the solute transport parameters in CDE and MIM transport models inversely by HYDRUS-2D. Results showed that the value of im did not play an important
role in the optimization process. Estimated values of &
and im were larger than those reported for laboratory
soil columns by HYDRUS-1D model. Studying solute transport and water flow is necessary in Iran, where farmers are using large amounts of fertilizers, especially nitrogen fertilizers that are easily transported in soil with heavy irrigation and low efficiency. That being so, the objective of this investigation was to determine the
solute transport parameters of chloride in disturbed soil columns with clay loam, loam and sandy loam soils at the zeolite application rates of 0 and 8 g kg-1 soil using an inverse method by HYDRUS-1D model.
MATERIALS AND METHODS
Experiments
The experiment was carried out as a complete randomized block design with three replications at Irrigation Laboratory, Department of Water Engineering, College of Agriculture of Shiraz University (I. R. of Iran). A loam, sandy loam and clay loam soil with zeolite application rates of 0 (control) and 8 g kg-1 were used. The data used for this research were obtained from a research project reported by Saadat et al. (2012). The physical properties of the soils are listed in Table 1. Those researchers intended to determine the effects of the application rate of zeolite on
im and & in different soils. Furthermore, as they
mentioned, in disturbed soil column, the physical non-equilibrium mobile-immobile (MIM) model was proposed to study the solute transport parameters such as im,&and
hydrodynamic dispersion coefficient (Dh) (Saadat et al.,
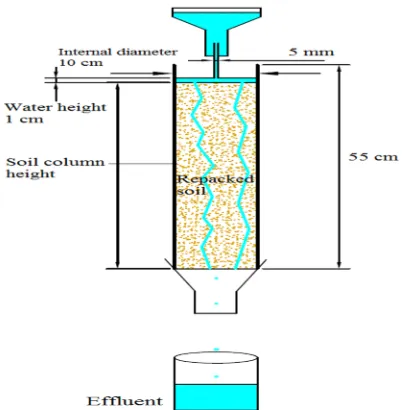
2012). The experimental set up is shown in Fig.1. The used columns in this study were PVC tubes of an inside diameter of 10.5 cm and height of 50 cm. According to soil treatments, the mixture of different soils and zeolite application rates were placed in columns. At the specified height from the PVC tube bottom, two holes were made for inlet and outlet of water. By this method, a constant water height of 1.0 cm was held on the soil surface. A stainless still screen was used as the soil support at the bottom of the column. Before re-packing the soil in the column, it was air-dried and passed through a 2-mm screen and mixed with zeolite at application rates of 0 and 8 g kg-1 soil. Then, each soil column was slowly saturated from bottom in the laboratory. A solution of CaCl2at salinity of 6 and 7 dS m-1 was prepared for the input tracer. Effluent solutions were collected in small plastic bottles at a fixed volume aliquot.
The hydraulic conductivity was determined by the outflow volume at different times with a water head at the surface soil (Fig. 1). The measured salinity of the outflow was converted to the concentration of Cl- by using the relationship between salt concentration (meq Lit-1)-salinity (dS m-1) for CaCl2 solution (Richards, 1954). The soil saturated hyraulic conductivity (Ks) was
determined using Darcy’s law. Furthermore, the values of initial, minimum and maximum of dispersivity ( ), &
and im were defined in the model for different zeolite
33
Table 1. Physical propertiesaof the experimental soils
Texture Depth Sand Silt Clay Porosity Bulk density Ks Ks Depth of the soil column
(cm) (g cm-3) (cm3cm-3) (cm min-1) (cm)
Loam 0-20 40 47 13 44 1.24 0.401 0.077 42
20-55 40 36 24
Clay loam 0-30 22 42 36 52 1.27 0.461 0.053 30
Sandy loam 0-30 71 19 10 43 1.52 0.384 0.090 30
aK
s: Saturated water content and Ks: Saturated hydraulic conductivity
Fig. 1. Schematic illustration of the apparatus used to measure breakthrough curves
Mathematical Models and Inverse Solution Water Flow
One-dimensional uniform (equilibrium) water movement in porous medium is described by the Richards equation as follows:
+
= ( ) cos
) ( z h h K z t h (1)
where his pressure head (L), (h), soil volumetric water content (L3L-3), t, time (T), z, spatial coordinate (L)
(positive upward), ), angle between the flow direction and the vertical axis (i.e., )=0ofor vertical flow, 90ofor horizontal flow), and K(h), unsaturated hydraulic conductivity function (LT-1).
Soil Hydraulic Properties
The soil water retention curve, h, was described using
the closed-form equation of van Genuchten (1980) and the unsaturated hydraulic conductivity, K(h), using the pore-size distribution model of Mualem (1976) as follows:
( )
[
n]
mr s r h h + + = 1 (2) 2 1
)
1
(
1
)
(
=
m me l
e
s
S
S
K
h
K
(3) Where r s r eS
=
(4)n
m
=
1
1
(5)where Serepresents effective saturation [dimensionless],
K(h), unsaturated hydraulic conductivity (LT-1), Ks,
saturated hydraulic conductivity (LT-1), h, soil water
pressure head (L), h, s and r, soil volumetric water
content, saturated and residual, respectively (L3L-3), , m
and n, empirical parameters of van Genuchten function and
l, tortuosity parameter in the conductivity function which was assumed to be 0.5.
Governing Solute Transport Equations
Solute transport is an important issue. The mobile-immobile model (MIM) is used to study the transport of solutes. In this model, space of water-filled pore is divided into two regions; the mobile water content, where solute transport is described by convection and dispersion, and the immobile water content, where solute is moved just by diffusion. MIM can be written as follows (van Genuchten and Wierenga, 1976):
z
c
q
z
c
D
t
c
t
c
m m m m h im im mm
+
=
22
(6)
)
(
m imim
im
c
c
t
c
=
(7) im m+
=
(8)where represents total volumetric soil water content (L3L-3),
m and im, mobile and immobile soil water
content (L3L-3), respectively, cmand cim, concentrations
of solute in mobile and immobile domains (ML-3),
respectively, t, time (T), &, mass exchange coefficient between mobile and immobile domains (T-1), D
h,
hydrodynamic dispersion coefficient (L2T-1).
Analytical Method
One of the problems for using MIM model is estimating necessary parameters i.e. im, & and Dh. Clothier et al.
(1992) assumed that if the concentration is stable, &can be ignored, so im can be estimated by the final relative
concentration. Jaynes et al. (1995) determined im and &
by applying a sequence of tracer:
) ( ) 1 ( im im o Ln t c c
Ln = + (9)
34 occupant soil solution concentration. im and & can be
estimated by plotting Ln(1-c/co) vs t. (Jaynes et al., 1995).
By considering the advection – dispersion equation
(CDE), Dh is determined as follows (Kirkham and
Powers,1972): ) 4
/( S2
L
Dh = (10)
where Sis the slope of tangent line on BTCsat reflection
point (T), v, the mean pore water velocity (L T-1) and L, the length of soil column (L).
Boundary and Initial Conditions
Solving Eq. (1) requires defining boundary condition (BC). In this study, the constant pressure head and the seepage face were used as the upper and lower BC, respectively. The water pressure head of 1 cm was applied to the soil column during all experiments. The seepage face is often applied to laboratory soil columns when the bottom of the soil column is exposed to the atmosphere (i.e. gravity drainage of a finite soil column). However, when the lower end of the soil profile becomes saturated, a zero pressure head is imposed at the lower boundary and the outflow is calculated accordingly. The initial condition was determined according to the soil water pressure heads that were considered constant during the experiment at the upper and lower ends of the soil column.
The solution of Eq. (6) requires the initial
concentration and BC to be given. Therefore, in the
model application, the concentration of Cl-entering the soil column was used as the upper BC. The zero concentration gradient was used for lower BC because the soil columns were in contact with air at the bottom. The initial condition was determined according to the liquid phase concentrations (mass of solute/volume of water) which is used because the solute is dissolved in water and added to the soil.
Inverse Solution
The inverse solution was based on numerical solution of the MIM transport model and the Richards equation inversely using the Levenberg-Marqardt optimization algorithm. The optimization of parameters is an indirect method of simulating solute transport parameters from the data of solute transport experiment. Inverse methods are generally based on minimizing the objective function, which represents differences between the measured variables and the corresponding model prediction (e.g., concentration at different times in flow domain). The solute transport parameters, &, im and
P coefficient are simulated by HYDRUS-1D using
inverse method. After defining initial values, the model changes each parameter and then, sum of
squares (SSQ) is computed and the variables are
obtained after SSQ takes a minimum value. SSQ is a criterion to finish the running program which is calculated as follows(Moradzadeh et al., 2014):
2
1
)
(
Obs Simn i
Xi
i
X
SSQ
=
= (11)where Xiobs and Xisim are values of observation and
simulated concentrations of chloride by model, respectively.
In simulation with the HYDRUS-1D model, the soil profile was represented by 101 elements of equal length. Initial estimates of the assumed unknown solute transport parameters are then iteratively adjusted and improved by minimization procedure until a desired degree of precision is obtained. The chloride concentration was used in the inverse optimization to estimate simultaneously the MIM transport parameters while other parameters were fixed during the optimization.
Statistical Evaluations
Normalized root mean square error (NRMSE) and Willmott’s index of agreement (d) were used to evaluate the model accuracy as follows:
= =
+
= n
i i i
n
i i i
O P O P d 1 2 1 2 ) ( ) ( 1 (12) 100 * ~ ) ( 1 2 O N O P NRMSE n
i= i i
= (13)
where Pi, Oi, Õ and n represent values of predicted,
measured, mean measured and number of observations, respectively (Jamieson et al., 1991).
RESULTS AND DISCUSSION
HYDRUS-1D Model Calibration
For model calibration, the data of breakthrough curves (BTCs) for one replication in each treatment are used in
different solis.
Loam Soil
The BTCsof the observed data and those simulated by
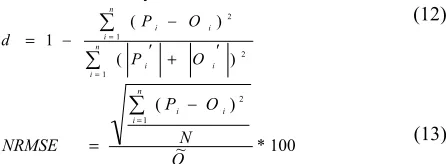
the model are presented in Fig. 2 at different zeolite application rates. Results of the solute transport parameters by the model at different treatments are shown in Table 2. Due to the low value of SSQ (Table 2), the measured values are in good agreement with the predicted values. In our study, it was observed that increasing the zeolite application resulted in the decrease of values of im and &. The maximum and
minimum values of im were 0.211 cm3cm-3 and 0.059
cm3 cm-3, respectively. The maximum and minimum
values of Dhwere 2.26 cm2min-1 at rate of 8 g kg-1 soil
and 0.037 cm2min-1 at control, respectively. Results of statistical index for the regression between the observed and estimated values of Cl- concentration are listed in Table 3 during the model calibration. The coefficient of determination (R2) for the regression lines were higher
35 of d were higher than 0.97 for all treatments, which
indicated a high accuracy of the prediction by the
HYDRUS-1D model. The values of NRMSE were less
than 20 % for control treatment. Furthermore, according to the average of predicted and measured values, the
maximum difference was observed at 8 g kg-1 soil
zeolite application rate.
Fig. 2. Simulation of leaching using MIM model for one replicate of loam soil at zeolite application rates: (a) 0 g kg-1; (b) 8 g kg-1
Clay Loam Soil
The BTCsof the observed data and the ones simulated
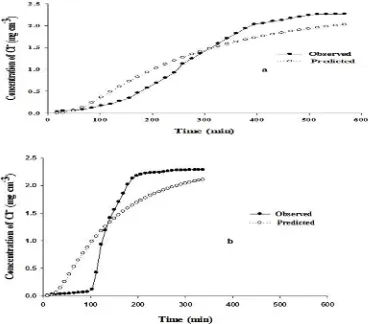
by the model are presented in Fig. 3at different zeolite application rates. Results of the solute transport parameters by the model at different treatments are shown in Table 2. Due to low SSQ values (Table 2), the measured values were in good agreement with the predicted values. It was found that by increasing the zeolite application, the values of im, and & decreased.
The maximum and minimum values of im were 0.134
cm3 cm-3 and 0.083 cm3 cm-3, respectively. The
maximum and minimum values of Dhwere 0.0915 cm2
min-1 at rate of 8 g kg-1 soil and 0.0219 cm2min-1 at rate of 0 g kg-1 soil, respectively. The regression between the observed and estimated values of Cl-concentration and the results of statistical index are listed in Table 3. The
R2values for the regression lines were higher than 0.95
for all treatments. A high accuracy of the prediction was obtained for zeolite application rate of 8 g kg-1. The
values of d were higher than 0.98 for all treatments, which indicated a high accuracy of the prediction by
HYDRUS-1D model. The values of NRMSE were less
than 20% for all treatments. According to R2 values
(Table 3), the accuracy of the model is higher for zeolite application rate of 8 g kg-1.
Fig. 3. Simulation of leaching using MIM model for one replicate of clay loam soil at zeolite application rates: (a) 0 g kg-1; (b) 8 g kg-1
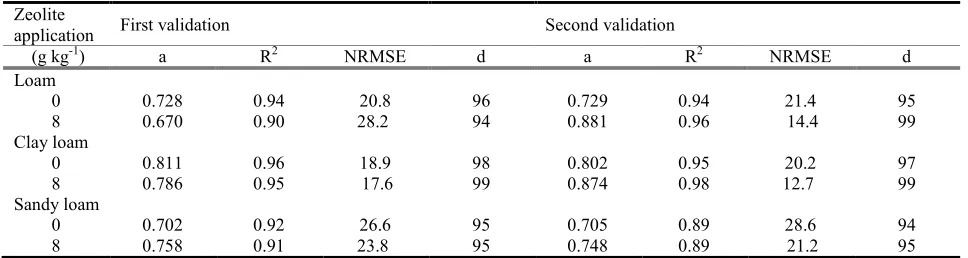
Sandy Loam Soil
The BTCsof the observed data and those simulated by
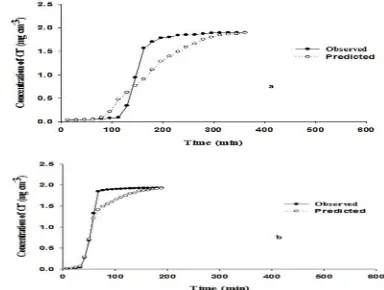
the model are presented in Fig. 4 at different zeolite application rates. Results of the solute transport parameters by the model at different treatments are shown in Table 2. Due to low values of SSQ (Table 2), the measured values were in good agreement with the predicted values. Results indicated that by increasing the zeolite application rates, the values of im and &
decreased. The maximum and minimum values of im
were 0.0531 cm3cm-3 and 0.0066 cm3cm-3, respectively.
The maximum and minimum values of Dhwere 6.33
cm2min-1 at rate of 8 g kg-1 soil and 0.4789 cm2min-1 at
rate of 0 g kg-1 soil, respectively. The regression
between the observed and estimated values of Cl
-concentration, and the results of statistical index are listed in Table 3.
Table 2. The average of solute transport parametersaat different treatments of different soils predicted by HYDRUS-1D model
Zeolite
application SSQ P S Kim v Dh
(g kg-1) (cm) (min-1) (cm3cm-3) (cm min-1) (cm2min-1) Loam
0 0.131 0.25 0.00451 0.211 0.148 0.037
8 0.167 8.119 0.000001 0.059 0.278 2.26
Clay loam
0 0.067 0.215 0.0014 0.134 0.102 0.022
8 0.083 0.57 0.0005 0.083 0.161 0.092
Sandy loam
0 0.184 2.29 0.00001 0.053 0.209 0.479
8 0.150 16.03 0.000002 0.007 0.395 6.330
aP: Dispersivity, T: Mass exchange coefficient, K
im: Immobile water content, Dh: Hydrodynamic dispersion coefficient and v:
36
Table 3. Results of statistical evaluations for HYDRUS-1D model calibration for one replicate for different soils Zeolite
application (g kg-1)
Number
of data Eq of linear regressiona Average of
observation Average of predicted NRMSE da
Loam
0 33 cSim= 0.764 cObs+ 0.273 R2=0.95 1.25 1.23 19.9 97.2
8 36 cSim=0.668 cObs+ 0.408 R2=0.90 1.38 1.33 28.2 94.1
Clay loam
0 24 cSim=0.808 cObs+ 0.202 R2=0.96 1.07 1.06 19.8 98.0
8 24 cSim=0.860 cObs+ 0.145 R2=0.98 1.14 1.13 12.7 99.7
Sandy loam
0 22 cSim= 0.818 cObs+0.100 R2=0.91 1.15 1.05 24.7 96.6
8 22 cSim=0.898 cObs+0.030 R2=0.97 1.47 1.3 13.2 98.4
ac
obs and csim are the concentration of measured and predicted (mg cm-3) by HYDRUS-1D model, respectively, d is the index of agreement
The R2values for the regression lines were higher than
0.9 for all treatments. A high accuracy of the prediction was obtained for 8 g kg-1 zeolite application rate. The values of d were higher than 0.95 for all treatments, which indicated a high accuracy of the prediction by
HYDRUS-1D model. According to R2values (Table 3),
the accuracy of the model was higher for 8 g kg-1 zeolite application rate.
It is possible that the physical soil condition was considered in a way which was not completely real and the input coefficients into the model for water and solute transport did not match the soil condition. Actually, the average of coefficients was considered for the model to achieve the best fit. Therefore, the fitness may be overestimated or underestimated.
Fig. 4. Simulation of leaching using MIM model for one replicate of sandy loam soil at zeolite application rates: (a) 0 g kg-1; (b) 8 g kg-1
In different conditions, the soil column shows different values of the chloride concentration. At the beginning of the curve, the prediction of concentration is overestimated and at the end of the curve, it is underestimated. Also, in the phenomenon of solute transport in structured soil, at the beginning of the transportation, the water transport is faster because of
macropores presence and gerater Dh, so the model
overestimates. At the end of the curve, diffusion and dispersion phenomenon and the difference in concentration in pores because of macropores in the soil have less effect on the transportation and the soil has achieved a steady state condetion.
In addition, a little air may be caupturel in the soil column when it is saturated. Actually, the model assumes that the soil is completely saturated although it is not the case. There fore, at first, the model overestimates, but the soil is going to be gradually saturated by transporting action through the soil column and achieving steady state. As a result, the estimation at the end is better.
Comparison Between the Analytical Method and HYDRUS-1D Model
The reported values of & and im (Saadat et al., 2012)
that were determined by using the analytical method and the predicted values by HYDRUS-1D model are shown in Table 4.
Table 4. Solute transport parametersadetermined using analytical
method as reported by Saadat et al., (2012) and predicted by HYDRUS-1D model
HYDRUS-1D model Analytical method Zeolite
application T Kim T Kim
(g kg-1) (min-1) (cm3cm-3) (min-1) (cm3cm-3)
Loam
0 0.005 0.211 0.001 0.214
8 0.000001 0.059 0.0007 0.085
Clay loam
0 0.0014 0.134 0.0009 0.179 8 0.0005 0.083 0.0007 0.110 Sandy loam
0 0.00001 0.053 0.0002 0.047 8 0.000002 0.007 0.0002 0.020
aT:Mass exchange coefficient; K
im: Immobile water content
The model predicted values of im showed closer
values in sandy loam and loam soils compared with the
analytical method. It was shown that im was
significantly reduced by about 1.5% and 30% compared with the analytical method in loam soil at zeolite application rates of 0 and 8 g kg-1 soil, respectively. Also, it was indicated that im was significantly reduced
by about 25% and 24% compared with the analytical method in clay loam soil at zeolite application rates of 0 and 8 g kg-1 soil, respectively. im was significantly
37 Overall, the HYDRUS-1D model was slightly more
accurate in the light soil. The simulated im using the
model was similar to the values reported by Tabarzad et al. (2011) at control treatment at heavy soil texture. According to the results, by using the HYDRUS-1D model, the inverse method was not acceptable for estimation of & at 8 g kg-1 zeolite application rate at different soils. Therefore, for this parameter, the experimental measurement is very important for determining solute transport parameter.
Effect of Zeolite on Solute Transport Parameters
Results showed that the values of Dh generally
increased due to zeolite application in different soil textures. This is consistent with the results reported by Moradzadeh et al. (2014) for ammonium and nitrate ion at different zeolite
application rates. The variation of Dh in different
soil textures with the zeolite application rates was proportional to the variations of the pore water
velocity. The maximum value of Dh was observed
in sandy loam soil with the maximum of pore
water velocity. The values of Dh ranged between
0.022 and 6.33 cm2 min-1 in different soil textures.
Results showed that the values of im and &
generally decreased due to zeolite application. The
values of im ranged between 0.0066 and 0.2108
cm3 cm-3 in different soil textures. The changes of
Dh value are related to soil clay content. The soil
texture is an important factor influencing the
solute dispersion. The values of simulated by
using the HYDRUS-1D model at control treatment
are closer to the values of reported by other
researchers in disturbed soil.
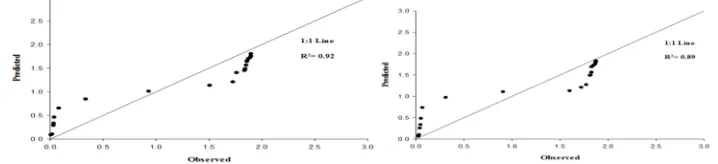
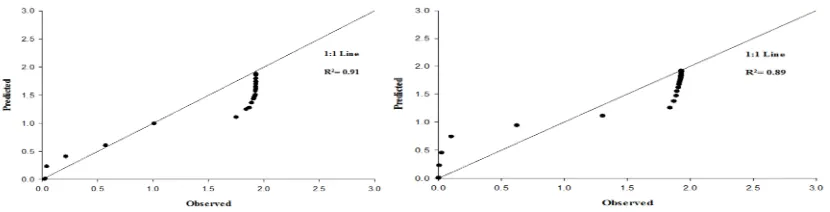
HYDRUS-1D Model Validation
After calibration of the HYDRUS-1D model by inverse method and fitting the solute transport parameters, the
BTCsof other two replications for each treatment were
used for model validation as first and second validation. For validation, the model was run using the fitted solute transport parameters and the results were compared with
the measured BTCsby a linear relationship and dvalues.
The results of model validation are shown in Table 5 for different soils. During the model validation, the slope of line (a) was less than 1.0 for all treatments, indicating that the estimated values were less than the observed values of concentration. Generally, the values of R2 for
loam and clay loam soils were higher than those for sandy loam soil for all treatments. These values for model validation varied between 0.89 and 0.99. Regarding the model validation indices, BTCsprediction
for clay loam and loam soils were more accurate than
that of BTCs for sandy loam soil. Results of model
validation are presented in Figs. 5 to 10 at different zeolite application rates.
CONCLUSIONS
Results of this study showed that the maximum value of
im occurred in clay loam soil. They also indicated that
the value of im decreased when the soil texture become
lighter (sandy loam). According to hydraulic parameters and the regression equation reported by other researchers, the decreasing trend of im is consistent
with the increase of observed hydraulic conductivity.
The imsimulated by using the HYDRUS-1D model at
control treatment was similar to the values of im
reported by other researchers in undisturbed soil. The values of im by using the analytical method reported by
other researchers was higher than those simulated by
using the HYDRUS-1D model. The value of Dh
increased in coarse soil textures. The trend of increase or decrease in experimental results was similar to the estimated parameters by using the HYDRUS-1D model with the calculated solute transport parameters by using the BTCsin the analytical method. The values of dwere
higher than 0.9 for all treatments in loam, clay loam, and sandy loam soils, which indicated a good accuracy of the prediction by HYDRUS-1D model. Results showed that the HYDRUS-1D model underestimated &
parameter at 8 g kg-1 zeolite application rate.
Table 5. Results of statistical evaluation*for HYDRUS-1D model validation for different soils
Zeolite
application First validation Second validation
(g kg-1) a R2 NRMSE d a R2 NRMSE d
Loam
0 0.728 0.94 20.8 96 0.729 0.94 21.4 95
8 0.670 0.90 28.2 94 0.881 0.96 14.4 99
Clay loam
0 0.811 0.96 18.9 98 0.802 0.95 20.2 97
8 0.786 0.95 17.6 99 0.874 0.98 12.7 99
Sandy loam
0 0.702 0.92 26.6 95 0.705 0.89 28.6 94
8 0.758 0.91 23.8 95 0.748 0.89 21.2 95
*a: The slope of fitting line between predicted and observed values; R2: The coefficient of determination, d: Index of agreement,
38
Fig. 5. Measured versus predicted (using MIM transport model) for loam soil at zeolite application rate 0 g kg-1
Fig. 6. Measured versus predicted (using MIM transport model) for loam soil at zeolite application rate 8 g kg-1
Fig.7. Measured versus predicted (using MIM transport model) for clay loam soil at zeolite application rates 0 g kg-1
Fig.8. Measured versus predicted (using MIM transport model) for clay loam soil at zeolite application rates 8 g kg-1
Fig. 9. Measured versus predicted (using MIM transport model) for sandy loam soil at zeolite application rate 0 g kg-1
ACKNOWLEDGEMENTS
This research was supported in part by a research project funded by Grant no. 95-GR-AGR 42 of Shiraz
39
Fig. 10. Measured versus predicted (using MIM transport model) for sandy loam soil at zeolite application rate 8 g kg-1
REFERENCES
Abbasi F., Simunek, J., Feyen, J., vanGenuchten, M.T., Shouse, P.J., &Bowman,A. (2003). Simultaneous inverse estimation of soil hydraulic and solute transport parameters from transient field experiments: homogeneous soil. American Society of Agricultural Engineers, 46(4), 1085-1095.
Abu Zreig, M., & Abu Ashour, J. (2004). Chloride and atrazine transport through saturated soil columns. Toxicological & Environmental Chemistry, 86, 181-190 Clothier, B.E., Khirkham, M.B., & McLean, J.E. (1992). In
situ measurements of the effective transport volume for solute moving through soil. Soil Science Society of America Journal, 56, 733-736.
Jacques, D., Simunek, J., Mallants, D., & van Genuchten, M.T. (2002). Multicomponent transport model for variabley-saturated porous media: Application to the transport of heavy metals in soils. Proceedings of XIVth.
International Conference on Computational Methods in Water Resources (CMWRXIV), 47, 555-562.
Jamieson, P.D., Porter, J.R., & Wilson, D.R. (1991). A test of computer simulation model ARC-WHEAT 1 on wheat crops grown. New Zealand Field Crop Research, 27, 337-350. Jaynes, D.B., Rice, R.C., & Bowman, R.S. (1988).
Independent calibration of a mechanistic-stochastic model for field-scale solute transport under flooded irrigation. Soil Science Society of America Journal, 52, 1541-1546. Jaynes, D.B., Logsdon, S.D., & Horton, R. (1995). Field
method of measuring mobile/immobile water content and solute transfer rate coefficient. Soil Science Society of America Journal, 59, 352–356.
Katterer, T., Schmied, B., Abbaspour, K.C., & Schulin, R. (2001). Single-and dual-porosity modeling of multiple tracer transport through soil columns:effect of intial moisture and mode of application. European Journal of Soil Science, 52, 25-36.
Kirkham, D,. & Powers, W.L. (1972). Advanced soil physics, New York: Wiley.
Moradi, A., Abbaspour, K.C., & Afyuni, M. (2005). Modling field-scale cadmium transport below the root zone of a sewage sludge amended soil in arid region of Central Iran. Contamin. Hydrology Journal, 42, 99-111.
Moradzadeh, M., Moazed, H., Sayyad, G.A., & Khaledian, M.R. (2014). Transport of nitrate and ammonium ions in a sandy loam soil treated with potassium zeolite – Evaluating equilibrium and non-equilibrium equations. Acta Ecologica Sinica, 34, 342-350.
Mualem, Y. (1976). A new method for predicting the hydraulic conductivity of unsaturated porous media. Water Resources Research, 12, 513-522.
Pepper, I.L., Ferguson, G.A., & Kneebone, W.R. (1982). Clinoptilolite zeolite: a new medium for turfgrass growth. In “Proceedings of ASA”. Agronomy Abstract, 145. Richards, L.A. (1954). Diagnosis and improvement of saline
and alkaline soils. Agriculture Handbook no. 60. USDA: United State Department of Agriculture, Washington. Saadat, S., Sepaskhah, A.R., & Azadi, S. (2012). Zeolite effects on immobile water content and mass exchange coefficient at different soil textures. Communications in Soil Science and Plant Analysis, 43 (22), 2935-2946. Saadat S., Sepaskhah A.R., & AzadiS. (2012).Zeolite effects
on immobile water content and mass exchange coefficient at different soil textures. Communications in Soil Science and Plant Analysis,43 (22), 2935-2946.
Sepaskhah, A.R., & Yousefi, F. (2007). Effect of zeolite application on nitrate and ammoium retention of a loamy soil under saturated conditions. Austeralian Journal of Soil Ressearch, 45, 368-373.
Simunek, J., Senjna, M., & van Genuchten, M.T. (1998). HYDRUS-1D software pakage for simulation the one-dimensional movement of water, Heat and multiple solutes in variably saturated media (Vol. Research Report). California: U.S. Salinity Lab. USDA. Riverside.
Tabarzad, A., Sepaskhah, A.R., & Farnoud, T. (2011). Determination of chemical transport properties for different texture of undisturbed soils. Archives of Agronomy and Soil Science, 57(8), 915-930.
Tafteh, A., & Sepaskhah, A.R. (2012). Application of HYDRUS-1D model for simulating water and nitrate leaching from continuous and alternate furrow irrigated rapeseed and maize fields. Agricultural Water Management, 113, 19-29.
van Genuchten, M.T., & Wagenet, R.J. (1989). Two-site/two-region models for pesticide transport and degradation: Theoretical development and analytical solution. Soil Science Society of America Journal, 53, 1303-1310. van Genuchten, M.T., & Wierenga, P.J. (1976). Mass transfer
studies in sorbing porous media. I. Analytical solutions. Soil Science Society of America Journal, 40, 473-481. van Genuchten, M.T. (1980). A closed form equation for
40
! "#$ % $&
'( )
' * + $#
,
.
- % . *(
Hydrus-1D
' /0 $1 ' 2 .
3 4 5 . 6
' ( '6 $& 7898 : ; $< =9 8 : 0
>$ ? % " @ A 6& B ?;& A - C% D . ! .
( $! .
F & =9 8 G$H =9 8 .
Hydrus-1D
I A - C% . . 0
-$G 0 -$G $G ! J$% ' ) F &
8 $9 G$H - , ! - ,
% # ! 5 / ?& 19L ? % " @ A 6& . . 0 > M : $& 0 . ,
)
mg cm-3
26 / 2 -0
. 0 (
2/ ? ! > 0 & L $<
? ;
*( U , " @
' '#$& . ' ( , 1% U G .
L $< ? V % M A ??; : $& 0 'H %$ , 'G 6 0 ;
? . ' 0 % $8F J /0 U G F & 0 , " @
! > ? ; G$H >
A ??; : $& 0 W *, $!
M 4 X& % . 0 9 9;& W ; . 0 '/ ; ? % .
& 0 . M A ??; : $& : $
Hydrus-1D
' V ? . 0
V F & 'F 4$F9 B( $& Y! 0 90
Y! 0 ? %
NRMSE
F & \
2 *% 20 % ? % " @ A F8& 5$! ] /^% + > V% A ' 0
. 0
:
: ( ` & 18
/ 2 / 1395
:W d ` & 25
/ 5 / 1395
: ` & 17
/ 4 / 1396
:
9 ' /0 3$U6 .
HYDRUS-1D
? % . G$H
)
>
.
V
4 ? ?;&
1396
(
36
)
2
(
31
-40
!"
#
$
# %
& '
#
( )*
)
+
, )
(
Hydrus-1D
-*
#
#. /
0
*
1
2 32
4
,
g
5
h
0
0
MV%
.
V
UV%
.
.
.
>
*