Development and initial testing of a
Health Confidence Score (HCS)
Tim Benson, 1,2 Henry W W Potts,2 Pippa Bark,2 Clive Bowman3
To cite: Benson T, Potts HWW, Bark P, et al. Development and initial testing of a Health Confidence Score (HCS). BMJ Open Quality 2019;8:e000411. doi:10.1136/ bmjoq-2018-000411
Received 20 April 2018 Revised 17 May 2019 Accepted 26 May 2019
1R-Outcomes Ltd, Thatcham, UK 2Institute of Health Informatics,
UCL, London, UK
3School of Health Sciences, City,
University of London, London, UK
Correspondence to Tim Benson;
tim. benson@ r- outcomes. com © Author(s) (or their employer(s)) 2019. Re-use permitted under CC BY-NC. No commercial re-use. See rights and permissions. Published by BMJ.
AbstrAct
Introduction Patients need to feel confident about looking after their own health. This is needed to improve patient outcomes and clinical support. With few suitable tools available to measure self-care health confidence, we developed and validated a short, generic survey instrument for use in evaluation and quality improvement.
Methods The Health Confidence Score (HCS) was developed through literature review, patient and expert focus groups and discussions. This paper reports an initial survey (n = 1031, study 1) which identified some issues and a further face-to-face survey (n = 378, study 2) to test the construct and concurrent validity of the final version. Scores were correlated against the My Health Confidence (MHC) rating scale, howRu (health status measure) and relevant demographics.
Results The HCS is short (50 words) with good readability (reading age 8). It has four items covering health
knowledge, capability to self-manage, access to help and shared decision-making; each has four response options (strongly agree, agree, neutral disagree). Items are reported independently and as a summary score. The mean summary score was 76.7 (SD 20.4) on 0–100 scale. Cronbach’s alpha = 0.82. Exploratory factor analysis suggested that the four items relate to a single dimension. Correlation of the HCS summary score with MHC was high (Spearman r = 0.76). It was also associated with health status (Spearman r = 0.49), negatively with number of medications taken (r=–0.29) and age (r=–0.22) and not with ethnicity, having children or education level. Conclusions The HCS is short, easy to use, with good psychometric properties and construct validity. Each item is meaningful independently and the summary score gives an overall picture of health confidence.
Background
Understanding how confident patients are about looking after their own health is essen-tial to improve patient outcomes and clinical support. With rising demands on the health service, increasing patient self-care is a key policy focus.1 The National Health Service
(NHS) has committed to ‘give citizens the knowledge, skills and confidence to manage their own health’2 in response to patients’
wish for more involvement in their own care3
and financial strains.4
People who are more engaged in their own health tend to report better outcomes.5
Inter-ventions that improve participants’ self-rated confidence in complying with prescriptions
and maintaining lifestyle changes6 7 have been
shown to be effective in diabetes,8 depression
and heart disease.9
A substantial proportion of the patient population (25%–50%) has low levels of health confidence,10 11 and this negatively
impacts outcomes and experience, and increases use of emergency care. When health confidence is high, patients take more exercise, eat more healthily and avoid risks; people with diabetes report better blood sugar control. Health confidence is positively associated with patient’s knowledge (health literacy) and ability to access care they need.12 13
Measures of patient confidence and engagement cover a wide domain,14 including
patient-centred care,15 self-care education,16
patient activation17 and interactive health
communication.18
My Health Confidence (MHC)19 is one
of the few measures that set out to measure self-care confidence directly. This has two questions answered on an 11-point scale: (1)
how confident are you that you can control and manage most of your health problems, and (2) how understandable and useful is the information your doctors and nurses have given you about your health problems or concerns.
We identified a need for a short, broad generic measure, for use in quality improve-ment and impact evaluation, of patients’ own perception of their health confidence, covering health literacy and knowledge, ability to self-manage, to obtain help and involvement in shared decisions. Such a measure could be useful both at the indi-vidual level to increase awareness of gaps in an individual’s confidence, and at the aggre-gate level. We called this the Health Confi-dence Score (HCS).
developmenT
The HCS design criteria were to be clear, short, with a low reading age, generic (appli-cable to people with any condition), suitable for frequent use, responsive and with good psychometric properties; also, to generate
on September 12, 2020 by guest. Protected by copyright.
Figure 1 Stage 1 version of Health Confidence Score (January 2015).
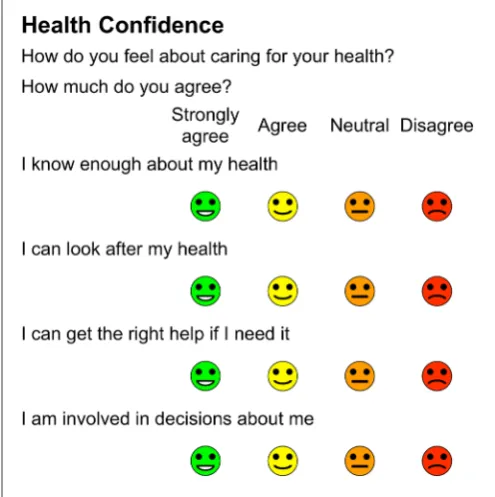
Figure 2 Final version of Health Confidence Score.
scores that are easy to understand and action, and compa-rable for benchmarking. These criteria are common to all patient-reported outcome measures intended for clinical use.20 21
Development of the questionnaire followed a similar process to that used in previous patient-reported measures for health status (howRu),22 patient experience
(howRwe)23 and personal well-being score (PWS).24 A
literature review was combined with informal discussions and focus groups with patients and experts.
A literature review was informed by published reviews,5 25 26 and by measures used to capture self-ef-ficacy,27 health literacy,28 29 patient activation,17 30
patient engagement,19 31 shared decision-making32 and
capability.33
Informal focus groups and discussions were held with patients and clinicians in general practice and commu-nity services during 2014–2016. The aim was to synthesise the core domains of interest derived from the literature and to create statements to capture these in a generic way.
The development of the measure took place in two stages.
Stage 1 development
The stage one questionnaire evolved through more than 30 distinct iterations over several months, with small-scale testing and refinement. Initially, we proposed to use the question how confident do you feel? with four response options: very confident, quite confident, not very confident and
not at all confident.
Four dimensions were identified:
► Knowledge—how much you understand about your
health and treatment, including health literacy.
► Self-management——perceived ability to manage your
health, treatment and lifestyle.
► Access to help—social proficiency to navigate the health
and care system to obtain the services you need.
► Shared decision-making—participation in clinical
deci-sions and how well staff understand your wishes. Stage 1 version of the Health Confidence Score (January 2015) is shown in figure 1. However, in testing (see Results), we found that the distribution of scores in study 1 was narrower than hoped.
Stage 2 development
Consequently, we recast the questionnaire into an agree– disagree format and the wording evolved through 30 further iterations. The final questionnaire is shown in
figure 2.
The four items are as follows:
► I know enough about my health (short term:
knowledge).
► I can look after my health (short term:
self-management).
► I can get the right help if I need it (short term: access).
► I am involved in decisions about me (short term: shared decision-making).
We used four response options, recognising the skewed nature of the expected distribution: strongly agree, agree,
neutral (the version used in study 2 used neither agree nor disagree), and disagree. All responses are optional, there is
no don’t know category. The combination of four items and four options creates a 4×4 matrix with 256 combinations.
For analysis, each option is allocated a score on a 0–3 scale, where strongly agree=3, agree=2, neutral=1 and
disagree=0. Higher is better. A summary score is calculated
by adding the scores for each item, giving a 13-point scale
on September 12, 2020 by guest. Protected by copyright.
Table 1 Number of items, words, Flesch-Kincaid Grade and reading age of questionnaires
Instrument No of items Word count Flesch-Kinkaid Grade Reading age
Health Confidence Score 4 50 2.8 8 Health Literacy Questionnaire 44 1001 7.2 12
ICECAP-A 5 281 5.2 10
My Health Confidence 2 83 4.8 10 Patient Activation Measure (PAM-13) 13 299 8.2 13 Patient Health Engagement Scale 5 144 5.1 10 Stanford self-efficacy for managing chronic disease
6-item scale (Stanford 6)
6 212 8.5 14
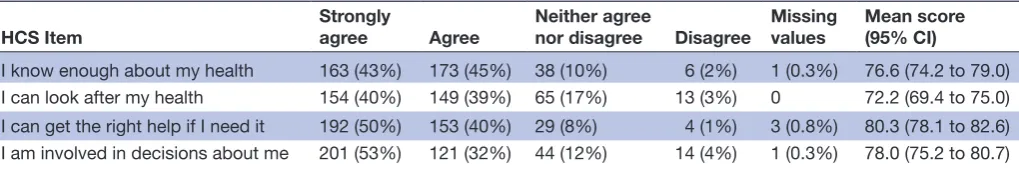
Table 2 Frequency distributions for the questionnaire items in study 2 (n=378)
HCS Item
Strongly
agree Agree
Neither agree
nor disagree Disagree
Missing values
Mean score (95% CI)
I know enough about my health 163 (43%) 173 (45%) 38 (10%) 6 (2%) 1 (0.3%) 76.6 (74.2 to 79.0) I can look after my health 154 (40%) 149 (39%) 65 (17%) 13 (3%) 0 72.2 (69.4 to 75.0) I can get the right help if I need it 192 (50%) 153 (40%) 29 (8%) 4 (1%) 3 (0.8%) 80.3 (78.1 to 82.6) I am involved in decisions about me 201 (53%) 121 (32%) 44 (12%) 14 (4%) 1 (0.3%) 78.0 (75.2 to 80.7)
The mean scores and the 95% CI on a 0–100 scale are shown. HCS, Health Confidence Score.
with a range from the floor 0 (4×disagree) to the ceiling 12 (4×strongly agree).
For reporting group results, the mean scores are trans-formed linearly to a scale from 0 to 100, where 0 indicates that all respondents chose the lowest score and 100 that all chose the highest. A common 0 to –100 scale is familiar and lets people compare item and summary mean scores on the same scale.
The UK Terminology Centre has issued SNOMED CT and Read Codes for the HCS so that the information can be recorded in the patient’s electronic health record (EHR).34
meThodS
length and readability
Questionnaire length and complexity impact response rates and data quality.35 The number of items and words in the HCS was compared with six other instruments that measure related constructs: My Health Confidence (MHC),19 Patient Health Engagement Scale,31 Stanford self-efficacy for managing chronic disease 6-item scale,36
Patient Activation Measure (PAM-13),37 ICECAP-A33 and
the Health Literacy Questionnaire.38 The texts analysed are those reported by the original authors.
Reading age was measured with the Flesch-Kincaid Readability Grade (FKG), provided as part of Micro-soft Word.39 In general, patients should not be asked to
complete questionnaires with reading age more than 10, corresponding approximately to FKG=5.40
Testing and validation
Study 1 tested the stage 1 questionnaire and was conducted in March 2015 through YouGov using a nationally repre-sentative online sample in the UK, as part of a study on online cancer information.41 Panel members were paid a
small fee for surveys completed. The four HCS questions were presented on screen (without graphics) early in the survey.
Study 2 tested the stage 2 questionnaire. During the summer of 2015, an interviewer approached a convenience sample of members of the public around Newbury, an English market town, and asked them, with their consent, to complete a short anonymous survey, presented on a two-sided laminated sheet. The inter-viewer entered responses into a web-based survey app using a smart-phone.
In addition to the HCS, each respondent was asked to complete the MHC survey,19 and the howRu health
status measure.22 HowRu has four items: (1) pain or
discomfort, (2) feeling low or worried, (3) limited in what you can do and (4) require help from others; each item has four responses: none, a little, quite a lot and extreme.
We also recorded respondent’s gender, age in decades, ethnicity (White British or other), if they had children (yes or no), took regular medication (none, 1 or 2 and 3 or more medications each day)and age at which they completed education (under 17, 17–19 and over 19).
We hoped to find a broader distribution of responses in study 2 than in study 1. We expected a ceiling effect,
on September 12, 2020 by guest. Protected by copyright.
Table 3 Factor analysis results, using oblique rotation, Promax
Item Factor 1 Factor 2 Uniqueness
HCS 1 Knowledge 0.80 0.47 HCS 2 Self-management 0.75 0.38 HCS 3 Access 0.78 0.46 HCS 4 Shared decisions 0.65 0.55 howRu 1 Discomfort 0.75 0.37 howRu 2 Distress 0.42 0.68 howRu 3 Disability 0.94 0.21 howRu 4 Dependence 0.96 0.23 MHC Confidence 0.80 0.31 MHC Information 0.97
Only weights over 0.3 are shown. HCS, Health Confidence Score ; MHC, My Health Confidence.
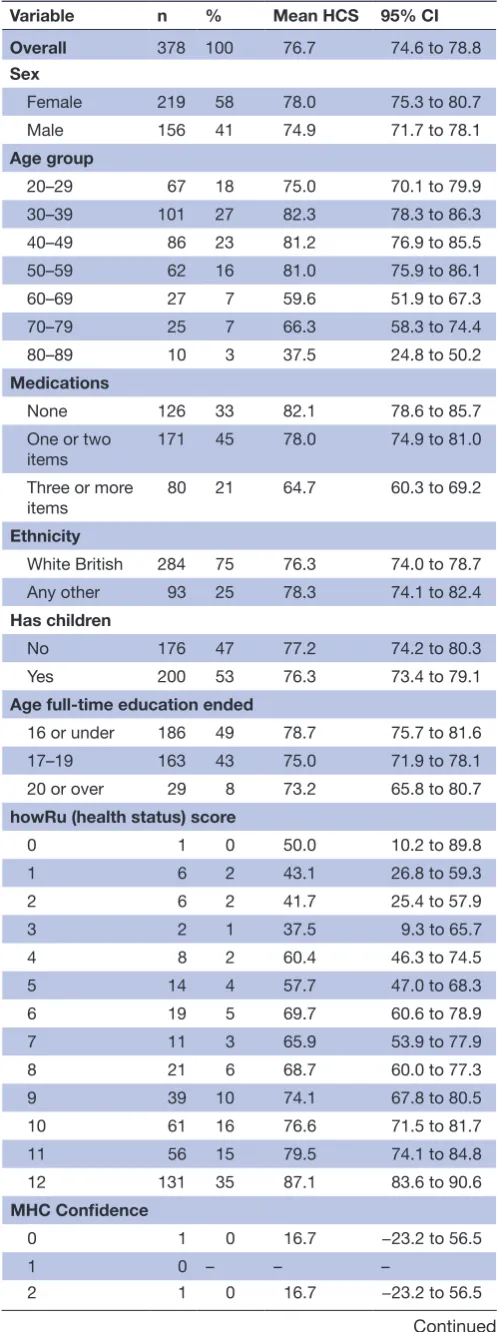
Table 4 Independent variables frequency distribution, mean HCS (0–100 scale) and confidence limits (study 2)
Variable n % Mean HCS 95% CI
Overall 378 100 76.7 74.6 to 78.8
Sex
Female 219 58 78.0 75.3 to 80.7 Male 156 41 74.9 71.7 to 78.1 Age group
20–29 67 18 75.0 70.1 to 79.9 30–39 101 27 82.3 78.3 to 86.3 40–49 86 23 81.2 76.9 to 85.5 50–59 62 16 81.0 75.9 to 86.1 60–69 27 7 59.6 51.9 to 67.3 70–79 25 7 66.3 58.3 to 74.4 80–89 10 3 37.5 24.8 to 50.2 Medications
None 126 33 82.1 78.6 to 85.7 One or two
items 171 45 78.0 74.9 to 81.0 Three or more
items 80 21 64.7 60.3 to 69.2 Ethnicity
White British 284 75 76.3 74.0 to 78.7 Any other 93 25 78.3 74.1 to 82.4 Has children
No 176 47 77.2 74.2 to 80.3 Yes 200 53 76.3 73.4 to 79.1 Age full-time education ended
16 or under 186 49 78.7 75.7 to 81.6 17–19 163 43 75.0 71.9 to 78.1 20 or over 29 8 73.2 65.8 to 80.7 howRu (health status) score
0 1 0 50.0 10.2 to 89.8 1 6 2 43.1 26.8 to 59.3 2 6 2 41.7 25.4 to 57.9 3 2 1 37.5 9.3 to 65.7 4 8 2 60.4 46.3 to 74.5 5 14 4 57.7 47.0 to 68.3 6 19 5 69.7 60.6 to 78.9 7 11 3 65.9 53.9 to 77.9 8 21 6 68.7 60.0 to 77.3 9 39 10 74.1 67.8 to 80.5 10 61 16 76.6 71.5 to 81.7 11 56 15 79.5 74.1 to 84.8 12 131 35 87.1 83.6 to 90.6 MHC Confidence
0 1 0 16.7 −23.2 to 56.5
1 0 – – –
2 1 0 16.7 −23.2 to 56.5
Continued
but in spite of no strongly disagree response option, did not anticipate a floor effect.
We expected inter-item correlations in the range r=0.4– 0.6 and Cronbach’s alpha between 0.7 and 0.9, which would justify the use of a summary score.42
Exploratory factor analysis, using the JASP statis-tics programme, was applied to the whole study 2 data set (using an oblique rotation, Promax, as we expected constructs to be correlated) for the individual questions in HCS, howRu and the two MHC questions.
Construct validity is the degree to which the scores of an instrument are consistent with hypotheses, such as relationships to scores of other instruments or differ-ences between relevant groups, based on the assumption that the instrument validly measures the construct to be measured.43
We hypothesised that in a study of this size:
► Health confidence would be moderately associated with health status, as measured by howRu.
► There would be little difference in health confidence between men and women, being a parent, education and ethnicity.
► Health confidence would be lower in people as they became older and take more medication.
► HCS would correlate more strongly with the MHC scale than with the MHC information scale.
ethics statement
No data were collected unless participants consented. There was no risk of substantial damage or distress to individual participants.44
Patient and public involvement
The need for a short simple measure of health confidence was an explicit finding of focus groups that we organised as part of NHS Vanguard projects. In the studies reported, people were asked to complete the surveys and did so will-ingly.
on September 12, 2020 by guest. Protected by copyright.
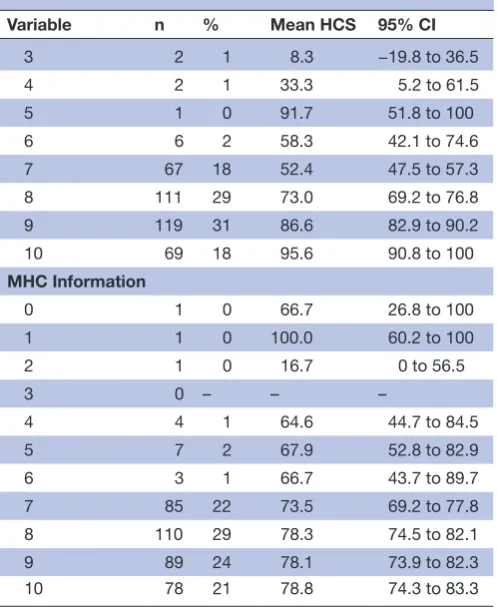
Variable n % Mean HCS 95% CI 3 2 1 8.3 −19.8 to 36.5 4 2 1 33.3 5.2 to 61.5 5 1 0 91.7 51.8 to 100 6 6 2 58.3 42.1 to 74.6 7 67 18 52.4 47.5 to 57.3 8 111 29 73.0 69.2 to 76.8 9 119 31 86.6 82.9 to 90.2 10 69 18 95.6 90.8 to 100 MHC Information
0 1 0 66.7 26.8 to 100 1 1 0 100.0 60.2 to 100 2 1 0 16.7 0 to 56.5
3 0 – – –
4 4 1 64.6 44.7 to 84.5 5 7 2 67.9 52.8 to 82.9 6 3 1 66.7 43.7 to 89.7 7 85 22 73.5 69.2 to 77.8 8 110 29 78.3 74.5 to 82.1 9 89 24 78.1 73.9 to 82.3 10 78 21 78.8 74.3 to 83.3
HCS, Health Confidence Score; MHC, My Health Confidence. Table 4 Continued
reSulTS
length and readability
The number of items (questions), words, FKG and reading age for the final HCS and other instruments are shown in
table 1. The HCS has a low word count and reading age.
Study 1
Study 1 (using the stage 1 questionnaire) had 1031 responses. The score distribution was narrower than hoped for, with mean summary score 8.0 on the 0–12 scale, SD 2.0, range 0–12, IQR 7–9, negative skew −0.5 and kurtosis 1.1. Of note, 62% chose the same response (quite confident). This led to revision of the instrument (stage 2).
Study 2
Study 2 used the final questionnaire. In total, 381 people completed the survey. Five surveys (1.3%) contained any missing values for any item. Only complete data sets were analysed further.
The frequency distribution of each item is shown in
table 2. Frequency varies from 1% (disagree that I can get
the right help if I need it) to 53% (strongly agree that I am involved in decisions about me).
The mean HCS summary score on the 0–12 scale is 9.2, SD 2.4, IQR 8–11, negative skew −0.9 and kurtosis 0.4. When transposed to a 0–100 scale, the mean HCS is 76.7 (95% CI 74.6 to 78.8, SD 20.4). The ceiling state (strongly
agree on all four items) accounted for 23% of ratings; the
floor state (disagree on all four items) occurred only once (0.3%).
The internal structure was explored by examining the correlations between each pair of items. All inter-item correlations are in the range 0.41 to –0.59, implying that they are measuring related but different things. Cron-bach’s alpha=0.82 is in the middle of the desired range.
Exploratory factor analysis results are shown in table 3. A scree plot implies two factors, while Kaiser’s crite-rion implies only one. This supports the view that HCS measures the same concept as the MHC question, while howRu measures a separate concept (health status). The MHC information question measures a different concept.
For demographic and independent variables, the frequency distribution, mean HCSs (0–100 scale) and CIs are shown in table 4.
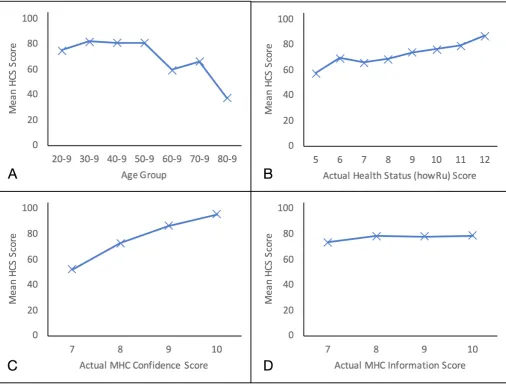
The HCSs for men are lower (74.9) than for women (78.0), but not significantly (t(371) = 1.4, p=0.20). HCS is flat between the ages of 30 and 60, but then falls with age (figure 3A) (Spearman’s correlation, r=−0.22, p<0.0001).
People taking three or more medicines also have lower HCS (Spearman’s correlation, r=−0.29, p<0.0001), a result that is confounded with age.
There are no significant differences in HCSs according to ethnicity (t(370) = 0.8, p=0.4), having children (t(369) = 0.5, p=0.7) or education level (Spearman’s correlation,
r=0.10, p=0.059).
HCS is moderately correlated with health status (howRu) (figure 3B) (Spearman’s correlation, r=0.49, p<0.0001).
Correlation between the HCS and the MHC Confi-dence item is high (figure 3C) (Spearman’s correlation,
r=0.76, p<0.0001). The MHC rating has a mean of 8.4 on
the 0–10 scale. The MHC scale has a narrower disper-sion than HCS (Brown-Forsythe test, F(1, 751)=141, p<0.00001).45 The MHC SD is 1.3, range 0–10, IQR 8–9,
negative skew −1.6 and kurtosis 6.9.
The correlation between HCS and the MHC Infor-mation item is not significant (figure 3D) (Spearman’s correlation, r=0.08, p=0.10).
diScuSSion
Strengths and limitations
This is the first full account of the HCS, which is a short generic person-reported measure of people’s perceived confidence in managing aspects of their own health and care. It is readily usable on smartphones and tablets. It is designed for use across all health and social care sectors, together with other modules of the R-Outcomes family.
HCS is shorter than comparable measures, with a lower reading age.
Michie’s COM-B model46 suggests that behaviour
change depends on people’s capability, opportunity and motivation to change what they do. The first HCS item (I know enough about my health) relates to capability. People need to understand how their behaviour impacts their health. The second item (I can look after my health)
on September 12, 2020 by guest. Protected by copyright.
Figure 3 Plots of mean HCS score against actual values of independent variables. A, age group; B, health status (howRu) score; C, MHC Confidence score; D, MHC Information score. Only nodes with more than 10 occurrences are shown. HCS, Health Confidence Score; MHC, My Health Confidence.
relates to both capability and motivation—they may not be able or wish to do things. The third and fourth dimensions (I can get the right help if I need it, and I am involved in decisions that affect me) relate to opportunity and how local health and care services support them.
Inter-item correlations and Cronbach’s alpha are within the desired range. These results, together with factor analysis, suggests that, while each item measures a different aspect and is useful independently, the aggre-gate HCS is a meaningful summary measure. A recently published study, using the HCS with measures of PWS, health status (howRu) and patient experience (howRwe) in social prescribing, confirms this.24
For populations, the 0 to –100 scale is easy to under-stand and facilitates comparison of mean scores for items and summary scores. The HCS summary score has a broad distribution of responses on a 13-point scale, with low kurtosis. This compares favourably with the MHC score kurtosis.
HCS is strongly correlated with the MHC score but not with the MHC information score (which measures
the value of health information provided). We found no significant relationships between HCS and gender, ethnicity, education or region. Hypothesised associations are as expected, supporting the case for construct validity.
One limitation is that this study was undertaken among a convenience sample of the public which may not be representative of the general population. Using a single interviewer to collect the data may have created some bias, but this is unknown.
comparison with existing literature
Health confidence is a broad concept, encompassing aspects of self-efficacy,47 patient activation,17 health
literacy,48 self-management,49 shared decision-making,50
capability51 and empowerment.52 The focus of HCS is
on how people feel (perception), not on what they do (activity). Health confidence is about the person, not about a clinical encounter, unlike measures such as CollaboRATE.53 It does not measure how well clinicians
or providers engage with patients.
on September 12, 2020 by guest. Protected by copyright.
The HCS scope is broader than the PAM. HCS is shorter than PAM (50 vs 299 words) with lower reading age (8 vs 13 years). Independent evaluation has reported that PAM has issues in terms of implementation, complexity and understandability.54
HCS provides a summary score plus a score for each item, while the PAM groups patients into four levels and a single overall score in the range 0 to 100. For interpreta-tion, the mean HCS item and summary scores, on 0–100 scale, are often related to arbitrary thresholds of 80–100 (high), 60–79 (moderate), 40–59 (low) and 0–39 (very low).
HCS is not a conventional outcome measure, which should always be maximised. Health confidence is sensi-tive to each person’s existing health problems, as is acti-vation.55 For example, an individual without any health
problems is likely to score higher (better) than one with multiple conditions. Case mix, health status and social context must always be taken into account.
The concepts of health confidence, activation and health literacy can help us understand whether interven-tions reach and help their target participants, or whether only those who are already health literate are being reached.56 Health confidence includes aspects of both a
mind set and a skill set. Activation is mainly a mindset, while health literacy is a skill set.57 Both are moderately
correlated with physical and mental health but not with each other.58
implications for practice
At the individual level, HCS results may help clinicians to tailor decisions to patient’s needs, be shared with patients and carers and incorporated into EHRs.59 60 Availability of
Read codes and SNOMED CT codes makes HCS straight-forward to integrate with EHRs used in hospitals and primary care.34
At the aggregate level, HCS item and summary scores can be integrated into interactive real-time dashboards to provide rapid feedback for clinicians, managers and commissioners. The What Matters Index, which uses MHC with four other questions (pain, distress, poly-pharmacy and adverse drug effects), has advantages over computer-generated risk models at predicting and controlling hospital costs.61 It is likely that HCS could be
used in a similar way.
The HCS meets the need for a short easy to use measure of health confidence. It can be collected on smartphones and other devices that people already use. The HCS has already been used in more than 40 evaluation and quality improvement studies, usually as part of a longer question-naire, with measures of health status (howRu), patient experience (howRwe) and PWS, to support and evaluate patient-centred care.24 62 Surveys are administered
digi-tally or on a single sheet of A4 paper and include a text box to allow respondents to expand on their answers.
Two variants of the HCS, which measure carers’ confi-dence and staff job conficonfi-dence, respectively, have also been used with success. Work may be needed to validate
all these measures in other institutions, population and geographic zones, although experience to date has been encouraging.
concluSionS
The HCS is a generic measure of an individual’s confi-dence in their capability, opportunity and motivation to participate in and look after his or her own health. It is shorter and has a lower reading age than other widely used instruments. It has good psychometric properties and construct validity.
Acknowledgements The study 1 data came from a wider project with Cancer
Research UK and Wikimedia UK, funded by the Wellcome Trust; our thanks to John Byrne and Henry Scowcroft. We wish to thank Victoria Fredrikson for collecting the data in study 2. Our thanks to John Wasson (Dartmouth Medical School) for giving us permission to use My Health Confidence.
Contributors TB designed the Health Confidence Score with CB and wrote the
first draft of the paper. HWWP designed the surveys with TB. TB, HWWP and PB performed the analyses. All authors contributed to the final text, read and approved the final manuscript.
Funding The authors have not declared a specific grant for this research from any
funding agency in the public, commercial or not-for-profit sectors.
Competing interests TB is a director and shareholder in R-Outcomes Ltd, which
provides quality improvement and evaluation services using the Health Confidence Score. HWWP has received consultancy fees from Crystallise, System Analytic and The HELP Trust and received funding from myownteam and Shift. ms, unrelated to the work reported here. CB is a non-executive director of AKARI Care Homes, FINCCH and Invatech Health. The authors declare that they have no other conflicting interests. Please contact R-Outcomes Ltd if you wish to use the Health Confidence Score.
Patient consent for publication Not required.
Ethics approval Research ethics approval was not sought because both studies
used data collected anonymously from members of the public who consented freely to complete the task.
Provenance and peer review Not commissioned; externally peer reviewed.
Data availability statement Data are available upon reasonable request.
Open access This is an open access article distributed in accordance with the
Creative Commons Attribution Non Commercial (CC BY-NC 4.0) license, which permits others to distribute, remix, adapt, build upon this work non-commercially, and license their derivative works on different terms, provided the original work is properly cited, appropriate credit is given, any changes made indicated, and the use is non-commercial. See: http:// creativecommons. org/ licenses/ by- nc/ 4. 0/.
references
1. NHS. The NHS long term plan, 2019. Available: https://www. longtermplan. nhs. uk/
2. NHS England. Putting Patients First: The NHS England business plan for 2013/14 – 2015/16, 2013.
3. Ahn S, Basu R, Smith ML, et al. The impact of chronic disease self-management programs: healthcare savings through a community-based intervention. BMC Public Health 2013;13.
4. Brady TJ, Murphy L, O'Colmain BJ, et al. A meta-analysis of health status, health behaviors, and health care utilization outcomes of the chronic disease self-management program. Prev Chronic Dis
2013;10.
5. Foot C, Gilburt H, Dunn P, et al. People in control of their own health and care: the state of involvement. London: The King’s Fund, 2014. 6. Hibbard JH, Mahoney ER, Stock R, et al. Do increases in patient
activation result in improved self-management behaviors? Health Serv Res 2007;42:1443–63.
7. Nelson EC, Eftimovska E, Lind C, et al. Patient reported outcome measures in practice. BMJ 2015;350:g7818.
8. Remmers C, Hibbard J, Mosen DM, et al. Is patient activation associated with future health outcomes and healthcare
on September 12, 2020 by guest. Protected by copyright.
utilization among patients with diabetes? J Ambul Care Manage
2009;32:320–7.
9. Ludman EJ, Peterson D, Katon WJ, et al. Improving confidence for self care in patients with depression and chronic illnesses. Behav Med 2013;39:1–6.
10. Hibbard JH, Cunningham PJ. How engaged are consumers in their health and health care, and why does it matter. Research Brief 2008;8:1–9.
11. Wasson JH. A patient-reported spectrum of adverse health care experiences: harms, unnecessary care, medication illness, and low health confidence. J Ambul Care Manage 2013;36:245–50.
12. Wasson JH, Baker NJ. Balanced measures for patient-centered care.
J Ambul Care Manage 2009;32:44–55.
13. Lepore M, Wild D, Gil H, et al. Two useful tools: to improve patient engagement and transition from the hospital. J Ambul Care Manage
2013;36:338–44.
14. Coulter A. Measuring what matters to patients. BMJ 2017;356. 15. Ekman I, Swedberg K, Taft C, et al. Person-centered care--ready for
prime time. Eur J Cardiovasc Nurs 2011;10:248–51. 16. Coulter A, Ellins J. Effectiveness of strategies for informing,
educating, and involving patients. BMJ 2007;335:24–7.
17. Hibbard J, Gilburt H. Supporting people to manage their health—An introduction to patient activation. London: The King’s Fund, 2014. 18. Murray E, Burns J, See Tai S, et al. Interactive health communication
applications for people with chronic disease. Cochrane Database Syst Rev 2005;30.
19. Wasson J, Coleman EA. Health confidence: an essential measure for patient engagement and better practice. Fam Pract Manag
2014;21:8–12.
20. Fitzpatrick R, Fletcher A, Gore S, et al. Quality of life measures in health care. I: applications and issues in assessment. BMJ
1992;305:1074–7.
21. Mokkink LB, Terwee CB, Patrick DL, et al. The COSMIN checklist for assessing the methodological quality of studies on measurement properties of health status measurement instruments: an international Delphi study. Qual Life Res
2010;19:539–49.
22. Benson T, Sizmur S, Whatling J, et al. Evaluation of a new short generic measure of health status: howRu. J Innov Health Inform
2010;18:89–101.
23. Benson T, Potts HWW. A short generic patient experience questionnaire: howRwedevelopment and validation. BMC Health Serv Res 2014;14.
24. Benson T, Sladen J, Liles A, et al. Personal Wellbeing Score (PWS)—a short version of ONS4: development and validation in social prescribing. BMJ Open Qual 2019;8:e000394.
25. De Silva D. Helping measure person-centred care. London: The Health Foundation, 2014.
26. Institute of Medicine. Vital Signs: Core Metrics for Health and Health Care Progress. Washington, DC: National Academies Press, 2015. 27. Lorig KR, Sobel DS, Ritter PL, et al. Effect of a self-management
program for patients with chronic disease. Effective Clinical Practice 2001;4:256–62.
28. NHS Scotland. Making it easy: a health literacy action plan for Scotland. Edinburgh, 2014.
29. Harnett S. Health literacy tool shed: a source for validated health literacy instruments. J Consum Health Internet 2017;21:78–86. 30. Hibbard JH, Stockard J, Mahoney ER, et al. Development of
the patient activation measure (PAM): conceptualizing and measuring activation in patients and consumers. Health Serv Res
2004;39:1005–26.
31. Graffigna G, Barello S, Bonanomi A, et al. Measuring patient engagement: development and psychometric properties of the patient health engagement (Phe) scale. Front Psychol 2015;6. 32. Shay LA, Lafata JE. Where is the evidence? A systematic review of
shared decision making and patient outcomes. Med Decis Making
2015;35:114–31.
33. Al-Janabi H, Flynn TN, Coast J. Development of a self-report measure of capability wellbeing for adults: the ICECAP-A. Qual Life Res 2012;21:167–76.
34. Benson T, Grieve G. Principles of health interoperability: SNOMED CT, HL7 and FHIR. 3rd edn. London: Springer, 2016.
35. Dillman DA, Smyth JD, Internet CLM. phone, mail and mixed-mode surveys: the tailored design method. 4th edn. Hoboken, NJ: John Wiley & Sons, 2014.
36. Stanford Patient Education Research Center. Chronic disease self-management program questionnaire code book. Stanford University, 2007.
37. Hibbard JH, Mahoney ER, Stockard J, et al. Development and testing of a short form of the patient activation measure. Health Serv Res
2005;40:1918–30.
38. Osborne RH, Batterham RW, Elsworth GR, et al. The grounded psychometric development and initial validation of the health literacy questionnaire (HLQ). BMC Public Health 2013;13.
39. Kincaid JP, Fishburne Jr RP, Rogers RL, et al. Derivation of new readability formulas (automated readability index, fog count and Flesch reading ease formula) for navy enlisted personnel. Naval Technical Training Command Millington TN Research Branch, 1975. 40. Paz SH, Liu H, Fongwa MN, et al. Readability estimates for
commonly used health-related quality of life surveys. Qual Life Res
2009;18:889–900.
41. Byrne J, Potts HWW, Scowcroft H. Cancer Research UK’s Wikipedian in Residence project – reflections and outcomes. London: Wikipedia Science Conference.
42. Streiner DL, Norman GR, Cairney J. Health measurement scales: a practical guide to their development and use. Oxford University Press, 2015.
43. Mokkink LB, Terwee CB, Patrick DL, et al. The COSMIN study reached international consensus on taxonomy, terminology, and definitions of measurement properties for health-related patient-reported outcomes. J Clin Epidemiol 2010;63:737–45.
44. NHS Health Research Authority. Defining research: research ethics service guidance to help you decide if your project requires review by a research ethics committee. UK Health Departments’ Research Ethics Service, 2016.
45. Brown MB, Forsythe AB. Robust tests for the equality of variances. J Am Stat Assoc 1974;69:364–7.
46. Michie S, van Stralen MM, West R. The behaviour change wheel: a new method for characterising and designing behaviour change interventions. Implementation Science 2011;6.
47. Bandura A. Self-efficacy: toward a unifying theory of behavioral change. Psychol Rev 1977;84:191–215.
48. Sørensen K, Van den Broucke S, Fullam J, et al. Health literacy and public health: a systematic review and integration of definitions and models. BMC Public Health 2012;12.
49. Bodenheimer T, Lorig K, Holman H. Patient self-management of chronic disease in primary care. JAMA 2002;288:2469–75. 50. Barry MJ, Edgman-Levitan S. Shared decision making--pinnacle of
patient-centered care. N Engl J Med 2012;366:780–1.
51. Sen A. Capability and Well-Being. In: Nussbaum M, Sen A, eds. The quality of life. Oxford: Clarendon Press, 1993: 30–53.
52. Barr PJ, Scholl I, Bravo P, et al. Assessment of patient empowerment--a systematic review of measures. PLoS One
2015;10:e0126553.
53. Elwyn G, Barr PJ, Grande SW, et al. Developing collaborate: a fast and frugal patient-reported measure of shared decision making in clinical encounters. Patient Educ Couns 2013;93:102–7.
54. Chew S, Brewster L, Tarrant C, et al. Fidelity or flexibility: an ethnographic study of the implementation and use of the patient activation measure. Patient Educ Couns 2018;101:932–7. 55. Brewster L, Tarrant C, Armstrong N. ‘Patient activation’ as an
outcome measure for primary care? Family Practice 2015;32:481–2. 56. Hibbard JH. Patient activation and the use of information to support
informed health decisions. Patient Education and Counseling
2017;100:5–7.
57. Smith SG, Curtis LM, Wardle J, et al. Skill set or mind set? associations between health literacy, patient activation and health.
PLoS One 2013;8:e74373.
58. Couture Éva Marjorie, Chouinard M-C, Fortin M, et al. The relationship between health literacy and patient activation among frequent users of healthcare services: a cross-sectional study. BMC Fam Pract 2018;19.
59. Institute of Medicine. Capturing social and behavioral domains and measures in electronic health records: phase 2. Committee on the Recommended Social and Behavioral Domains and Measures for Electronic Health Records; Board on Population Health and Public Health Practice. Washington, DC: National Academies Press, 2014. 60. Basch E. Patient-Reported Outcomes - Harnessing Patients' Voices
to Improve Clinical Care. N Engl J Med 2017;376:105–8.
61. Wasson JH, Ho L, Soloway L, et al. Validation of the what matters index: a brief, patient-reported index that guides care for chronic conditions and can substitute for computer-generated risk models.
PLoS One 2018;13:e0192475.
62. Collins A. Measuring what really matters: towards a coherent measurement system to support person-centred care. London: The Health Foundation, 2014.
on September 12, 2020 by guest. Protected by copyright.