81
IJMGE
Int. J. Min. & Geo-Eng.
Vol.48, No.1, June 2014, pp 81-100.
Evaluation of Technological Changes’ Impact on Scarcity of Minerals
by a Value Chain Approach: Introducing a Conceptual Model
Shamseddin Vahabi *, Abolghasem Mahdavi, Jafar Ebadi
Faculty of Economics, University of Tehran, Tehran, Iran
Received 5 August 2013; Received in revised form 15 December 2013; Accepted 20 December 2013 *Corresponding author: [email protected]
Abstract
Adopting a policy and deciding on long-term investment in the mining industry by a government or private sector actors depends strongly on the ability to predict the scarcity of mineral reserves. Change in scarcity of mineral reserves is a function of several technological and non-technological factors. Among them, change in technology is the most significant factor affecting scarcity. This paper aims to investigate the relationship between mineral scarcity changes and technological changes. In this study, the effective factors on mineral scarcity were initially considered, and the main and most commonly proposed approaches in the field of scarcity were briefly analysed. The problems associated with these approaches in explaining the relationship between scarcity and changes in technology are then discussed. These approaches are mainly limited to the past available data, whose direction is the development “from scarcity to technological changes”; therefore, they are inefficient in predicting scarcity due to technological changes. To overcome such limitations, a chain technology method was introduced with an approach moving “from technological changes to scarcity”. In this approach, scarcity is firstly explained based on the objective technological changes, and secondly it is related to some technologies affecting scarcity, such as mineral exploration, exploitation, mineral processing, metal production, consumer goods and recycling of scrap metals. The results obtained from this paper can be effectively used to make decisions regarding investment in the mineral industry.
Keywords: aggregate production function, chain technology, investment, scarcity index.
1. Introduction
Investors and policymakers need to have a fairly good understanding of the future balance between demand and supply of mineral commodities. Mining and mineral industries are faced with different risks. One of the most important risks is uncertainty about the adequate supply of minerals. This problem
82 technology of the time. In the studies related to the natural resources economy, the issue of scarcity is at the centre of discussions. For future planning, it is necessary to understand how to supply materials.
In the last 200 years, the world has witnessed cycles of concern about the adequacy of minerals for the future, and ups and downs of optimistic and pessimistic viewpoints, alternately, during this period of time. This concern has been renewed in recent years. The main question is whether natural resources are adequate for the positive and continuous development of human societies, or whether they will be a limit to the growth rate. The optimistic viewpoint emphasizes the role of some factors such as technological changes in compensating for the decrease of resources due to the depletion of reserves. In contrast, the pessimistic view suggests that natural resources are finite and this issue is considered much more than the technological benefits. Thus, the balance between technological progress and the depletion of resources is the main issue.
The idea that the finite natural resources restrict economic growth goes back to at least the early 19th century, when some British classical economists, especially Malthus (1798) [1], Ricardo (1817) [2] and Mill (1862) [3], theorized the condition of the stability of the society. From 1890-1920, America witnessed a period of the development of the conservation movement. In response to this movement, Hotelling (1931) [4] published a theoretical article, and predicted that scarcity increases at an exponential rate. Thirty years later, two American economists (Barnett and Morse (1963)) questioned some of the main theories of the conservation movement, as well as the Malthusian pessimistic viewpoint [5]. In 1997, the United Nations urged Leontief, winner of the Noble Prize in economics sciences, to conduct a study on whether natural resources would come to an end before the end of the century. In the current period, beginning in the early 21st century, the world has entered a situation in which the issue of natural resources’ adequacy for growth is once again under the spotlight, following the arrival of countries like China and India in an era of rapid growth. For example, the Commission of the European Communities, also known as the
European Commission, was worried in 2008 about the imbalance between supply and demand, and has, therefore, seriously studied the issue of scarcity [39].
In order to indicate scarcity changes, different physical and economic indices have been introduced. Each of the indicators has their own challenges, and there is still a long way to go to provide a comprehensive index. Thus, the issue is still at the centre of the scientific discussions.
One of the main issues in the related field is the examination of the factors affecting scarcity, especially in relation to technological progress. Studies on these indicators have not directly considered the issue of technology, but they have contributed to the progress of scarcity indicators in relation to technological changes indirectly and in general [5,6,7,8].
This paper attempts to examine the direct effect of technological change on scarcity. If it is possible to do so, we can increase the accuracy of the estimates relating to the supply of minerals, and make investment-related decisions with lower risk. In order to achieve this goal, the paper suggests direct observation of technology and calculation of its effects on scarcity. For a deeper understanding of technological impacts, we have considered the aggregation of different technologies which can cause effects on scarcity changes. Therefore, we have introduced the “value chain approach”. In this study, after reviewing the literature on scarcity and its indicators, the related challenges associated with each of them will be examined. Then, we will focus our attention on the relationship between scarcity and technological changes, and a new approach called the “technological chain approach” will be introduced as a conceptual model to explain the abovementioned relationship.
2. Measuring Scarcity
In order to study scarcity, many physical and economic indices have been introduced by many researchers. These indices are expressed as follows:
2.1. Physical Indices
83 correspondence between the stock of reserves and the amount of consumption. Accordingly, two physical indicators are introduced: static and dynamic indicators. The static index is calculated by dividing the degree of presently known reserves at a specific time by the quantity of future annual consumption, and the reserves’ lifetimes are thus estimated. Some studies have been conducted by different researchers
considering the explored mineral reserves’ lifetime (static index). For example, Tilton (2001) has demonstrated the expected life of some minerals according to the stock of reserves in 1999 [9]. Sohn (2006) compared the expected life of minerals at two different times, in 1979 and 2000 [10]. Differences in this period show the scarcity changes. Table 1 shows scarcity increase for some materials in the related period of time.
Table 1. Comparison of static index in the years 1979 and 2000 [10].
Mineral Life time of the world’s reserves in the following years
The ratio of the reserves life time in the year 2000 to 1979
1979 2000
Bauxite 287.60 169.12 0.588
Copper (metal content) 49.90 35.61 0.713 Iron (metal content) 153.20 119.05 0.777 Nickel (metal content) 70.20 48.82 0.695
Some studies have been recently carried out regarding resources’ scarcity and problems with the availability of non-energy materials by Diederen (2009), Kesler (2007), Cohen (2007) and Frondle et al. (2007) [11,12,13,14]. Results of these studies are different from each other, despite being done in very short intervals, due to differences of assumptions about the world economic growth rate in the future. Frondle et
al. (2007) compared the findings of Meadows’ (1972) study on scarcity of minerals- commissioned by the Club of Rome- with geological data (2004) derived from the United States Geological Survey (USGS) [14,15]. The Club of Rome was founded in 1968 as an informal community, and it is interested in participating in activities to create a better world. Table 2 shows this comparison.
Table 2. Reserve to Production Ratio R/P (compares Frondle et al.’s study with Club of Rome Study, 2007) [14].
Base metal
Reserve in million tones R/P ration in years
2004 1972
(Club of Rome) 2004
1972 (Club of Rome)
Bauxite 23,000 1,170 147 100
Lead 67 91 21 26
Iron 80,000 100,000 64 240
Copper 470 308 32 36
Nickel 62 66.5 44 150
Zinc 220 123 24 23
Tin 6.1 4.4 24 17
As can be seen, some reserves have increased and others have decreased in a 32-year time period.
In a more recently study, Clugston (2010) has analysed scarcity of 57 natural resources during recent global economic growth (2000-2008), i.e., the period before the global crisis, on the basis of data gathered from the United States Geological Survey (USGS) and the United States Energy Information Administration (EIA) [38]. The findings are summarized as follows: 50 minerals out of 57 (88%) have shown some levels of scarcity
during the global economic growth 2000-2008; six minerals are extremely scarce, 21 very scarce, 22 moderately scarce, one mineral shows marginal scarcity and seven shown no scarcity level. The findings of the analysis state that 23 out of 26 cases analysed (88%) are likely to experience a permanent fall in the global supply of reserves in 2039.
2.2. Economic Indices
84 indirectly and through purely economic criteria. The issue of finding a proper index which can indicate scarcity is at the centre of their interests. In theoretical and empirical studies, indices of price, costs, rent of scarcity and substitution rate have been used as different indicators of scarcity.
2.2.1 Exploitation Cost of a Unit
Barnett and Morse (1963) used the unit cost as the scarcity criterion [5]. They on one occasion measured the ratio of the real cost of labour to the production cost of the manufacturing sector, and on another occasion the ratio of the total of labour cost and capital cost to the production cost of the manufacturing sector. Then, they concluded that the exploitation cost of a unit of mineral has considerably decreased from 1870 to 1957. They made an assumption that the reduction of cost indicates the decrease of scarcity, and the trend of the cost index showed that scarcity declined during this time. The reason for changes in the cost index are attributed not only to the technological changes, but also to the exploration of new ore deposits, imports, substitution and economies of scale. But it should be noted that the impact of this set of factors has not been separated; in other words, the factors and their effects on costs have not yet been separated from each other.
2.2.2 Price Index
One of the methods used by the economists is to measure scarcity through the trend in deflated prices (real price). According to this theory, price changes can show scarcity variations. In other words:
1. if the real prices keep rising, it shows that the technological changes have not compensated for the level of added physical scarcity;
2. the steady trend of the real prices shows that technological changes were able to control the increasing scarcity; and
3. the decrease of the real price reveals that the technological changes were more important than the increased scarcity.
Researchers have made many efforts to understand the relationship between prices and time, including examining the linear, quadratic, exponential and cyclical behaviours. The theoretical models of Pindyck (1978), Heal
(1981) and Slade (1982) use a U-shaped pattern (over time) for explaining the relationship between prices and technical progress [16, 17, 6]. The effect of the technology is clearly dominant in the beginning (first bend of the U-shaped curve), but at the end (the second bend of the U-shaped curve), it is overshadowed by the reserves’ depletion. Slade (1982) reviewed the price trend of 11 substances by linear and quadratic models [6]. She indicated that one cannot make generalizations regarding the scarcity of the resources by linear model. But by the quadratic model, conversely, trends of all the main metals and fuels formed a convex curve. Slate believed that the U-shaped behaviour of the price occurs due to the fact that the effect of the technological change is greater than the impact of the minerals’ depletion, and therefore the price trend will decrease. Then, the increasing depletion of the existing mines will gradually neutralize the effect of the technology, and this trend continues to the extent that the curve draws upwards.
There are some differences in how to calculate the real price, due to the method of the deflation of prices. The nominal prices are deflated in two ways. The first method is suggested by the Hotelling Rule, and is a standard approach. In this technique, which was used by Fisher (1977), Hartwick (1986) and Olewiler (1986), the general price index is applied for deflating [18,19]. The second method that is proposed by the production function and applied by Nordhaus (1973), deflates the prices by the average wages in the manufacturing sector [20].
85 they also studied the long-run 130-year trend (1870-1998) in order to find out the net effects of technological change on prices. According to their position, price changes in the short term may occur because of some market conditions, such as monopolies, the establishment of cartels, the proposing of taxes and the introduction of regulations, rather than as a reflection of scarcity and technological progress. They used an exponential function that has been changed into a semi-logarithm equation in the form of
i
i i t ,i
LnP=α + β +t e . They found out that, in the past century, new technology has exerted an influence over physical scarcity.
We can understand from the work of Brown and Wolk (2000) [7] that the trend of different minerals reveals the following facts:
1. Results achieved from deflation by the general price index and by manufacturing wages index are different from each other.
2. Results obtained from both methods for deflations indicate that energy commodities, such as oil, natural gas and coal, have a different status compared to those of other minerals.
3. An asymmetry has been observed between trends in different minerals, so each of them might need a different analysis which is not influenced only by technological changes. Certain minerals, like aluminium, as distinct from others, are new substances entering the world of economics. Others like lead are facing some environmental challenges; thus, there are drastic cuts in their consumption.
4. The effects of exploring new reserves that are currently undiscovered not because of technological changes but because of excessive expenditures for their exploration with unchanged technology, have not been considered in these trends.
5. The effects of the recycled scraps are not taken into account either.
6. Removing cycles cannot necessarily eliminate the effects of factors like monopolies, which are in the nature of mining activities.
7. Other factors, such as the establishment of appropriate circumstances in various countries, some of which include the dominance of the
market economy, the opening of the economy, and the promotion of investment, will expand investment in those areas which were not previously conducive to foreign investment. As a result of these conditions, scarcity will be reduced and prices will fall.
As stated above, scarcity changes should be attributed to many causes. To explain the factors affecting price fluctuations, it is better to separate short-run fluctuations. Such short-term variations may be caused by some market conditions, such as the existence of monopolies, cartels, taxes and regulations, and are not a reflection of scarcity and technological progress. So, researchers have preferred to study long-run trends in order to separate these short-term fluctuations. The main question is the question of why removing cycles can eliminate the effects of monopolies, which are in the nature of mineral activities, in so far as it can be concluded that removing cycles can cause a one-to-one correspondence between price changes and technological changes.
86
Fig. 1. Long-run trend for the prices of six metals: copper, aluminium, lead, nickel, zinc and tin [8].
The results of the study are as follows: 1. the price path for each mineral is an asymmetric and cyclical one. Accordingly, the U-shaped theory develops into the cyclical theory;
2. the long run price behaviours of different minerals are not similar, and each metal has its own special behaviour;
3. these asymmetries in their behaviours suggest that any form of aggregation of all these behaviours in a general and uniform trend will cause asymmetric cycles to neutralize each other, so the aggregating form cannot explain asymmetric cycles, unless related considerations in the aggregation process can be taken into account and applied. According to Cuddington and Zellou, the question is whether it can be claimed that the emergence of special trends for these minerals could be attributed to such factors as discoveries, depletion and technology changes [8]. They believe that factors influencing this trend are complicated. These curves will respond to technological changes, the rate of global economic growth and minerals’ supply-and-demand related determinants. The complexity and great variety of factors effective in price will not only make it difficult to specify the long-run trends of past, but should also warn against the usage of these trends for making predictions. These factors go beyond single-element analysis, i.e., the analysis of technological change as a single factor. Cuddington and Zellou did not discuss the separation of the effects of these factors, because this is a very complicated issue [8].
This will cause the links between scarcity and technology to remain obscure. One more point can be mentioned that considers the effective factors in prices beyond the technological issue. Reviewing scarcity, Tilton (2001) studied the links between price changes and some important events, as well as market distortions. He used a number of studies including Herfindahl (1957) [47] and Mikesell (1979) [21], as updated by Howie (2001) [22], and showed that the real price of copper was correlated with occurrences of cartels, wars, major economic recession and other market distortions during the period 1870-1997.
As a critique of some of the studies concerning the correlation between scarcity and technological changes which have suggested removing cycles, it can be argued that the prices of metallic minerals will be globally determined, but the business cycle of a particular country is not the same as that of other countries. Since asymmetry of business cycles among different countries is an established truth, so the cycle of a commodity, in which its price is determined in the world market, cannot be eliminated through an index introduced for removing cycles in a specific country. As a critique of the work of Tilton (2001), it can be suggested that though war occurs for only a limited time, its aftermath will continue to have wide repercussions for a long time after the war itself has ended [9].
87 identical with scarcity. It can be suggested that this price index cannot only result from technological change.
2.2.3 Rent of Scarcity (consumer cost)
One of the other indices used for evaluating the trend of scarcity is consumer price (scarcity rent). According to Hotelling’s theory, scarcity rent is the product price when the marginal cost is deducted from it. Concerning the related challenges, some points should be noted.
1. As the scarcity rent is not directly calculated and is found by assessing cost and price, it is difficult to find data appropriate for showing these calculations. Practically, measuring scarcity is strongly limited to the considerations related to the data. Because of the prevalence of vertical integration in natural resources industries, it is difficult to obtain data about in situ minerals prices and extraction costs of the unit. As a result of this, we sometimes rely on the prices of the processed products rather than the in situ ore price. For example, Barnett and Morse (1963) considered the cost of the processed product [5]. As there are many problems of direct calculation of in
situ prices, researchers attempted to introduce a
new and indirect way of measuring it, or introduced substitute indices. For calculating in
situ prices, Smith and Halverson estimated the
price of the in situ resource from the data related to the Canadian metallic mining industry from 1956 to 1974, which are vertically integrated, and they obtained the price using duality theory. Researchers finally obtained different trends for the in situ price, and the processed product price. Trends for the
in situ prices are increasing and the product
price shows a slightly upward trend. These achievements clearly show the risks of using product price as the substitute variable for the resource that has not been extracted.
In order to remove constraints for calculating rent of scarcity (in situ price), introducing substitute indicators has been tried. Fisher (1981) suggests the marginal exploration cost index [49]. But Devarjan and Fisher (1981) show that under risky and uncertain exploration [49], it is not necessary that the marginal exploration cost be equal to the in situ price of the resources.
2. Some direct computations indicate that the difference between the price and marginal cost does not necessarily reflect scarcity rent. Ellis and Halvorsen (2002) conducted a study for the largest international firm in the nickel industry (INCO, which was acquired by Companhia Vale do Rio Doce of Brazil for $17 billion and is now known as Vale Inco), and concluded that output price exceeded the marginal market cost [42]. This surplus is a reflection of two components: both scarcity rent and market power. The important point is that a greater part of this surplus is related to market power than consumer cost (scarcity rent). Since the mining industry is an industry with an oligopolistic structure, the achieved results can be generalized to many firms.
3. Scarcity rent for each mine is different from every other because the costs of the mines are not similar. For example, one can refer to the cost curve of iron ore in Figure 2(AME, 2010) [24]. The horizontal axis shows accumulative production of the firms, and the vertical axis indicates the extraction cost of the production unit.
88 This curve shows that extraction cost of one ton of iron ore differs in various mines and fluctuates within the range of $20 to $100 per ton. As the scarcity rent is obtained from the difference between price and cost, such a considerable difference between the extraction costs of one mineral indicates that the use of both cost and scarcity rent indicators presents various problems.
In a theoretical research study, Reynolds (1999) indicated that if uncertainty is sufficiently strong, it is almost impossible to apply the Hotelling principle. The suggested model shows how uncertainty concerning the resource base of minerals can obscure the scarcity trend and the real power of technology.
2.2.4 Elasticity of Substitution
Another factor influencing the risk of supply is the potential for raw materials to be substituted by other materials. If at any time a substitute is found for all the applications of a mineral, then that mineral will no longer be scarce. Brown and Field (1979), in research about steel and copper, used neoclassical analysis and found the labour force to be an appropriate substitute for them [25]. Similarly, Humphrey and Moroney (1975) showed that labour force and to some extent capital can be appropriate substitutes for most of the minerals [26].
The elasticity of substitution as a scarcity index presents many problems. One of the most important is that substitution of capital for a natural resource is relatively limited due to the physical laws of nature, and these constraints cannot be overcome by technological progress [27].
2.3 Conclusion on Scarcity Indices
There have been widespread scientific discussions over the issue of which one of the indices can be useful to measure scarcity. Each of the economic indices has been interpreted and used in several ways. Studying these indices shows that each of them has its own limitations, and the related trends are sometimes divergent. It seems that finding an economic indicator that shows the process of scarcity changes cannot be easily achieved. The economic scarcity indicators do not provide evidence that non-renewable resources are becoming scarcer; instead, they suggest that
other factors, especially exploration of new ore deposits, technological progress in mining technologies and the development of substitutes for these materials, have decreased the effect of scarcity on present ore deposits’ depletion. On the other hand, no relationship has been established between the economic indicators and the physical parameters, and, therefore, there is a gap or dichotomy between these two types of indicators.
Several factors affect changes in the quantity of the stock of reserves (scarcity change), and separating their impacts is not easily done. Studies concerning price index seek to attribute scarcity to an important factor by obtaining a long-term price trend and to remove the cycles from these trends. Some researches try to relate scarcity to either technological change or changes in the world’s economic structure. In these studies, technological changes have not been referred to as an objective and tangible factor, and they have instead been considered as an interpretation of the price index changes. Secondly, although it has been argued that technological change are develop gradually and in an evolutionary way in the related trends, in the mining industry, they grow in a practically revolutionary and discontinuous manner [28].
3. Methods
When the relationship between scarcity and any other variable like technological progress is explained, the process should have the power to predict the future. The proposed indices lack this power for three reasons:
1. The technological changes which are referred to in these methods are expressed in an overall and subjective manner. They are usually obtained from indicators or functions of aggregate production, though the aim should be measuring future scarcity quantities through technological changes.
2. Technological changes which influence scarcity go beyond those technological changes related to a specific mining activity, such as exploration and exploitation, so that for predicting scarcity changes in the future, these specific technological changes cannot be deemed reliable.
89 poorly known than the geology of a specific geographical region or geological structure. Thus, the possibility of its measurement is more limited compared to geology based on a specific geographical location.
The approach which is suggested in this paper has a reverse direction. Instead of the typical path, in which technological changes are estimated through changes in economic indices, the proposed path moves from technological changes to changes of scarcity, i.e., by studying technological changes, changes in scarcity can be estimated.
3. 1. Definition of Scarcity and its Domain To define scarcity, it shall be noted that nowadays metal is obtained from two main sources:
1. the primary source, which includes all types of identified reserves which are in form of the ores in the ground, and
2. the secondary resources or metal scraps containing metal which will be recycled.
The subtraction of the total primary and secondary sources from consumption shows the present stock of metals. In the first definition, stock of metal is the metal content of all primary and secondary reserves. In the second definition, reserves only include the primary supply of metal ore deposits that are economically ready for extraction. It depends on the needs of the users which definition is chosen. If the aim is to study the scarcity of geological reserves, the second definition should be used, but if the scarcity of metal, whether from the primary or secondary sources, is going to be considered, the first definition is preferable. The more commonly used in the world’s literature has been the second definition, i.e., geological scarcity. This paper has expanded the scope of the study and emphasizes scarcity of the first type, which encompasses the second as well, although the proposed approach can also analyse the second definition in isolation.
3.2. Inductive versus Deductive Method There are differences between production function at firm-level and aggregate-level (as in the macro, sector and industry levels). In micro-economics and at firm-level, four conditions hold.:
1. Technology and production function are concretized. When there is a change in technology, a new production function is introduced or technical coefficients of the production function change; this technological change will therefore affect the quantity of production objectively and non-inductively.
2. A firm’s production function is the maximum amount of a product produced in a given technology.
3. The product’s specifications should be clearly defined. Two different products cannot be explained in a single function, though they should have different production functions.
4. The production functions do not all follow the same form and there is not a single unique form for different industries.
At aggregate-level, seven conditions hold: 1. Theoretically, the total supply and demand functions (aggregate) are achieved from aggregation of supplies of firms and demands of individuals, respectively. But in practice, these functions are estimated non-aggregately.
2. At aggregate levels, especially at the macro-level and in the literature on growth, technological change is estimated and measured not directly, but based on an aggregate production function. Technical changes are measured indirectly by a variable, namely productivity, which is itself a remaining component in the production function, and is estimated by substitute variables like “research and development expenditures”.
3. At aggregate level (industry, sector, and macro), firstly, as the production at aggregate level is a combination of different products, it is not possible to accumulate all these products. So, by simplification, the problem of heterogeneous products is ignored and the commodities’ values are considered in an equation, namely production function, rather than by physical amounts, and practically no aggregation will be done.
4. The whole economy is considered as a firm which has a technology. This technology has no existence or objective reality of its own. It is a subjective concept which is used for making connections between inputs like labour and capital in an aggregate scale.
90 6. Completely homogeneous products of firms can be aggregated, but even in such a condition, one cannot talk about the same technology in all firms, because a similar and homogeneous commodity can be produced by different methods and techniques; thus, every particular method can produce a specific production function. Therefore, in aggregating the products of these firms, there is no possibility of establishing a single technology. 7. The concept of production function implies that production is conducted in an efficient manner and that productivity is complete. Including a component in the name of productivity or technology in the production function is irrelevant. Productivity arises when all firms are not acting with complete productivity; thus, the basic requirement of the production function is lacking.
Felipe and Fisher (2003) have conducted a compressed survey of the literature on aggregation in economics and its related problems [48]. In their paper, they mentioned the Cambridge-Cambridge controversies.
There has been an extensive body of literature developing from the 1940s onwards that shows that aggregating micro-production functions into a macroeconomic production function is an extremely difficult and problematic matter. The controversies known as the so-called Cambridge-Cambridge capital controversies that took place during the 1950s and 1960s were debates between Robinson, in 1953-54, in Cambridge, UK, [29], on the one hand, and Samuelson, in 1961-62, and Solow, in 1955-56, in Cambridge, USA [30,45], on the other. The most important question was: is aggregate production function a summary of “aggregate” technology? That is, suppose that one estimates an econometrically aggregate production function: are estimated coefficients (i.e., input elasticity and elasticity of substitute) technological parameters? Felipe and Fisher (2003) mention in one part of their conclusion that, although the starting points in the Cambridge-Cambridge capital controversies were radically and fundamentally different, the conclusions seem to converge: the notion of aggregate production function is rather problematic and complex in its entirety [48].
All the new growth-related literature has ignored this problem. With the surge of a new,
neoclassical endogenous growth literature from the 1980s onwards, described by Aghion and Howitt (1998) [31] and Barro and Sala-i-Martin (1995) [32], there has been renewed interest in growth and productivity that has propagated development of new models. The pillar of these neoclassical growth models is the aggregate production function. The important point in evaluating these growth models theoretically, is that such a production function does not exist, and the macro-production function is a fictitious entity. One of the first papers on endogenous growth was the work of Romer (1987) [33, 46]. In his discussion of the paper, Bernanke (1987) [34] argues that Romer’s work would be useful for thinking about artificial and unreal constructs such as (aggregate) output, (aggregate) capital and (aggregate) labour. The issue of aggregating production functions is more serious than issues in the other areas like consumption. Surveys conducted regarding aggregation imply that aggregations in areas like investment, capital and output do not have a deep and strong theoretical basis. Conditions for successful aggregation are so stringent that one can hardly believe these can exist in actual economies [35, 36]. Perhaps it can be said that there is no need for an aggregate production function in order to study growth, unless one insists that a neoclassical growth model is the only available concept that is based on production function [48].
91 predict. Also, investment cannot be planned based on overall technological changes. Therefore, real and contingent technology should be emphasized. Moreover, technological evolution in each activity is constantly observed by investors, economic activists and related policymakers, so these entrepreneurs and planners monitor evolutions and revolutions of technology related to their activity. Such an approach is much closer to the actual economic world. Because monitoring tangible technological R&D (not technological expenditures, which are considered an indicator for substitution of technological progress) will help define the related effects. For example, if an economic researcher monitors the current technical researches concerning changes in voltage or amperage in an electrolysis cell (converting alumina to aluminium), he can estimate the effects of these changes in decreasing the costs of energy, and consequently on changing the cut-off grade of Bauxite reserves. This research is based on monitoring successful studies. If there is no possibility of measuring the effects of this research in the laboratory or pilot stage, then it
can be estimated during initial entry into the market. The power of estimation depends on the degree of information and availability of the activities being carried out in the technological research and development process.
3.3 Systemic and Chain Approach to Technology
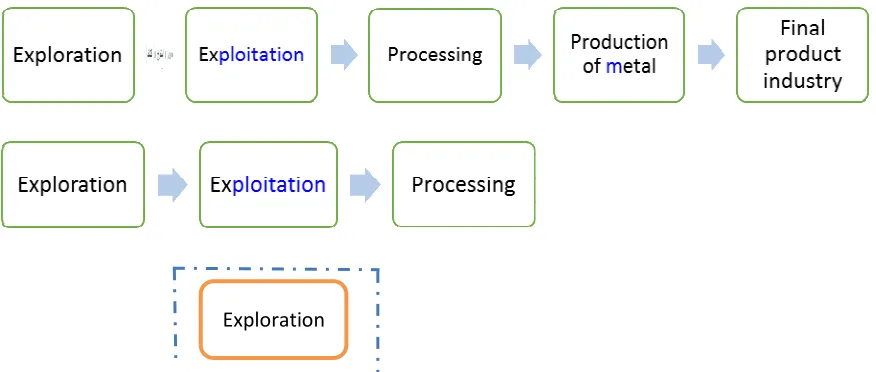
System Technology Definition and its Boundaries. Technology is used to produce a product. If we consider an industry vertically, consisting of a chain or a system of different activities, the output of each sector is used as an input of the next sector. All these interactions are considered as a production system. A set of technologies used in this production system to produce a final product is defined as system technology. The boundaries of a system or the chain depend on our definition of the production system. According to the value chain approach, each mineral is within a chain, starting from the exploration activity to the exploitation, processing, and production of a mineral commodity like metal, the intermediate products and lastly the final product (Fig. 3).
Fig. 3. Value chains of minerals from exploration to consumption.
Each of these subsystems or a set of subsystems can itself be defined as a system. In the non-chain view, each of these subsystems forms an independent system, and its connection with the pre- and post-activity is ignored. Thus, each of the subsystems is assumed to be an independent production system; the system’s boundaries are drawn around the subsystem itself, and the output of each is considered as the product of the system. If, instead of a single-activity approach, a system comprising a number of activities, or all of them, is assumed, then the product of this system will be only one product, the product which exits in the final stage. For example, if we expand the boundaries of the system to the consumer good, then the consumer good will be the only output of the system, and the
92
Fig. 4. Different systems, including activities of the mineral chain.
Selection of the system boundary depends on the objective and analytical perspective of each researcher. In studying scarcity, the decision of whether to limit the system to one activity or expand the system depends on a set of factors affecting the scarcity variable. Since we seek to determine the relationship between scarcity and technological change, we should consider all the technologies in different activities affecting scarcity, and then the boundaries of the system or the chain should be indicated.
4. Minerals Industries’ Specification
4.1. Technological Changes of the Mine Chain and the Expected Horizon
The question is whether mining is a conservative and stodgy industry, or a sophisticated and high-tech one. Anderson and Tushman (1991) compared technological changes of some industries [28]. They showed that the glass and cement industries, respectively, witnessed three and two discontinuous technological changes over 100 years, whereas the microcomputer industry experienced three main discontinuous technological revolutions during 24 years. The system studied by Anderson and Tushman (1991) concerning glass and cement began from the processing stage (transforming silica to glass, and crushed limestone and other substances to cement) [28]. They did not expand their study of the glass and cement industry to the stages of the extraction of the
substances from the ground, their preparation or their transportation.
In the mining industry, these changes have been separately studied for each activity of the industry: processing, exploitation, smelting and geological science. Each activity has been consistent with mature industries like cement and glass. Now, if the mining industry is considered as an integrated value chain consisting of exploration, exploitation, ore dressing and processing (smelting and refining) activities, the number of innovations and technical revolutionary changes in this industry as a whole during the last century has been 10 to 12 [37]. This type of definition and classification of a system will bring this industry up to the progress rate of the microcomputer industry. Although the components of this industry are each categorized under mature industries, changes in the boundaries of the mining industry system will cause the range of system’s changes to reach the scope of changes in a high-tech industry. Therefore, if we suppose the industry to be a one-activity system, its technological changes will be few, and the estimated growth rate of the reserves will become much less, compared to a situation in which aggregate effects of the changes in different activities in the value chain are taken into account.
93 and evident technological changes on scarcity, it is therefore necessary to consider the average period of change in each of the activities from the time of entry into the industry to the ageing and alterability time. As noted, the conducted researches on technological changes in the mining industry show that:
1. the subsystems of this industry have on average witnessed radical changes every 30 years, and
2. investment in a mine from the exploration to the end of exploitation usually happens in the same time period, i.e., 30 years on average. Thus, the length of 30 years is an acceptable time period to consider for investigating the effects of technological changes on scarcity.
4.2. Mechanism of Effectiveness and Measurability of Technological Changes on Scarcity
What is usually discussed in the literature of economy is that measuring technological changes is impossible or very difficult. In this paper, we claim that although this change is difficult to measure, but it can be done according to specific objectives. Technology is an entity that has different effects. Each technological change will affect different variables, like costs, the quantity of production, quality of products, required human resource, intensity of use of raw materials and energy consumption and costs. So it should be made clear when talking about technological changes which variable it is that is going to be influenced by the related changes. In other words, technological change is an immeasurable and general concept when the influenced variable is not defined. In this paper, we seek to study the effects of technological change on the mineral reserves (increasing or decreasing of scarcity), so the related changes are measured according to the effect that they impose on the scarcity or the reserves. Technological change is expressed based on the equivalent amount of the available reserves or scarcity. In order to specify the activities of this system, some examples are presented as follows in order to show the effects of different technologies on scarcity:
In an exploration subsystem, the entry of remote sensing technology directly caused an increase in detection rates and consequently the volume of reserves. In the exploitation subsystem, optimization and change of technology in the use of remote control equipment made it possible to exploit the deeper areas. Thus, access to deeper layers and extraction of their reserves means an increase in reserves and a decrease of scarcity. In the processing subsystem, the entry of a flotation technique led to the exploitation of copper sulphide with an economically low grade, and a large volume of reserves were added to the present stock as economic reserves. In the future, new economic and technological conditions may provide an appropriate basis for extracting copper from silicate minerals. This technology makes available copper from silicate reserves and consequently causes scarcity to decrease. In production of a metal, if the technology of steel production changes and makes it possible to replace lower quality ore deposits and low cokeable coals for highly concentrated iron ore and coking coal, then lower grade iron ore and coals with lower quality will be used, and scarcity will therefore decrease. This process has been used by Corex technology in making steel. Corex technology is a smelting reduction process, created as a more environmentally-friendly alternative to the blast furnace. In the recycling subsystem, change in technology of the metal scraps recycling industry and a rise in recycling efficiency will lead to the obtaining of greater amounts of metals from the scraps. Thus, the demand pressure for exploitation of deposits will be reduced, and scarcity will drop. In the final product subsystem, change in technology for producing, for example, aluminium drinks cans, makes it possible to produce cans with thinner aluminium sheets. So, aluminium usage will be reduced in each can due to thickness change. Scarcity will be accordingly reduced.
94 dressing) and processing (smelting and refining), the technology of the producing consumer or the final commodities, and recycling. Changes in technologies of all subsystems of the chain will influence the scarcity, and, therefore, scarcity change is a function of the technologies’ changes in all activities.
5.Explaining the Correspondence between Technological Change and Scarcity In order to explain this relationship, we will initially introduce chain technology, and then indicate a general relationship of scarcity which describes the scarcity relationship with the effective factors. The scarcity and technological change relationship will finally be obtained. The final step is explaining how to obtain variables equivalent to the technical changes.
5.1. General Relationships of Scarcity We will begin from system technology in order to provide a conceptual model of the relationship between scarcity and technology. The system technology is a set of technologies of different subsystems, as shown in Figure 3:
(Chain-tech) = {(exp-tech), (ext-tech),
(pro-tech), (mi-tech), (recy-tech), (ci-tech)} (1)
where (Chain-tech) stands for chain technology; (exp-tech) denotes exploration technology; (ext-tech) is exploitation technology; (pro-tech) represents processing technology (ore dressing); (mi-tech) refers to metal industry technology; (recy-tech) is recycling technology; and (ci-tech) stands for consumer industry (goods) technology.
5.2. Chain Technology
Reserves’ growth during a certain period means the change in the amount of reserves in the beginning and end of the period. Growth function is a function of technological changes, exploration efforts and changes in other factors (economic and non-economic). A set of these factors is considered the vector of non-technical factors. Hence, the function of metal scarcity is defined as Eq. 2:
(2)
MS= f(chaintech , EE , 0)
where,
MS stands for metal scarcity, chaintech is the chain technology level, EE represents
exploration efforts, and O denotes a vector of the other factors’ group.
5.3. General Relation between Scarcity and Effective Factors
The function of reserves’ growth is equivalent to changes in the stock of reserves. It is assumed that, firstly, technology will affect economic factors (included in the vector O) and exploration efforts too; and, secondly, changes in the vector of the other factors’ group will provide conditions for change in technology and exploration efforts. Since we are studying technological change, for simplification we will put exploration efforts within the group of non-technological factors (vector O) and the function will then have two components (factors) including technology and vector of other factors (Eq. 3).
MS= f(chaintech , 0) (3)
These two factors have an interacting relation with each other. With this explanation, a conceptual model can be derived for the reserves’ growth (scarcity change) according to Eq. 4. This growth can be positive, zero or even negative.
f f o
d ( MS ) d cha int ech
cha int ech o cha int ech cha int ech
f f
d cha int ech do do
o cha int ech o
δ δ δ
=δ +δ δ
δ
δ δ
+δ +δ δ
(4) where d (MS) is the scarcity change.
Change in any of two factors (two sets of variables) will directly and indirectly affect changes of the scarcity index. It can be noted that:
1. change in technology directly changes the stock of reserves, and
2. it will indirectly cause changes in costs and this will lead to more exploration and the discovery of new reserves, or the use of reserves with a lower grade.
95 reserves), so in Eq. 4 only the term
f d cha int ech cha int echδ
δ is considered, as the
technological impact affecting scarcity changes. The scarcity change resulting from the technological developments can be expressed as follows:
tech MS
d ( MS )
cha int echδ
= δ (5)
where d ( MS )tech represents the scarcity change (stock of reserves change) due to technological changes.
5.4. Variable Detection for Technical Changes
As mentioned before, the level of technology cannot be measured in the form of a quantity or number. The important problem is, in a system with its related technology, how it is possible to attribute technological changes to the function variable, especially when the system consists of a number of activities with different technologies. Variables are different in type, and as the dependent variable is the extent of change in the stock of reserves, change in each technology should be expressed with the indicator of change in the stock of reserves (rate of change).
The matter of making technological changes proportionate with the quantity of scarcity is related to the subject of homogenizing dimensions in both sides of the equation. In technical functions, the
dimensions of both sides should be equal. In other words, if the dimension of scarcity change (left side of Eq. 5) is in tonnage, the dimension of the right side should be in tonnage too. Therefore, the components of technological changes should have an equivalent in the amount of scarcity or (reserves). Finding such variables for each activity is essential. Otherwise, it is impossible to associate technological changes with the function variable (target variable).
In each subsystem, different technological changes may occur, and each change can have a different impact compared to others. Here, we refer to some of these changes: each substitute variable for scarcity consists of one parameter and one variable. The parameter is indicative of technological change which can be measured, calculated or estimated. The variable component is one of the aspects of technical measures which are influenced by the technical change. Table 3gives some technological changes in each activity, the substitute variable and its components.
This process of detecting variables has been conducted according to the principle of homogeneity of dimensions. Now, everything on both sides of Eq. 5 should have dimensions according to metal tonnage. To simplify, if interactions of technological relations between the subsystems are ignored, changes in scarcity (stock of reserves) stem from changes in each of the separated activities that can be stated as Eq. 6:
d ( M S )cha int ech d ( M S )ex p tech d ( M S )ex t tech d ( M S )pro tech d ( M S )m i tech d ( M S )recy tech
d ( M S )ci tech
= − + − + − + − + −
+ − (6)
where,
d ( M S )exp,d ( M S )ex t tech,d ( M S )pro tech d ( M S )mi tech ,d ( M S )recy tech
− −
− −
and d ( MS )ci tech− are the scarcity changes due to technology of exploration, technology of exploitation, technology of processing, technology of metal industry, technology of recycling, and technology of consumer industry, respectively. d ( MS )cha int ech Stands for changes in the stock of reserves (scarcity) due to the total technological changes.
All the factors in Eq. 6 can be measured, calculated or estimated. It can also be noted that impacts of technological changes on reserves
are not limited to only the above factors. For example, change in the technology of processing may not only lead to processing reserves with lower grade, but may also cause processing with the present grade to have improved efficiency. The increase in processing may cause scarcity to in fact decrease.
h
a
b
i e
t a
l./
In
t.
J.
M
in
. &
G
eo
-E
n
g
.,
V
o
l.4
8
, No
.1
, J
u
n
e
2
0
1
4
9
6
Change in technology Parameter Symbol for
parameter Variable
Symbol for variable
Substitute variable for the function
Symbol for substitute variable for the function
Exploration (change in geophysical method for
instance)
Exploration ratio: the amount of discovered reserves to exploration
costs (in statistical sample)
A Planned exploration
costs Exp
Excess reserves due
to discovery d(MS) exp = a * exp
Exploitation (increasing technical potential to extract
from increased depths)
Increased
Depth B
Reserves available at intervals/in the increased depths
Ext
Excess of reserves available for exploitation
d(MS) ext = b* ext
Processing (entry of flotation or bio-leaching)
Ratio of increasing extracted mineral to
each unit of grade
C Amount of lowered
grade Pro
Excess of excess of reserves due to new
grade
d(MS) pro= c * pro
Metal (extracting aluminium from nepheline syenite)
Increase in the amount of metal recycled in
the weight unit of mineral extracted
E
The total amount of metal content in total of
known reserves
Met Added reserves
from new mineral d(MS) mi= e* met
Consumer goods (decreasing thickness of sheets used in
cars)
Decreasing intensity of
use of goods F
Total amount of
consumer goods Con
Reserves equivalent to decreased intensity use
d(MS) ci= f * ci
Scraps (improved techniques of separating scraps from
each other)
Increase in recycled metal from one weight
unit of scrap
G Total amount of scraps
available Sal
Reserves equivalent to surplus of recycling scraps
d(MS) recy = g * sal
97 secondly, a special history in terms of the quantity and quality of exploration in the earth’s surface and depth, and, finally, the level of technologies in the different activities of the system are specific and the intensity of use of each mineral is distinct to this country.
Considering the geographical scope, there will be a possibility to choose larger geographical units, consisting of as many as countries as one may desire. The scarcity can then be studied in relation to this large geographical district. The selected geographical zone may comprise many or individual countries of the world. Accordingly, the scarcity changes of each larger geographical area can be studied based on the aggregation of its constituent countries. This issue is similar to the principle of the aggregation of supplies of different firms to obtain the aggregate supply of a market.
6. Conclusions
One of the important factors in deciding on investment in the mining industry is a clear understanding by policymakers and investors of the problem of scarcity. The economists have made considerable attempts to introduce indices indicating scarcity. These indices are divided into two physical and economic indicators. One of the weak points of these indices is the lack of correlation between them. In addition, both indices are past-oriented and lack efficiency for predicting the future. The effective factors influencing scarcity include: exploration of new ore deposits; technological progress; utilization of substitute materials; economic growth periods which have led to economic restructuring, such as the period of industrialization in Europe, the United States, Japan and recently in the developing countries, most importantly China and India; war; monopolies; cartels; market distortions and recycling of scraps. Technological changes are the main factors affecting the scarcity. Studies have not separately discussed the impacts of these factors, since the issue is very complicated. One of the attempts made to explain the relationship between scarcity and technological changes involves the removal of cycles from the indices. In these studies, technological changes have not been cited as an objective and demonstrable issue, but as an
explanation for the changes in the scarcity index. On the whole, one can say that this makes the relation between the scarcity and technological change remain obscure. This paper seeks to introduce a new approach for explaining the impact of technological changes on scarcity. It first presented a different definition of the scarcity, and then, by adopting a methodology of inductive as opposed to the more common deductive method, it considered the requirements of this approach. When we clarify the relationship between scarcity and any other variable, such as technological changes, this approach should have potential for predicting the future. The proposed indices lack this potential for three reasons:
1. The technological changes referred to in them are given overall. Technological changes are obtained from indices or aggregate production functions, whereas the objective is, conversely, to calculate future scarcity amounts from technological changes.
2. Technological changes which can objectively affect scarcity go far beyond changes related to a particular mining activity, such as exploration, and there is a combination of changes in different activities of the system.
3. Due to the complex and not fully understood nature of geology, studying geological characteristics is very difficult unless we determine a particular geographical region or a specific geological structure.
98 introduced. This integrated chain system consisted of: exploration, exploitation, processing (ore-dressing), metal production, production of consumer commodities, and recycling. Finally, for the third problem, it is recommended to investigate a particular geographical zone. According to the abovementioned principles, the direct effects of technological changes on scarcity were formulated. The mechanism of the impacts of the different activities of the system was explained. In conclusion, a method was suggested for homogenizing both sides of the conceptual model, and the ways of obtaining substitute variables were provided. It is believed that this approach can be applied to evaluate the effects of technological changes on scarcity. It has the ability to estimate future scarcity and can be applied by investors and policymakers.
References
[1] Malthus, T. (1798). An essay on the principle of population as it affects the Future Improvement of Society. Published by Ward Lock.
[2] Ricardo, D. (1817). The Principles of Political Economy and Taxation, Cambridge University Press.
[3] Mill, J.S. (1862). Principles of Political Economy, New York: Appleton.
[4] Hotelling, H. (1931). The economics of exhaustible resources. Journal of Political Economy 39, pp. 137-175.
[5] Barnett, H.J. and Morse, C. (1963). Scarcity and Growth. Baltimore, Johns Hopkins for Resources for the Future.
[6] Slade, M.E. (1982). Rends in Natural-Resource Commodity Prices, An Analysis of the Time Domain Journal 9(2), pp. 122-137.
[7] Brown, S.P.A. and Wolk, D. (2000). Natural resource scarcity and technological change, Economic and Financial Review, 1, pp. 2-13.
[8] Cuddington, John T. and Zellou A.M. (2012). A Simple Mineral Market Model: Can it produce Super Cycles in prices? Colorado School of Mines. Working Paper 2012-05
[9] Tilton, J.E. (2001). Depletion and the Long-run Availability of Mineral Commodities, IIED. Working Paper sponsored by the Mining, Minerals and Sustainable Development Project
and Resources for the Future, Workshop in Washington, DC.
[10] Sohn I. (2006). Long-term projections of non-fuel minerals- We were wrong, but why? Resources Policy 30, pp. 259-284.
[11] Diederen, A.M. (2009). Metal minerals scarcity: A call for managed austerity and the elements of hope TNO Defence, Security and Safety, Rijswijk, The Netherlands;
[12] Kesler, S.E. (2007). Mineral Supply and Demand into the 21st Century, Briskey, J.A., and Schulz, K.J., eds., Workshop on Deposit Modeling, Mineral Resource Assessment and Sustainable Development, pp. 55-62.
[13] Cohen, D. (2007). Earth's natural wealth: an audit, New Scientist Magazine, Issue 2605.
[14] Frondel, M., Grösche, P., Huchtemann, D., Oberheitmann, A., Peters, J., Angerer, G., Sartorius, C., Buchholz, P. and Wagner, M. (2007). Trends der Angebots- und Nachfragesituation bei min eralischen Rohstoffen Rheinisch-Westfälisches Institut für Wirtschaftsfor schung (RWI Essen), Fraunhofer-Institut für System- und Innovationsfors chung (ISI) & Bundesanstalt für Geowissenschaften und Rohstoffe (BGR) Berlin und Bonn, Germany.
[15] Meadows, D.H., Meadows, D.L., Randers, J. and Behrens W. (1972). The Limits to Growth: A Report for the Club of Rome ́s Project on the Predicament of Mankind, New York: Universe Books.
[16] Pindyck, R.S. (1978). The optimal exploration and production of nonrenewable resources, Journal of Political Economy, 86 (5), pp. 841-861.
[17] Heal, G. (1981). Scarcity, efficiency and disequilibrium in resource markets, Scandinavian Journal of Economics, 83(2), pp. 334-351.
[18] Fisher, A.C. (1977). On Measures of Natural Resource Scarcity, IIASA Research Report RR-77-019.
[19] Hartwick, J. and Oliwiler, N. (1986). The economics of natural resource use, Publisher Harper & Row.
99 [21] Mikesell, R.F. (1979). The World Copper
Industry, Baltimore, Johns Hopkins for Resources for the Future.
[22] Howie, P. (2001). Long-Run Price Behavior of Nonrenewable Resources Using Time-Series Models. Unpublished manuscript, Colorado School of Mines.
[23] Ellis G.M. and Halvorsen R. (2002). Estimation of Market Power in a nonrenewable Resource Industry, Journal of Political Economy, 110(4), pp. 883-899.
[24] AME Group (2010). cost curve: Iron Ore. Data sets.
[25] Brown, G.M. and Field, B. (1979). The Adequency of Measures for Signaling the Scarcity of Natural Resources, in Scarcity and Growth Reconsidered, Johns Hopkins University Press, pp. 218-248.
[26] Humphery, D.B. and Moroney, J.R. (1975). Substitution among Capital, Labour and Natural Resource Products in American Manufacturing. Journal of Political Economy, 83, pp. 57-83.
[27] Krautkraemer J.A. (2005). Economics of Natural Resource Scarcity: The State of the Debate, Discussion Paper, pp. 05-14.
[28] Anderson, P. and Tushman, M.L. (1991). Managing through Cycles of Technological Change, Research/ Technology Management, May/June, pp. 26–31.
[29] Robinson, J. (1953). The Production Function and the Theory of Capital. Review of Economic Studies 21 (2), pp. 81-106.
[30] Samuelson, P. (1962). Parable and Realism in Capital Theory: The Surrogate Production Function, Review of Economic Studies, 29, pp. 193-206.
[31] Aghion, P. and Howitt, P. (1998). Endogenous Growth Theory, MIT Press, Cambridge, M.A.
[32] Barro, R.J. and Sala-i-Martin, X. (1995). Economic Growth, McGraw Hill, New York.
[33] Romer, P. (1987). Crazy Explanations for the
Productivity Slowdown. NBER
Macroeconomics Annual, pp. 163-202.
[34] Bernanke, B. (1987). Comment. NBER Macroeconomics Annual 1987, MIT Press, Cambridge, MA., pp. 202-205.
[35] Houthakker, H.S. (1955). The Pareto Distribution and the Cobb-Douglas Production
Function in Activity Analysis, Review of Economic Studies, 23, pp. 27-31.
[36] Nataf, A. (1948). Sur la Possibilit de Construction de Certains Macro modles. Econometrica, 16 (3), pp. 232-244.
[37] Bartos, P.J. (2007). Is mining a high-tech industry? Investigations into innovation and productivity advance. Resource policy 32, pp. 149–158.
[38] Clugston, C. (2010). Increasing Global Nonrenewable Natural Resource Scarcity—an Analysis, The Oil Drum. Working Paper.
[39] Commission of the European communities (2008). Brussels, The raw materials initiative — meeting our critical needs for growth and jobs in Europe.
[40] Douglas. B.R. (1999). The mineral economy: how prices and costs can falsely signal decreasing scarcity, Ecological Economics, 31, pp. 155–166.
[41] Devarjan, S. and Fisher, A.C. (1981). Hotelling’s “Economics of Exhaustible Resources” Fifty Years Later, Journal of Economic Literature, Vol. XIX, pp. 65-73.
[42] Halvorsen, R. and Smith, T.R. (1984). On Measuring Natural Resource Scarcity. Journal of Political Economy, 92 (5), pp. 954-64.
[43] Heap, A. (2005). China - the Engine of a Commodities Super Cycle, New York City: Citigroup Smith Barney.
[44] Meadows, D.H., Meadows, D.L. and Randers, J. (1992). Beyond the Limits: Global Collapse or a Sustainable Future, London: Earthcan Publications.
[45] Solow, R. (1955-56). The Production Function and the Theory of Capital, Review of Economic Studies 23 (2), pp. 101-108.
[46] Romer, P.M. (1987). Growth Based on Increasing Returns Due to Specialization, American Economic Review, 77(2), pp. 56-62.
[47] Herfindahl, O.C. (1959). Copper Costs and Prices. Baltimore, Johns Hopkins for Resources for the Future.
[48] Felipe, J. and Fisher, F.M. (2003). Aggregation in Production Functions: What Applied Economists Should Know, Metroeconomica 54 (2, 3), pp. 208–262.
100 [50] Sauré, Ph. (2010). Over reporting Oil
Reserves, Swiss National Bank Working Papers.
[51] Tahvonen, O. (2000). Economic Sustainability and Scarcity of Natural Resources: A Brief Historical Review, Resources for the Future, working and discussion paper.
[52] Leontief, W. (1977). The Future of the World Economy. New York: Oxford University Press.
[53] Manthy, R.S. and Tron, J.R. (1978). Natural Resource Commodities- A Century of Statistics, Johns Hopkins, Baltimore.
[54] Harris, D.P. and Skinner, B.J. (1982). The assessment of long-term supplies of minerals.
![Table 1. Comparison of static index in the years 1979 and 2000 [10].](https://thumb-us.123doks.com/thumbv2/123dok_us/8957450.1866818/3.595.89.506.459.572/table-comparison-static-index-years.webp)
![Fig. 1. Long-run trend for the prices of six metals: copper, aluminium, lead, nickel, zinc and tin [8]](https://thumb-us.123doks.com/thumbv2/123dok_us/8957450.1866818/6.595.137.462.92.268/fig-long-trend-prices-metals-copper-aluminium-nickel.webp)
![Fig. 2. Curve of iron ore Cost [24].](https://thumb-us.123doks.com/thumbv2/123dok_us/8957450.1866818/7.595.158.446.594.729/fig-curve-iron-ore-cost.webp)