R E S E A R C H
Open Access
A network embedding model for
pathogenic genes prediction by multi-path
random walking on heterogeneous network
Bo Xu
1,2, Yu Liu
1, Shuo Yu
1*, Lei Wang
3, Jie Dong
3, Hongfei Lin
3, Zhihao Yang
3, Jian Wang
3and Feng Xia
1,2FromIEEE International Conference on Bioinformatics and Biomedicine 2018 Madrid, Spain. 3–6 December 2018
Abstract
Background: Prediction of pathogenic genes is crucial for disease prevention, diagnosis, and treatment. But traditional genetic localization methods are often technique-difficulty and time-consuming. With the development of computer science, computational biology has gradually become one of the main methods for finding candidate pathogenic genes.
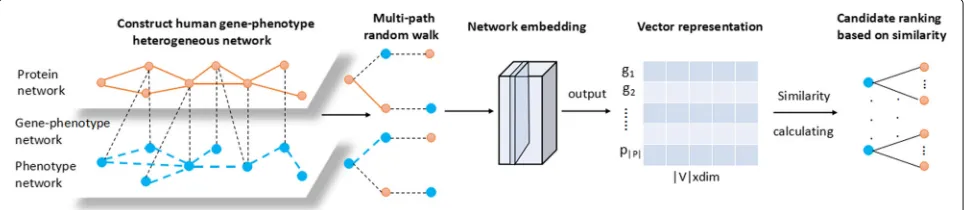
Methods: We propose a pathogenic genes prediction method based on network embedding which is called Multipath2vec. Firstly, we construct an heterogeneous network which is calledGP−network. It is constructed based on three kinds of relationships between genes and phenotypes, including correlations between phenotypes, interactions between genes and known gene-phenotype pairs. Then in order to embedding the network better, we design the multi-path to guide random walk inGP−network. The multi-path includes multiple paths between genes and phenotypes which can capture complex structural information of heterogeneous network. Finally, we use the learned vector representation of each phenotype and protein to calculate the similarities and rank according to the similarities between candidate genes and the target phenotype.
Results: We implemented Multipath2vec and four baseline approaches (i.e., CATAPULT, PRINCE, Deepwalk and Metapath2vec) on many-genes gene-phenotype data, single-gene gene-phenotype data and whole
gene-phenotype data. Experimental results show that Multipath2vec outperformed the state-of-the-art baselines in pathogenic genes prediction task.
Conclusions: We propose Multipath2vec that can be utilized to predict pathogenic genes and experimental results show the higher accuracy of pathogenic genes prediction.
Keywords: Prediction of pathogenic genes, Heterogeneous network embedding, Disease-causing genes
Background
Predicting pathogenic genes is important in disease pre-vention, diagnosis, and treatment [1, 2]. Understanding the pathogenic genes is useful to prevent and control those genetic diseases fundamentally. Revealing the relation-ship between genetic diseases and disease-causing genes has become an important goal of human genetics [3]. Researchers are committed to predicting the pathogenic
*Correspondence:[email protected]
1School of Software, Dalian University of Technology, 116000 Dalian, China Full list of author information is available at the end of the article
genes of diseases and have achieved impressive results [4,5]. Though some phenotypically similar diseases have been confirmed to be related with some specific genes, many pathogenic genes are still undetected for various reasons. It’s still a great challenge to detect those unknown pathogenic genes.
Traditional genetic localization methods are gener-ally expensive, technique-difficulty and time-consuming. Therefore, there is an urgent need to develop a high-precision method for predicting pathogenic genes [6–8]. It can also improve the efficiency of discovering pathogenic
genes and shorten the period of discovering pathogenic genes, laying the foundation for the development of biotechnology, and personalizing gene therapy, etc.
With the accumulation of protein-protein interaction data, it has been a research hotspot in bioinformatics that predicting the pathogenic genes from protein-protein interaction networks [9–12]. Computational biology has gradually become one of the main methods for find-ing candidate pathogenic genes. Calculatfind-ing the func-tional similarity between unknown candidate genes and known pathogenic genes is one of the most popular methods for finding unknown candidate genes. Discov-ering pathogenic genes by network topological features in human protein-protein interaction networks has made some progress [13, 14]. Moreover, many scholars have made efforts to identify genetic phenotype associations rather than gene-diseases associations [10,15]. Lage et al. scored protein complexes using gene-phenotype data and genes are ranked according to their asscioation with scored protein complex [10]. Wu et al. established a regression model by calculating a score to mea-sure the correlation between the phenotype similari-ties and the functional genetic relatedness of disease genes [15].
Some studies have shown that similar phenotypes are generally caused by functionally related genes [16–18]. Driven by this observation, researchers have proposed another method of prediction of pathogenic genes that predict candidate pathogenic genes by gene-phenotype associations [19–22]. Researchers prioritize candidate pathogenic genes of a given disease phenotype by con-structing a heterogeneous network that consists of pheno-type network, gene(protein) network, and known disease gene-phenotype associations [23]. As it is well known, the phenotypes are regarded as vertices and the links between highly similar phenotypes are regarded as edges in the phenotype network. As for the protein network, the indi-vidual proteins are regarded as vertices and the detected protein-protein interactions (PPI) are regarded as edges between the two corresponding vertices. The two net-works, i.e., phenotype network and protein network, are connected by the known disease gene-phenotype associ-ations. This kind of heterogeneous network can be used to infer causative genes of a given phenotype. Many meth-ods calculate the similarities between the candidate genes and the target phenotype using the heterogeneous net-work [24, 25]. Li and Patra proposed a random walk with restart algorithm to infer the gene-phenotype on the heterogenous network [24]. Yang et al. added the information of real protein complexes into the heteroge-nous network, which constructed a novel protein com-plex network [25]. However, studies are restricted by the existing big differences between the properties of ver-tices or links in the heterogenous network. Predicting
pathogenic genes of diseases by the heterogenous network is restricted by the complex network properties. Recently in the field of computer science, network embedding algorithms have been proposed [26–30]. Neural network-based learning models can represent latent embeddings into low-dimensional space while capturing the internal relationships of rich and complex data. It has been proved that the network embedding algorithms perform well in clustering, network classification and link prediction, etc [31,32]. Deep learning techniques are first introduced to analyze graphs in Deepwalk algorithm, which have been proved to be success in natural language processing as well as network analysis [26, 33, 34]. Abundant stud-ies extended and modified the basic Deepwalk model in order to implement this model into the heterogeneous network.
In this work, we use network embedding to pre-dict causative genes in human gene-phenotype hetero-geneous networks. We propose a network embedding method called Multipath2vec, which aims to precisely predict pathogenic genes of a target disease. In Multi-path2vec, we first construct a human gene-phenotype heterogeneous network. And we design the multi-path which can better capture correlations between different types of vertices to guide random walk in the human gene-phenotype heterogeneous network. Then we use network embedding algorithm to learn features of the constructed networks. Finally, we calculate the similari-ties between genes and the target phenotypes and then predicts the pathogenic genes. We make the following contributions.
• We propose a pathogenic genes prediction algorithm called Multipath2vec. In Multipath2vec, we propose a special multi-path random walk to make better use of the information of the heterogeneous network.
• We introduce network embedding algorithm in the prediction of pathogenic genes. To our best knowledge, this is the first attempt to exploit the network embedding method in the prediction of pathogenic genes.
• The research strategy of this work can inspire the resolution of analysis task in bioinformatics.
The structure of our paper is organized as follows. “Methods” section illustrates the Multipath2vec algorithm in detail. Experiments are introduced in “Results” and “Discussion” sections concludes the paper.
Methods
Fig. 1. First, a human gene-phenotype heterogeneous network is constructed based on the correlations between genes and genes, phenotypes and phenotypes, genes and phenotypes. Then we design multi-path to guide random walk in the human gene-phenotype heterogeneous net-work and represent the netnet-work intoddimension vectors. And then we calculate the similarities between genes and the target phenotypes. After that, we can get the ranking list of candidate genes.
Heterogeneous network construction
The heterogeneous network consists of two types of nodes and three types of links. In the heterogeneous network, nodes include the gene nodes and the phe-notype nodes. Edges are connected in three relation-ships: the relationship between phenotype and gene, the relationship between two genes, and the relation-ship between two phenotypes. The edge between two phenotypes is the link between two highly similar ver-tices. The edge is connected between two correspond-ing genes when there exists the experimentally detected protein-protein interaction. Besides, the known disease gene-phenotype associations are used to connect gene and phenotype. For a better understanding, we give the formal definition of the heterogeneous network as follows.
A Heterogenous Networkis defined as a graphG = (V,E,T)in which each vertexvand each edgeeare asso-ciated with their mapping functionsφ(v) :V → TV and ϕ(e) :E →TE, respectively.TV andTEdenote the vertex types and relation types, where|TV| + |TE|>2.
For predicting the pathogenic genes of the known dis-ease, we first construct the human gene-phenotype het-erogeneous network. In order to precisely describe the relationships in the human gene-phenotype heteroge-neous network, we use proteins/genes (i.e., g) and phe-notypes (i.e., p) and several relationships between them to represent heterogeneous networks. Proteins/genes and phenotypes are represented as vertices and the edges are
denoted as phenotype similarity (i.e., p-p), protein-protein interaction (i.e., g-g), and gene-phenotype association (i.e., g-p/p-g), respectively. We give a clear definition of the human gene-phenotype heterogeneous network that we construct in this paper. We name this network as GP−network.
AGP−networkis defined as a graphG = (V,E,T), wherein V = G∪P. G is gene set andP is phenotype set.T is type set, which T = TV∪TE. TV andTE rep-resents the sets of object type and relation type, where
|TV| + |TE| > 2. In G, each vertex vis associated with its mapping functionφ(v) : V → TV and each edgeeis associated with its mapping functionsϕ(e):E→TE.
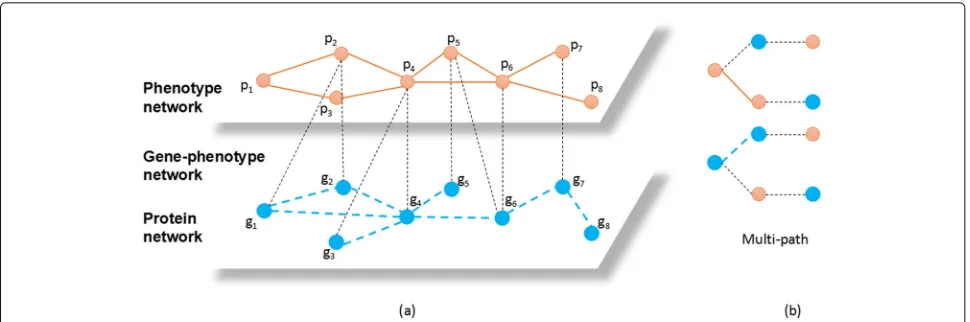
Figure2a is an example ofGP−network. Between genes and phenotypes, there are many associations. Our pur-pose is to predict the unknown associations between cer-tain genes and phenotypes according to the known links in theGP−network.
HeterogeneousGP−network embedding
Dong et al. proposed Metapath2vec, which is a net-work embedding method for netnet-work analysis [35]. In this method, scholars designed meta-path (i.e., a path including different kinds of vertices) to guide random walk [36]. Metapath2vec generates paths through ran-dom walks based on meta-path, which can capture rich correlations between different types of vertices. In this paper, we design a novel multi-path to capture richer correlations between vertices. The formal definitions of meta-path and multi-path are respectively introduced as follows.
Definition 1In the regular heterogeneous network, a meta-path scheme H is defined as a path that is denoted
in the form of V1
R1
−→ V2
R2
−→ . . . Rl−1
−→ Vl, wherein,
R = R1R2. . .Rl−1defines the composite relations
between vertex types V1and Vl.
A meta-path "g − p − g" represents the common pathogenic genes relationship of a phenotype(p) between
Fig. 2 ais an example ofGP−network. Each light orange node represents a phenotype and each blue node represents a protein. The links between phenotypes represent the high similarities. The links between proteins represent the interactions proteins. The black dots represent the associations between genes and phenotypes.bis the multi-path used in this work,which is “g-p-g&g-g-p” and “p-g-p&p-p-g”
two genes(g). But, the relationship captured by a meta-path is not enough for the heterogeneous network we constructed. For example, if a gene g1 is the uncovered
pathogenic gene of a phenotype p1, the reasons may be the
following two situations: (1) Gene g1may interact with g2,
which g2has been confirmed to be the pathogenic gene of
known phenotype p1. (2) Gene g1may closely associate with
p2which is highly similar to p1. Therefore, a meta-path is
not suitable for the heterogeneous network we constructed because it can only capture one relationship. Considering this particularity, we propose multi-path based random walk to capture gene-phenotype relationships (g−p) and gene-gene relationships (g −g). We define multi-path as follows.
Definition 2 In GP−network, a multi-path scheme W is defined as a path that is denoted in the form of
V1
R1
−→ V2
R2
−→ . . . Rl−1
−→ Vl. Wherein, R = R1R2
. . .Rl−1defines the composite relations between vertices.
Besides, Vi+2∈/P when Vi∈P∧Vi+1∈P. Likewise, Vi+2∈/G
when Vi∈G∧Vi+1∈G.
That is, there cannot be three successive vertexes that are all of the same type in a multi-path. Multi-path is more suitable for heterogeneous networks than meta-paths because it can capture multiple relationships simultane-ously. Take the situation in Fig.2a as an example, g2 →
p2 → g1is meta-path. Different from meta-path,
multi-path is allowed to contain two relationships simultane-ously. For instance, g2 → p2 → g1and g2 → g4 → p4
are multi-paths. Fig.2b shows the multi-path used in this work.
Here, we describe how multi-path guides random walk-ers to walk in the heterogeneous network we build. To a
multi-path scheme W : V1
R1
−→ V2
R2
−→ . . . Rl−1
−→ Vl, the transition probability at step i is defined as shown in Eq.1.
Pr(vi+1|vi
t,W)=
⎧ ⎪ ⎨ ⎪ ⎩
1 Nt+1(vi
t)
vi+1,vi t
∈E,φ(vi+1)=t+1
0 vi+1,vi t
∈E,φ(vi+1)=t+1
0 vi+1,vi t
/ ∈E
(1)
Whereinvit ∈ Vt andNt+1(vit) denotes the neighbor-hood ofvitas well as being the(t+1)thtype of vertices, φ(vi+1) represent the type of vertex vi+1. That is, the walker will walk through the pre-defined multi-path W. The strategy of the multi-path based random walk ensures the four kinds of relationships can be the input of het-erogeneous skip-gram model. One of the advantages of multi-path random walk is that it can capture richer structural correlations.
Given W={v1. . .vl} with lengthl, a multi-path guided random walk, the vertex embedding function is denoted by (·). (·) is learned by maximizing the probability, which is the occurrence that the neighborhood vertices ofviare withinkwindow size conditioned on(vi). The objective function is shown in Eq.2.
min
−logPr({vi−k,. . .,vi+k}\vi|(vi)) (2)
Pr({vi−k,. . .,vi+k}\vi|(vi))= i+k
j=i−k,j=i
Pr(vj|(vi))
(3)
Heterogeneous skip-gram is used to learn effective vertex representations for a heterogeneous network by max-imizing the probability of Pr(vj|(vi)), it assumes the probability of Pr(vj|(vi)) is related to the type of vertexvj
Pr(vj|(vi))=
e(vj)·(vi)
u∈Ve(u)·(vi)
,vj∈Nt(v) (4)
wherein,Nt(v)denotes the neighborhood ofvas well as being thetthtype of vertices.
We also used negative sampling to approximate the objective function for efficient optimization.
Oij= −logPr(vj|(vi))=logσ((vj)·(vi))+ M
m=1
logσ(−(vjm)·(vi)) (5)
whereinσ(·)is the sigmoid function, andvjm is themth negative node sampled for nodevjandMis the number of negative samples. Parametersand are updated as follows:
=−α∂Oij
∂,=−α ∂Oij
∂ (6)
Score and rank
After getting the vector representation of each pheno-type and protein in the human gene-phenopheno-type hetero-geneous network, we then calculate the similarity of every gene with the given phenotype. Given a geneg = (x1,x2,. . .,xd) and a phenotype p = (y1,y2,. . .,yd), we measure the similarity between two vectors using the cosine similarity between the normalized vec-tors. The calculation formula of similarity is shown in Eq.7.
sim(g,p)=
d n=1
xn∗yn
d n=1
x2
n∗
d n=1
y2
n
(7)
After calculating the similarity of every protein in the human gene-phenotype heterogeneous network with the target phenotype, the similarity scores can be ranked in order. Candidate genes are then prioritized. Algorithm 1 shows the whole process of Multipath2vec.
Algorithm 1Multipath2vec
Require: GP−networkG(V,E), walk per vertex t, walk length l, embedding size d, g-p associations Sgp, a multi-path schemeW, window sizek;
Ensure: :candidate gene rank
1: Initialize vertex embeddingsX∈R|V|×d
2: foreachsgp∈Sgpdo 3: G =G−sgp 4: fori=0→tdo
5: foreachvi∈V do
6: X
=Heterogeneous-network-embedding(G,W,vi,l,X,R,k) 7: Sim=Cossim(X) 8: Rank(Sim) 9: end for 10: end for 11: end for 12:
13:
Heterogeneous-network-embedding(G,W,vi,l,X,R,k) 14: R[ 0]=vi
15: fori=0→l−1 do
16: drawuaccording to Eq.1 17: R[i+1]=u
18: end for
19: fori=0→l−1 do
20: v =R[i]
21: forj=max(0,i−k)→min(i+k,l)&j=ido 22: ct=R[j]
23: updateXaccording to Eq.6 24: end for
25: end for 26: returnX 27:
28: Cossim(X)
29: foreachxg∈Xdo
30: Sim=sim(xg,xp)(according to Eq.7) 31: end for
32: returnSim
Results
In this section, we introduce the details about experimen-tal data set, experiment settings, evaluation metrics, base-line approaches and the analysis of experimental results.
Data sets
We access data sets from three different sources to gener-ate theGP−network. The details of these three data sets are described as below.
integrate information about human proteome. The information in HPRD has been extracted by biologists manually. The data set we access from HPRD includes 39,240 interactions among 9,590 human proteins/genes. We filter out the proteins with self-interactions only. After filtering, a total of 8,756 human proteins were used in our experiments.
• Gene-phenotype associations:We achieve data of gene-phenotype associations from Online Mendelian Inheritance in Man (OMIM) database. OMIM is an online catalog of human genes and genetic disorders, which focuses on heritable genetic diseases. The data in OMIM includes text information, related reference information, sequence records, maps, and other related databases. In the experiment, we extracted 925 gene-phenotype associations with 667 pathogenic genes and 775 disease phenotypes.
• Phenotype similarities:We get the phenotype similarities data from pre-existing research results published in 2006. Van et al.. studied OMIM data base and calculated the similarities [37]. Their research results are uploaded to the website http://www.cmbi.ru.nl/MimMiner/. We use the 5080*5080 phenotype similarity matrix which is calculated by cosine similarity between every two phenotypes.
Experiment settings
Before generating the GP−network, we preprocess the data and set some details in our experiment as follows.
1 Proteins with self-interactions only in the PPI data set are filtered out.
2 In the gene network, we filtered those proteins that are not in gene-phenotype network and also have no links to proteins in the gene-phenotype network. And in the phenotype network, we filtered those phenotypes that are not in gene-phenotype network and also have no links to phenotypes in the
gene-phenotype network. In the gene-phenotype network, we filtered those gene-phenotype
associations which gene not in the gene network and phenotype not in the phenotype network.
3 In the phenotype network, we connected two phenotypes when their similarity scores are higher than 0.6, which is considered to be reliable according to previous studies [37].
Evaluation metrics
We used leave-one-out cross validation to verify results in our experiments. Cross validation is also called loop esti-mation sometimes and is usually used in statistics. It is widely used in the verification of prediction issues. Cross validation can be used to test whether a prediction model is accurate in practical.
Leave-one-out cross validation
The first process of cross validation is to separate the original data into two groups, i.e., training set and testing set. Then we use the training set to train the classifier. Finally, we use the testing set to eval-uate the classifying quality of classifier. One of the most common used method is leave-one-out cross validation.
In leave-one-out cross validation, leave one sample as testing set and the other samples as training set. We use leave-one-out cross validation in this work since it is suitable for small samples.
Precision
Precision is widely used to evaluate the accuracy of pre-diction. There are four situations in the binary detection, i.e., True Positive (TP), True Negative (TN), False Posi-tive (FP), and False Negative (FN). Take Fig.2as example, suppose there exist association between geneg10and
phe-notypep8. Ifg10−p8is successfully predicted, then this
situation is counted as aTP. Since the failed prediction is meaningless in this issue, we calculate precision to evalu-ate the successful prediction revalu-ate. The calculation formula is shown in Eq.8.
Precision= TP
TP+FP (8)
Baseline approaches
We use four methods as baseline approaches, i.e., CAT-APULT, PRINCE, Deepwalk and Metapath2vec. We describe the four baseline approaches in detail as below.
1 CATAPULT:CATAPULT [38] uses a biased SVM framework and train a bagging support vector machine classifier to classify the gene-phenotype pairs. In CATAPULT, the similarities between vertices can be evaluated by the length of different paths. CATAPULT then uses supervised algorithms to learn the coefficients of different paths.
Specifically, the features of gene-phenotype pairs are represented by the number of paths with different lengths in network shown as follows.
C=
NGG NGP
NPG NPP
(9)
wherein,NGGis the gene network,NGPis the
gene-phenotype network,NPGis the transposed
form ofNGP, andNPPis the phenotype network. By
relationships between vertices do not exist indeed, CATAPULT assumes that the unconnected links are unlabeled and then randomly select some unlabeled relationships as negative association. Therefore, the sample of each SVM classifier are consist of all positive relationships and randomly selected unlabeled relationships. Then we can get a linear classifierθt. The final results are calculated according
to the average value of multiple training models. 2 PRINCE:PRINCE is one of the classical algorithms
for dealing with this issue. The correlation between the geneg and disease d is decided by two factors. One is the correlation between neighbor genes ofg and the target diseased. The other one is the priori knowledge of geneg. The optimal function of the correlation between theg and diseaseF(g)is shown as follows.
F(g)=α[ q∈N(p)
wF(p,q)]+(1−α)Y(p) (10)
Wherein,w is normalized form of the weight matrix of the network andαis the parameter using to adjust the weight of the two factors.
3 Deepwalk:Deepwalk is a network embedding method which is usually used in homogeneous network. Deepwalk learns low-dimensional feature representations by using uniform random walks. It generate random walks by treating nodes of different types equally.
4 Metapath2vec:Metapath2vec is proposed for heterogeneous networks. Metapath2vec presented meta-path to guide random walk. Metapath2vec generates paths through random walks based on meta-path, which can capture rich correlations between different types of vertices.
Experimental results analysis
We use leave-one-out cross validation to evaluate the performance of our method Multipath2vec and four base-line methods in the experiment. We set the experimental parameters as follows.
1 The number of walks per vertext: 500; 2 The walk lengthl : 100;
3 The vector dimensiond : 128; 4 The neighborhood sizek : 7; 5 The size of negative samplesM : 5.
For CATAPULT, PRINCE, Deepwalk and Metap-ath2vec, we follow the original settings in their previous experiments. In Metapath2vec, we used meta-path "g− p−g". The similarities are calculated through these five approaches and then ranked in the descending order. To better compare these five methods, we calculate the accuracy of Top 1 as well as the lists of Top 5, Top 10, Top 30, Top 50, and Top 100.
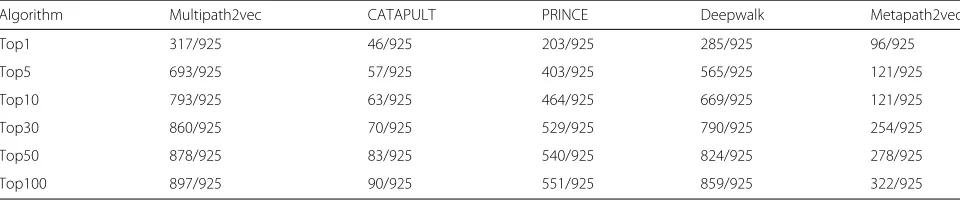
Table 1 shows the overall performance of Multi-path2vec, CATAPULT, PRINCE, Deepwalk and Metap-ath2vec approaches on whole gene-phenotype data. We can see that Multipath2vec successfully predicted 317 pathogenic genes at the Top 1 list, whereas CATAPULT, PRINCE, Deepwalk and Metapath2vec successfully pre-dicted 46, 203, 285 and 96 pathogenic genes respectively. As for the Top 5 list, Multipath2vec achieved higher performance with successfully predicting 693 pathogenic genes. Deepwalk predicted 565. Metapath2vec predicted 121. PRINCE predicted 403 and CATAPULT only pre-dicted 57.
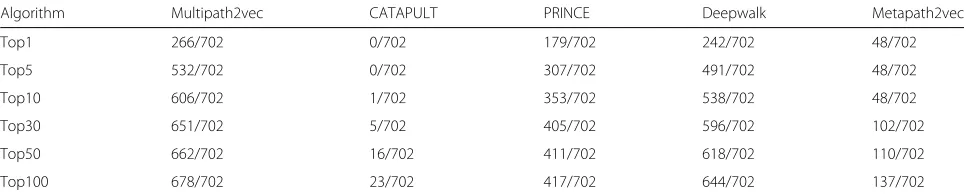
As for the single-gene gene-phenotype data, the experi-mental results are shown in Table2. We can see that Mul-tipath2vec outperforms the other two algorithms. CAT-APULT performed worst on single-gene gene-phenotype data. The reason may be that CATAPULT trains a bag-ging classifier by learning the weights of different paths ,but there is only one connected path between target gene and phenotype in single gene data. So we focus on the comparison of Multipath2vec, PRINCE, Deepwalk and Metapath2vec. Multipath2vec successfully predicted 266 pathogenic genes at the Top 1 list, while PRINCE, Deepwalk and Metapath2vec predicted 179, 242 and 48 respectively.
Moreover, we list the overall performance of these five methods on many-genes gene-phenotype data in Table3. As shown in the Table3, Multipath2vec still outperforms.
Table 1The overall performance of Multipath2vec, CATAPULT, PRINCE, Deepwalk and Metapath2vec methods on whole gene-phenotype data
Algorithm Multipath2vec CATAPULT PRINCE Deepwalk Metapath2vec
Top1 317/925 46/925 203/925 285/925 96/925
Top5 693/925 57/925 403/925 565/925 121/925
Top10 793/925 63/925 464/925 669/925 121/925
Top30 860/925 70/925 529/925 790/925 254/925
Top50 878/925 83/925 540/925 824/925 278/925
Table 2The overall performance of Multipath2vec, CATAPULT, PRINCE, Deepwalk and Metapath2vec methods on single-gene gene-phenotype data
Algorithm Multipath2vec CATAPULT PRINCE Deepwalk Metapath2vec
Top1 266/702 0/702 179/702 242/702 48/702
Top5 532/702 0/702 307/702 491/702 48/702
Top10 606/702 1/702 353/702 538/702 48/702
Top30 651/702 5/702 405/702 596/702 102/702
Top50 662/702 16/702 411/702 618/702 110/702
Top100 678/702 23/702 417/702 644/702 137/702
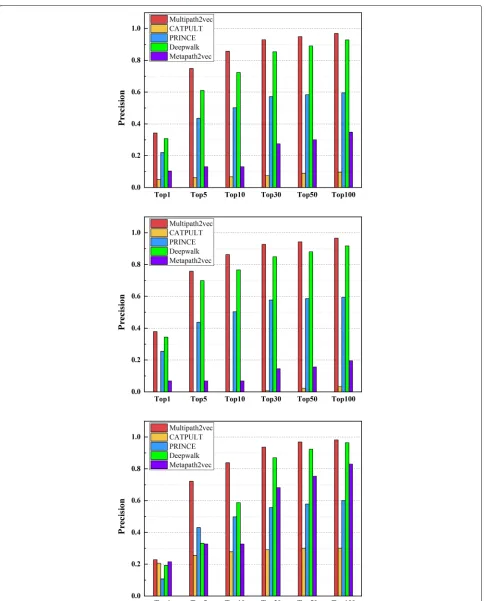
We also calculate the precision values of these five methods, which are shown in Figs.3and4, respectively. Figure3 shows the precision values of the five methods under the 6 different groups on single-genes, many-genes and whole-genes gene-phenotype data, respectively. We choose 6 groups of different sizes as mentioned above, i.e., Top 1, Top 5, Top 10, Top 30, Top 50, and Top 100. It can be obviously seen from Fig.3that the precision val-ues of Multipath2vec outperform CATAPULT, PRINCE, Deepwalk and Metapath2vec.
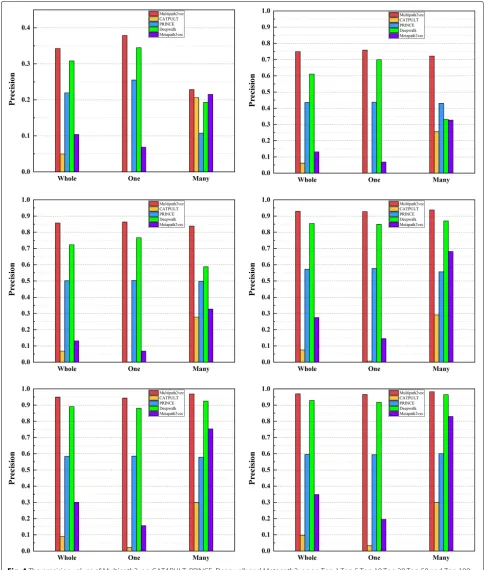
Figure4 shows the precision values of Multipath2vec, CATAPULT, PRINCE, Deepwalk and Metapath2vec, grouping by single-genes, many-genes and whole-genes gene-phenotype data, respectively. In general, Multi-path2vec outperforms the other four approaches. The performance of Multipath2vec and Deepwalk are ahead of the other baseline approaches. Deepwalk performs closely with Multipath2vec but still cannot catch up with Multi-path2vec. Wherein, CATAPULT performs worst so that it cannot compare with Multipath2vec, PRINCE, Deepwalk and Metapath2vec.
In summary, Multipath2vec can successfully predict pathogenic genes with high accuracy. The experimental results shows that Multipath2vec outperformed baseline approaches in all perspectives. Therefore, Multipath2vec is able to be used in predicting pathogenic genes.
Discussion
Robustness of false negative
In our experiment, we used precision to evaluate the accu-racy of prediction. In each round of leave-one-out cross validation, if the cut link between the target gene and
phenotype is successfully predicted, then this situation is counted as aTP. And we can also regard this situation as aTN because the negative is successfully predicted as a negative. So the number ofTPis equal to the number of TN and the number ofFPis equal to the number ofFN. Our method perform well in the accuracy of prediction, so it is also robust to false negative.
Conclusion
The study of pathogenic genes plays an important role in revealing the pathogenesis of diseases as well as devel-oping corresponding disease prevention and diagnosis methods. The key to deciphering the molecular and genetic basis of human disease is to analyze the cor-relation between diseases and genes. In this paper, we propose the Multipath2vec algorithm which is based on network embedding to predict pathogenic genes. The multi-path in Multipath2vec are designed to guide random walk in the human gene-phenotype heteroge-neous network. The multi-path based random walk can better represent the network. The experimental results show that Multipath2vec outperforms four baseline meth-ods from several perspectives. By implementing these three approaches on single-gene gene-phenotype data, many-genes phenotype data and whole-genes gene-phenotype data, Multipath2vec showed the outstanding performance in prediction of pathogenic genes. By calcu-lating the precision values of these five methods, Multi-path2vec still outperforms under all circumstances. This fact illustrates the possibility of applying heterogeneous network embedding approach in prediction of pathogenic genes.
Table 3The overall performance of Multipath2vec, CATAPULT, PRINCE, Deepwalk and Metapath2vec methods on many-genes gene-phenotype data
Algorithm Multipath2vec CATAPULT PRINCE Deepwalk Metapath2vec
Top1 51/223 46/223 24/223 43/223 48/223
Top5 161/223 57/223 96/223 74/223 73/223
Top10 187/223 62/223 111/223 131/223 73/223
Top30 209/223 65/223 124/223 194/223 152/223
Top50 216/223 67/223 129/223 206/223 168/223
Abbreviations
GP−network: The gene-phenotype network; FN: False negative; FP: False positive; HPRD: The human protein reference database; OMIM: Online mendelian inheritance in man; PPI: Protein-protein interaction; TN: True negative; TP: True positive
Acknowledgements
The authors thank Zengyou He for his suggestions.
About this supplement
This article has been published as part ofBMC Medical Genomics Volume 12 Supplement 10, 2019: Selected articles from the IEEE BIBM International Conference on Bioinformatics & Biomedicine (BIBM) 2018: medical genomics. The full contents of the supplement are available online athttps://bmcmedgenomics. biomedcentral.com/articles/supplements/volume-12-supplement-10.
Authors’ contributions
BX conceived of the study, participated in its design, and drafted the manuscript. YL and LW carried out all experiments. YL and SY drafted the manuscript. JD, HL, ZY, JW and FX reviewed manuscript. HL conceived of the study, participated in its design and coordination, and helped draft the manuscript. All authors read and approved the final manuscript.
Funding
This publication cost of this article was funded by the Natural Science Foundation of China under Grant 61502071 and Grant 61572094 and in part by the Fundamental Research Funds for the Central Universities under Grant DUT18RC(3)004.
Availability of data and materials
The vectors trained during the current study are available from the corresponding author on reasonable request.
Ethics approval and consent to participate Not applicable.
Consent for publication Not applicable.
Competing interests
The authors declare that they have no competing interests.
Author details
1School of Software, Dalian University of Technology, 116000 Dalian, China. 2Key Laboratory for Ubiquitous Network and Service Software of Liaoning,
116000 Dalian, China.3School of Computer Science and Technology, Dalian
University of Technology, 116000 Dalian, China.
Published: 23 December 2019
References
1. Glazier AM, Nadeau JH, Aitman TJ. Finding genes that underlie complex traits. Science. 2002;298(5602):2345–9.
2. Khan GM. Evolution of Artificial Neural Development - In Search of Learning Genes. Studies in Computational Intelligence, vol. 725. Gewerbestrasse 11,6330 Cham: Springer. https://doi.org/10.1007/978-3-319-67466-7.
3. Lander ES, Linton LM, Birren B, Nusbaum C, Zody MC, Baldwin J, Devon K, Dewar K, Doyle M, Fitzhugh W. Initial sequencing and analysis of the human genome. Nature. 2001;3(6822):346.
4. Krauthammer M, Kaufmann CA, Gilliam TC, Rzhetsky A. Molecular triangulation: Bridging linkage and molecular-network information for identifying candidate genes in alzheimer’s disease. Proc Natl Acad Sci USA. 2004;101(42):15148–53.
5. Frayling TM, Timpson NJ, Weedon MN, Zeggini E, Freathy RM, Lindgren CM, Perry JR, Elliott KS, Lango H, Rayner NW. A common variant in the fto gene is associated with body mass index and predisposes to childhood and adult obesity. Science. 2007;316(5826):889–94.
6. Sun PG, Gao L, Han S. Prediction of human disease-related gene clusters by clustering analysis. Int J Biol Sci. 2011;7(1):61–73.
7. Godard P, Page M. PCAN: phenotype consensus analysis to support disease-gene association. BMC Bioinformatics. 2016;17:518–15189. 8. deAndrés-Galiana EJ, Martínez JLF, Sonis ST. Sensitivity analysis of gene
ranking methods in phenotype prediction. J Biomed Inform. 2016;64: 255–64.
9. Navlakha S, Kingsford C. The power of protein interaction networks for associating genes with diseases. Bioinformatics. 2010;26(8):1057–63. 10. Lage K, Karlberg EO, Storling ZM, Olason PI, Pedersen AG, Rigina O,
Hinsby AM, Tumer Z, Pociot F, Tommerup N, et al. A human phenome-interactome network of protein complexes implicated in genetic disorders. Nat Biotechnol. 2007;25(3):309–16.
11. Albers DJ, Perotte AJ, Hripcsak G. Approaches for using temporal and other filters for next generation phenotype discovery. In: AMIA 2016, American Medical Informatics Association Annual Symposium, AMIA 2016, Chicago, IL, USA, November 12-16, 2016 (2016).
12. Xing W, Qi J, Yuan X, Li L, Zhang X, Fu Y, Xiong S, Hu L, Peng J. A gene-phenotype relationship extraction pipeline from the biomedical literature using a representation learning approach. Bioinformatics. 2018;34(13):386–94.
13. Xu J, Li Y. Discovering disease-genes by topological features in human protein–protein interaction network. Bioinformatics. 2006;22(22):2800–5. 14. Vanunu O, Magger O, Ruppin E, Shlomi T, Sharan R. Associating genes
and protein complexes with disease via network propagation. PLOS Comput Biol. 2010;6(1):.https://doi.org/10.1371/journal.pcbi.1000641. 15. Wu X, Jiang R, Zhang MQ, Li S. Network-based global inference of
human disease genes. Mol Syst Biol. 2008;4(1):189.
16. Oti MO, Brunner HG. The modular nature of genetic diseases. Clin Genet. 2006;71(1):1–11.
17. Ideker T, Sharan R. Protein networks in disease. Genome Res. 2008;18(4): 644–52.
18. Jang H, Lee H. Identification of cancer driver genes in focal genomic aberrations from whole-exome sequencing data. Bioinformatics. 2018;34(3):519–21.
19. Kang T, Ding W, Zhang L, Ziemek D, Zarringhalam K. A biological network-based regularized artificial neural network model for robust phenotype prediction from gene expression data. BMC Bioinformatics. 2017;18(1):565–156511.
20. Whigham PA, Dick G, MacLaurin J. On the mapping of genotype to phenotype in evolutionary algorithms. Genet Program Evolvable Mach. 2017;18(3):353–61.
21. Sandor C, Beer NL, Webber C. Diverse type 2 diabetes genetic risk factors functionally converge in a phenotype-focused gene network. PLoS Comput Biol. 2017;13(10):.https://doi.org/10.1371/journal.pcbi.1005816. 22. Torshizi AD, Petzold LR. Graph-based semi-supervised learning with
genomic data integration using condition-responsive genes applied to phenotype classification. JAMIA. 2018;25(1):99–108.
23. Choi S. Extraction of protein-protein interactions (ppis) from the literature by deep convolutional neural networks with various feature embeddings. J Inf Sci. 2018;44(1):60–73.
24. Li Y, Patra JC. Genome-wide inferring gene-phenotype relationship by walking on the heterogeneous network. Bioinformatics. 2010;26(9):1219–24. 25. Yang P, Li X, Wu M, Kwoh CK, Ng S. Inferring gene-phenotype
associations via global protein complex network propagation. PLoS ONE. 2011;6(7):.https://doi.org/10.1371/journal.pone.0021502.
26. Perozzi B, Al-Rfou R, Skiena S. Deepwalk: online learning of social representations. In: The 20th ACM SIGKDD International Conference on Knowledge Discovery and Data Mining, KDD’14. New York; 2014. p. 701–10. August 24–27.https://doi.org/10.1145/2623330.2623732. 27. Grover A, Leskovec J. node2vec: Scalable feature learning for networks.
In: Proceedings of the 22nd ACM SIGKDD International Conference on Knowledge Discovery and Data Mining. San Francisco; 2016. p. 855–64. August 13–17.https://doi.org/10.1145/2939672.2939754.
28. Tang J, Qu M, Wang M, Zhang M, Yan J, Mei Q. LINE: large-scale information network embedding. In: Proceedings of the 24th International Conference on World Wide Web, WWW 2015. Florence; 2015. p. 1067–77. May 18–22.https://doi.org/10.1145/2736277.2741093. 29. Dai Q, Li Q, Tang J, Wang D. Adversarial network embedding. In:
Proceedings of the Thirty-Second AAAI Conference on Artificial Intelligence, AAAI 2018, New Orleans, Louisiana, USA, February 2-7 (2018). 30. Gao M, Chen L, He X, Zhou A. Bine: Bipartite network embedding. In:
Development in Information Retrieval, SIGIR 2018. Ann Arbor; 2018. p. 715–24.https://doi.org/10.1145/3209978.3209987.
31. Li T, Zhang J, Yu PS, Zhang Y, Yan Y. Deep dynamic network embedding for link prediction. IEEE Access. 2018;6:29219–30. 32. Crichton GKO, Guo Y, Pyysalo S, Korhonen A. Neural networks for link
prediction in realistic biomedical graphs: a multi-dimensional evaluation of graph embedding-based approaches. BMC Bioinformatics. 2018;19(1): 176–117611.
33. Qiu J, Dong Y, Ma H, Li J, Wang K, Tang J. Network embedding as matrix factorization: Unifying deepwalk, line, pte, and node2vec. In: Proceedings of the Eleventh ACM International Conference on Web Search and Data Mining, WSDM 2018. Marina Del Rey; 2018. p. 459–67. February 5–9.https://doi.org/10.1145/3159652.3159706.
34. Li G, Luo J, Xiao Q, Liang C, Ding P, Cao B. Predicting microrna-disease associations using network topological similarity based on deepwalk. IEEE Access. 2017;5:24032–9.
35. Dong Y, Chawla NV, Swami A. metapath2vec: Scalable representation learning for heterogeneous networks. In: Proceedings of the 23rd ACM SIGKDD International Conference on Knowledge Discovery and Data Mining. Halifax; 2017. p. 135–44. August 13–17.https://doi.org/10.1145/ 3097983.3098036.
36. Sun Y, Han J. Mining heterogeneous information networks: Principles and methodologies. Synth Lect Data Min Knowl Discov. 2012;3(2):126. 37. Van Driel MA, Bruggeman J, Vriend G, Brunner HG, Leunissen JAM. A
text-mining analysis of the human phenome. Eur J Hum Genet. 2006;14(5):535–42.
38. Singhblom UM, Natarajan N, Tewari A, Woods JO, Dhillon IS, Marcotte EM. Prediction and validation of gene-disease associations using methods inspired by social network analyses. PLoS ONE. 2013;8(5):.
https://doi.org/10.1371/journal.pone.0058977.
Publisher’s Note