R E V I E W
Open Access
The human microglial HMC3 cell line:
where do we stand? A systematic
literature review
Cinzia Dello Russo
1,2*, Natalia Cappoli
1, Isabella Coletta
3, Daniele Mezzogori
4, Fabiola Paciello
5,
Giacomo Pozzoli
1,2, Pierluigi Navarra
1,2and Alessandra Battaglia
6Abstract
Microglia, unique myeloid cells residing in the brain parenchyma, represent the first line of immune defense within the central nervous system. In addition to their immune functions, microglial cells play an important role in other cerebral processes, including the regulation of synaptic architecture and neurogenesis. Chronic microglial activation is regarded as detrimental, and it is considered a pathogenic mechanism common to several neurological disorders. Microglial activation and function have been extensively studied in rodent experimental models, whereas the characterization of human cells has been limited due to the restricted availability of primary sources of human microglia. To overcome this problem, human immortalized microglial cell lines have been developed. The human microglial clone 3 cell line, HMC3, was established in 1995, through SV40-dependent immortalization of human embryonic microglial cells. It has been recently authenticated by the American Type Culture Collection (ATCC®) and distributed under the name of HMC3 (ATCC®CRL-3304). The HMC3 cells have been used in six research studies, two of which also indicated by ATCC® as reference articles. However, a more accurate literature revision suggests that clone 3 was initially distributed under the name of CHME3. In this regard, several studies have been published, thus contributing to a more extensive characterization of this cell line. Remarkably, the same cell line has been used in different laboratories with other denominations, i.e., CHME-5 cells and C13-NJ cells. In view of the fact that “being now authenticated by ATCC®” may imply a wider distribution of the cells, we aimed at reviewing data obtained with the human microglia cell line clone 3, making the readers aware of this complicated nomenclature. In addition, we also included original data, generated in our laboratory with the HMC3 (ATCC®CRL-3304) cells, providing information on the current state of the culture together with supplementary details on the culturing procedures to obtain and maintain viable cells.
Keywords:Human microglial cell line, HMC3, HMC-3, CHME3, CHME-3, CHME-5, C13-NJ, Molecular phenotype, Molecular signature, Functional properties, IL-6, Chemokines, Free oxygen radicals
Background
Microglial cells are unique myeloid cells residing in the parenchyma of the healthy central nervous system (CNS). These cells arise from erythro-myeloid precur-sors in the yolk sac and enter the brain early during development. Although sharing a common lineage with
monocyte-derived macrophages, microglia retain unique molecular signatures [1, 2] and acquire specific func-tional properties which make them substantially differ-ent from other populations of myeloid cells presdiffer-ent in the brain (i.e., perivascular macrophages, meningeal macrophages, and choroid plexus macrophages) [3]. As the resident immune cells of the brain parenchyma, microglia are constantly monitoring the CNS micro-environment, being able to detect extracellular changes and become rapidly activated in response to different noxious stimuli (effector function). This activity is important in the regulation of brain homeostasis during
* Correspondence:[email protected] 1
Institute of Pharmacology, Università Cattolica del S. Cuore, L.go F Vito 1, 00168 Rome, Italy
2Pharmacology Unit, Fondazione Policlinico Universitario A. Gemelli IRCCS,
Rome, Italy
Full list of author information is available at the end of the article
development and in the adult brain, both in physio-logical conditions as well as pathology [4]. In addition to their immune functions, microglial cells seem to exert an important role in other cerebral processes, including the regulation of synaptic architecture [5–8] and neuro-genesis [9–11], to name a few. Microglia can indeed pro-duce several mediators, among which cytokines (with both pro- and anti-inflammatory activities) and chemo-kines, but also growth factors and neurotrophins. In addition, they can perform phagocytosis and produce re-active oxygen and nitrogen species, including nitric oxide (NO) mainly produced by the upregulation of the inducible form of NO synthase (iNOS, also known as NOS2). Chronic microglial activation seems to be a common pathogenic mechanism underlying several neurological disorders [12,13]; therefore, studies on the regulatory mechanisms of microglial activation are im-portant for a large spectrum of cerebral diseases. Ac-cordingly, numerous experimental models have been established to address the issue.
In vitro, microglial functions have been extensively characterized using rodent cultures of microglial cells, either rat primary cultures derived from brain cortices of 1- to 2-day-old newborn animals [14] or immortalized murine cell lines [15]. However, rodent microglia display important biochemical and pharmacological differences compared to human microglia [16]. On the other hand, microglia research using human cells has been limited due to the restricted availability of primary sources of human microglia, including aborted fetal tissue, biopsies from epileptic patients, normal tissue from brain tumor excisions, or postmortem brain tissue. In this respect, human microglial cell lines allow to overcome this prob-lem and can be considered a valuable experimental model. Several cell lines have been generated in different laboratories [17,18], including more recent lines derived from adult brain tissue [19]. All these cell lines were developed through SV40 immortalization of human primary microglial cells, whereas a fraction of SV40-im-mortalized adult microglial cells were further engineered to express the human telomerase reverse transcriptase (hTERT) and reduce the proliferation rate [19]. To the best of our knowledge, two cell lines are commercially available, the human microglial clone 3 cell line, HMC3 [17,20–22] and the “Immortalized Human Microglia - SV40”, devel-oped and distributed by Applied Biological Materials (Van-couver, Canada) [23–28]. The HMC3 has been recently authenticated by the American Type Culture Collection (ATCC®), a leading nonprofit organization in the authenti-cation and distribution of biologic material, microorgan-isms, and standards. The cell line is distributed by ATCC® under the catalog designation of HMC3 (ATCC®CRL-3304). Interestingly, a PubMed search (database accessed on June 4, 2018), using (HMC3) OR (HMC-3) as keywords
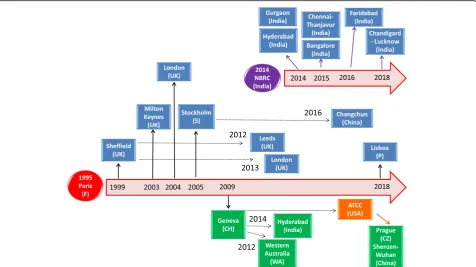
retrieved 24 papers, among which only seven are indeed ar-ticles related to the human microglial HMC3 cell line, i.e., six original studies [20, 21, 29–32] and one review article [22]. Two of these original papers are also included in the reference list reported in the HMC3 (ATCC®CRL-3304) cell line’s data sheet [20, 21]. However, a more accurate litera-ture revision would suggest that clone 3 circulated among different laboratories also under the name of CHME3 microglial cells. In fact, a PubMed search including (CHME3) OR (CHME-3) as keywords allowed us to iden-tify 21 additional articles, published between 1999 and 2018. All these studies employed the CHME3 cell line, thus contributing to a more extensive characterization of the hu-man microglial clone 3. In Fig.1, it is reported a historical reconstruction of the distribution process of this cell line across different laboratories, based on published articles. Remarkably, the same cell line has been used in several la-boratories with other denominations, i.e., C13-NJ cells and CHME-5 cells. Since“being now authenticated by ATCC®” may imply a wider distribution of the cells, we aimed at reviewing data obtained with the human microglia cell line clone 3, making the readers aware of this complicated de-nomination. In addition, we also included original data,
generated in our laboratory with the HMC3
(ATCC®CRL-3304) cell line, providing information on the current state of the culture together with additional details on the culturing procedures to obtain and maintain viable cells. We believe that a systematic revision of this literature can be regarded as an important starting point for re-searchers planning to use this cell line in their experimental paradigms.
The human microglial HMC3 cell line
83.3 ± 2.9 (± SD) % were detected as CD68 Ki-M7-positive cells, whereas only 33.5 ± 12% were CD68 EBM/11 posi-tive and 18 ± 2.8% CD68 Ki-M6 posiposi-tive. In addition, pri-mary human microglial cells tended to lose the positivity for CD68 Ki-M6 and EBM/11 during in vitro culturing. Similarly, the expression of CD14 (34 ± 12% of positive cells at in vitro day 1) disappeared after 10 days in culture (< 1% positive cells). Microglial cells were virtually nega-tive for class II major histocompatibility complex (MHCII, 4 ± 4% of positive cells at in vitro day 1, < 1% after 10 days in culture) and CD4 antigen expression. Conversely, most of the cells steadily displayed nonspecific esterase activity (NSE, 90% positive cells at day 1vs81 ± 1% at day 10) and were able to phagocytize zymosan particles (97% at day 1
vs81 ± 1% at day 10) [33].
Immortalized microglial cells were generated by trans-fection of the SV40 T antigen in primary human micro-glial cultures, derived from 8- to 10-week old embryos. Several clones of immortalized cells were isolated, albeit clonality could not be totally confirmed due to inability of the cells to grow at very low density [17]. It should
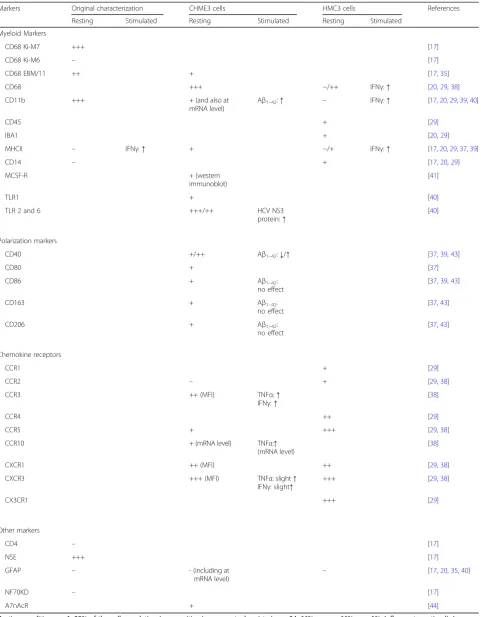
also be pointed out that primary CNS cultures are not necessarily restricted to parenchymal microglia, and other myeloid populations may be present in these cul-tures, possibly contributing to the culture heterogeneity. Immortalized cells acquired rapid growth capacity (with doubling times ranging between 24 and 48 h) and retained most of the phenotypical and morphological properties of the primary microglial cell source, except for a higher percentage of CD68 EBM/11-positive cells and lower phagocytic activity. Antigenic expression was confirmed to be stable for 35 passages in vitro (data not shown). As summarized in Table 1, the human micro-glial clone 3 (HMC3 cells) was originally characterized
as NSE, CD68, and CD11b positive (80–90%), and
Table 1Antigenic profile of the human microglial clone 3 cell line
Markers Original characterization CHME3 cells HMC3 cells References
Resting Stimulated Resting Stimulated Resting Stimulated
Myeloid Markers
CD68 Ki-M7 +++ [17]
CD68 Ki-M6 – [17]
CD68 EBM/11 ++ + [17,35]
CD68 +++ −/++ IFNγ:↑ [20,29,38]
CD11b +++ + (and also at
mRNA level)
Aβ1–42:↑ – IFNγ:↑ [17,20,29,39,40]
CD45 + [29]
IBA1 + [20,29]
MHCII – IFNγ:↑ + −/+ IFNγ:↑ [17,20,29,37,39]
CD14 – + [17,20,29]
MCSF-R + (western
immunoblot)
[41]
TLR1 + [40]
TLR 2 and 6 +++/++ HCV NS3
protein:↑ [40]
Polarization markers
CD40 +/++ Aβ1–42:↓/↑ [37,39,43]
CD80 + [37]
CD86 + Aβ1–42:
no effect
[37,39,43]
CD163 + Aβ1–42:
no effect
[37,43]
CD206 + Aβ1–42:
no effect
[37,43]
Chemokine receptors
CCR1 + [29]
CCR2 – + [29,38]
CCR3 ++ (MFI) TNFα:↑
IFNγ:↑
[38]
CCR4 ++ [29]
CCR5 + +++ [29,38]
CCR10 + (mRNA level) TNFα:↑
(mRNA level)
[38]
CXCR1 ++ (MFI) ++ [29,38]
CXCR3 +++ (MFI) TNFα: slight↑
IFNγ: slight↑
+++ [29,38]
CX3CR1 +++ [29]
Other markers
CD4 – [17]
NSE +++ [17]
GFAP – - (including at
mRNA level)
– [17,20,35,40]
NF70KD – [17]
Α7nAcR + [44]
clones 1, 2, and 4) and closer to what observed in primary cultures (50%) after stimulation with IFNγ. All the immor-talized cells were negative for the specific astrocyte marker, glial fibrillary acidic protein (GFAP), and for the neuronal neurofilament staining (NF70KD) (Table1). At a
functional level, immortalized cells produced and released sizable amounts of interleukin (IL)-6 under basal condi-tions (Table 2). Interestingly, the HMC3 cells secreted higher amounts in comparison to the other clones [17]. Unfortunately, a direct comparison with primary microglial
Table 2Production of cytokines, chemokines, and other inflammatory mediators
Markers Original characterization CHME3 cells HMC3 cells References
Resting Stimulated Resting Stimulated Resting Stimulated
Pro-inflammatory molecules
IL-6 1553 ± 142 IL-1α: > 2500 LPS: 2110 ± 111
20–950/sizable amount
LPS: 2–4 fold↑ IL-1β: 50 fold↑ IFNγ: modest↑ IL-1β+ IFNγ: additional↑ Aβ1–40: 2–12 fold↑ Aβ1–40+ IFNγ: no- additional↑ Aβ1–42: no effect
α-MSH:↑ EPA:↑ HCV NS3:↑
Sizable amount / (mRNA level)
HIV-vector:↑ HIV-U937:↑
[17,20,21,30,36,
37,40,43,47,48]
TNFα ND ND 4–8/ND Aβ1–40: no effect
Aβ1–42: modest↑ HCV NS3:↑
(mRNA level) [17,21,37,40,43,
44,47]
IL-1α ND Aβ1–40: no effect [47]
IL-1β ND Aβ1–40: no effect
HCV NS3:↑
ND /(mRNA level) [21,30,40,47]
Caspase-1 ND Aβ1–40: no effect [47]
IL-12 LPS:↑ [52]
IFNγ LPS:↑ ND [30,52]
iNOS 16% of cells
(positive immunoreactivity)
(mRNA level) [20,36]
ROS Sizable amount HIV TAT-C
protein: modest↑
[20,21]
Antinflammatory molecules
IL-4 ND [30]
IL-10 5,4 Aβ1–42: no effect ND [30,43]
TGFβ1 ~ 8 (mRNA level) [20,37]
TGFβ2 ~ 100 [37]
Chemokines
CCL2 HIV-U937:↑ [30]
CCL5 Sizable amount HIV-vector:↑
HIV-U937:↑ [30]
IL-8 HCV NS3:↑ [40]
CXCL10 HIV-vector:↑
HIV-U937:↑ [30]
Levels of cytokines and chemokines assessed in the incubation media are reported. Data are expressed as pg/ml ± SD secreted in 24-h incubation experiments. ND, not-detectable.↑, increased production. Several inflammatory genes (i.e., iNOS, IL-1β, TNFα, IL-6, MHCII antigens, ARG1, and IL-10) were found to be expressed at the mRNA levels, in the CHME3 cells when co-cultured with differentiated neuronal SH-SY5Y wild type cells for 24, 48, 72 h. These markers were significantly upregulated in presence of the SHswedifferentiated neuronal cells, with major modifications observed for IL-1βand IL-6 gene expression at 72 h [50]. In addition,
cells was not included in the paper, and it is difficult to extrapolate from a previous study [34], in which a bio-logical assay was employed to measure the cytokine’s pro-duction in place of the enzyme-linked immunosorbent assay (ELISA) adopted later. However, in all the immortal-ized microglial clones, including the HMC3 cells, basal production of IL-6 was consistently increased by 24-h treatments with human recombinant IL-1α (10 U/ml, Boeringher-Mannheim) or by lipopolysaccharide (LPS) fromSalmonella typhimurium(Sigma; 10μg/ml) (Table2). Again, a direct comparison with primary microglial cul-tures appears difficult due to substantial differences in the amount of IL-1α/LPS used for the stimulation and the assay employed to assess IL-6 production. However, it seems that the immortalized cell lines were less responsive to LPS in comparison to primary cultures [17, 34]. Similarly to primary cells, all the immortalized microglial cell clones were unable to produce tumor necrosis α (TNFα, data not shown), neither spontaneously nor after pro-inflammatory activation [17]. The production of TNFα was evaluated with a biological assay. Interestingly, lack of TNFαproduction and CD14 expression was considered a specific property of human embryonic microglia.
Cell morphology
A description of the morphology of the immortalized microglial cells was initially reported by Janabi and col-leagues [17]. The authors did not distinguish among different clones, and in general they described the im-mortalized cells as “globular or elongated with thick processes and numerous dark granulation in a large and clear cytoplasm”, page 106. Cells were originally
maintained in Eagle’s minimum essential medium
(EMEM), containing 6 g/l glucose, 10% fetal calf serum (FCS), 2 mM glutamine, and antibiotics. When cultured on fibronectin-coated coverslips, the human microglial CHME3 cells showed mostly a globular morphology, detected by rhodamine-phalloidin staining, with a more intense signal surrounding the nucleus [35]. Interest-ingly, changes in the actin polymerization were induced by short term exposure (60 min) to human chemokines (MCP-1 or RANTES, 20 ng/ml), thus suggesting the ability of human microglia to migrate in response to chemotactic gradients. In contrast to the CHME3 cells, rat microglia displayed a more complex and branched morphology in response to rat chemokines, with an in-tense rhodamine-phalloidin staining in pseudopodia-like structures. However, both human and rodent microglia were able to migrate in response to several human chemokines showing a similar pattern, albeit the CHME3 cells responded to lower concentrations and in shorter times [35]. The CHME3 cells have been
mostly maintained in Dulbecco’s modified MEM
(DMEM), retaining their morphological features (i.e.,
globular cells with dark cytoplasmic vacuoles) [36, 37]. On the other hand, a phase-contrast image of the HMC3 cells, published later by Etemad and colleagues [29], showed the presence of different morphological phenotypes in the same culture, including globular, bipolar, and very elongated cells. Noteworthy, these cells were maintained in a more enriched medium (i.e., DMEM-F12) containing also a higher percentage of FCS (15% FCS).
Antigenic profile
The antigenic profile of the human microglial clone 3 cells, as it emerges from published studies, is outlined in Table 1. In line with the original characterization [17], it was later confirmed that the CHME3 cell line were CD68 EBM/11 positive and GFAP negative [35]. Consistently, the expression of CD68 was detected in resting CHME3 cells using a different primary antibody (DAKO, UK) [38]. In addition, a small percentage (around 5%) of CHME3 cells was found to express the MCHII antigen under basal conditions [37], and resting CHME3 cells were described as MHCII and CD11b positive by flow-cytometry [39]. Expression of CD11b and lack of GFAP was further confirmed at transcrip-tional level [40]. In addition, it was shown that resting CHME3 cells expressed different toll-like receptors (TLRs), including TLR1, TLR2, and TLR 6; and that exposure to the HCV NS3 viral protein significantly increased the expression level of TLR2 and 6 [40]. Expression of the M-CSF receptor was detected in the CHME3 cells, by western immunoblot analysis [41]. Although the concept of microglial polarization has been recently challenged [42], the expression of specific M1- (like CD40 and CD86) and M2- (like CD163 and CD206) polarization markers has been detected in the CHME3 cells [37, 39,43]. The majority of the CHME3 cells (approximately 30–60%) indeed express the CD40 antigen, whereas other markers (i.e., CD86; CD80;
MHCII) were found in approximately 5–20% cells
substantial effects on the expression levels of several M2-polarization markers, including CD163, CD206, CD200R (a deactivating receptor) and CD33 (an endo-cytic marker) [39]. When cultured in presence of neur-onal precursor cells (NPCs), the CHME3 significantly upregulated the expression of MHCII antigens (up to 30%) together with the M2-polarization marker, CD206 [37]. Finally, treatments of CHME3 with conditioned-medium (CM) harvested from different glioma cell lines, i.e., U251, U87, LN229, U373, and A172 cells, re-sulted in the down-regulation of M1-specific (TNFα
and CXCL10) and up-regulation of M2-specific
polarization markers (IL-1 receptor antagonist and CD204) [41]. These authors further show that M-CSF released by glioma cells increased the pro-angiogenetic properties of microglial CHME3 cells with no signifi-cant effects on their polarization [41].
The research group of Prof. Krause (Department of Pathology and Immunology; Faculty of Medicine, University of Geneva), i.e., the depositor of the HMC3 (ATCC®CRL-3304) cell line, further characterized the antigenic profile of the HMC3 cells by immunofluores-cence staining for different myeloid lineage markers and for resting/activated microglial receptors. The au-thors reported that “resting HMC3 cells were strongly positive for the microglia/macrophage marker IBA1 (Fig. 1a), positive for the endotoxin receptor CD14 (Fig. 1b), but negative for the astrocyte marker GFAP (Fig. 1c and d). Markers of activated microglia, namely MHCII (Fig. 1e and f ), CD68 (Fig. 1g and h) and CD11b (Fig. 1i and j), were negative in resting HMC3 cells, but upregulated after activation by IFNγ (10 ng/ml, 24 h)”, page 575 [20]. Of note, the same description is
reported in the data sheet of the HMC3
(ATCC®CRL-3304) cell line. In our opinion, data shown by Li and colleagues in figure 1 of their paper [20] seem to indicate a similar low level of expression of both IBA1 and CD14 in the HMC3 cells under resting
con-ditions. Moreover, in contrast with the original
characterization [17], resting HMC3 cells were found negative for the expression of CD68 and CD11b, albeit these activation markers were induced by IFNγ. Taken together, these data suggest that the HMC3 may have lost some of the original antigenic characteristics [17]. However, it should be noted that the expression level of CD68 in this culture appears to vary in function of the specific primary antibody adopted, as discussed above. Consistently, a basal expression of CD68 was observed in the HMC3 cells (provided by Prof. Krause) by flow cytometric analysis using a specific antibody produced by BD-Pharmingen, CA, USA [29]. In this study, it was also confirmed that resting HMC3 cells express IBA1, and at very low level other myeloid markers, including MHCII (HLA-DR), CD14, and CD45 [29]. The latter is
a transmembrane glycoprotein expressed by cells of hematopoietic origin, except erythrocytes. It has fre-quently been used to distinguish CNS resident micro-glia (CD11b+/CD45low) from peripheral macrophages (CD11b+/CD45high) [45]. However, it has recently been shown that the expression level of CD45 on microglial cells may vary under pathological condi-tions, and novel specific microglial biomarkers have been identified [1,2].
at higher levels, other chemokines receptors, including the CX3CR1 [29]. The latter is currently regarded as a more specific microglial marker [2].
Finally, the expression of classic neurotransmitter re-ceptors has been detected in resting CHME3 cells, with respect to the cholinergic receptor α7nAcR [44]. Inter-estingly, the expression level of this receptor varied in response to different inflammatory stimuli, including an up-regulation with LPS treatments and down-regulation in response to 10–100μg/ml Aβ1–42. On the other hand, the observation of a direct inhibition of cFos expression obtained with dexmedetomidine, a specificα2 adrenergic receptor agonist, would suggest the presence of these re-ceptors on the HMC3 cell membranes [32]. In addition, it has been documented the expression of functional neurotensin receptor 3 in the aliquot of cells named C13-NJ [46]. Accordingly, neurotensin stimulated micro-glial migration and cytoskeleton remodeling, via activa-tion of ERK signaling.
Functional properties
Cytokine and chemokine production
A summary of the inflammatory mediators produced by the cell line is provided in Table 2. In agreement with the original characterization [17], the CHME3 cells were found to release sizable amounts of IL-6 in the incuba-tion medium, with a very low or undetectable secreincuba-tion of other inflammatory molecules, including TNFα, IL-1α, IL-1β, and caspase-1 [47]. Consistently, the pro-portion of resting cells showing a positive immunoreac-tivity for IL-1β and its receptor, IL-1RI, was quantified as 2.9% and 12.5% of the total, respectively [36]. The production of TNFα was later estimated to be in the range of 4–28 pg/ml, 24 h after plating under basal con-ditions [43, 44]. On the other hand, basal IL-6 produc-tion by CHME3 cells was far more abundant and varied between 20 and 950 pg/ml in serum free medium after 24-h incubation [36, 43]. Similar results with respect to IL-6 and TNFα basal production were also reported by Liu J and collaborators [37]. Finally, it was detected
under basal conditions, a marginal secretion of
anti-inflammatory cytokines, including IL-10 (around 5.4 pg/ml) [43], TGFβ1, and TGFβ2 [37].
Interestingly, the CHME3 cells responded to different pro-inflammatory stimuli with significant increases in the production of IL-6. Two- to four-fold increases of basal production were measured in response to the bac-terial endotoxin (LPS), used in the concentration range of 10–5000 ng/ml [48]. Similarly, the Aβ1–40 peptide, another peptide involved in the Alzheimer’s disease pathogenesis [49], induced a two-fold increase of basal IL-6 production at 10 μM and a 10–12-fold increase at 20–60 μM. The effects of Aβ1–40were selective on the IL-6 pathway, and the secretion of other inflammatory
mediators (i.e., TNFα, IL-1α, IL-1β, and caspase-1) was not modified [47]. However, while LPS did not affect cell viability, treatment with Aβ1–40 significantly re-duced CHME3 viability, assessed by the MTT reduction assay [47,48]. Consistently, the CHME3 microglial cells
displayed a pro-inflammatory phenotype when
co-cultured with human neuroblastoma cells SH-SY5Y stably expressing the amyloid beta precursor protein (APP) harboring the APP695 Swedish mutation (SHswe) [50]. Similarly to wild type cells, the SHswecells can be differentiated into neurons by exposure to 10μM retin-oic acid for 7 days. However, the SHswe neurons pro-duce increased amounts of immature APP, soluble APP, and the Aβ1–40 peptide than wild type cells, and this can explain their pro-inflammatory effects when co-cultured with CHME3 cells. Briefly, the CHME3 cells were found to express, at the mRNA levels, sev-eral inflammatory genes (i.e., iNOS, IL-1β, TNFα, IL-6, MHCII antigens, ARG1, and IL-10) when co-cultured with differentiated neuronal SH-SY5Y wild type cells for 24, 48, and 72 h. These markers were significantly upregulated in presence of the SHswe differentiated neuronal cells, with major modifications observed for IL-1β and IL-6 gene expression at 72 h [50]. Interest-ingly, the expression of several microRNAs (miRNAs) implicated in microglial polarization (i.e., miR-155, miR-146a, and miR-124), together with their respective downstream signaling pathway, was modulated in the CHME3 cells co-cultured with SHswe neuronal cells [50]. Conversely, the Aβ1–42 peptide, at concentrations lower than 5 μg/ml, did not exert any stimulatory ef-fect on IL-6 production [36,43], neither modified basal TNFα and IL-10 secretion by the CHME3 cells [43].
Only a modest increase of basal TNFα production
(from 4 pg/ml to 6 pg/ml) was observed in response to higher concentrations (10μg/ml) of the Aβ1–42peptide [44]. With respect to IL-6 production, IL-1βseems to be the most effective inducer, increasing by 50 times the basal release (when used at 50 ng/ml, for 24 h) [36]. On the other hand, IFNγ per se displayed only modest stimulatory effects [36,47]. In contrast to what was observed in rodent models [51], IFNγ did not
modify the response of the CHME3 cells to 10 μM
only at lower concentrations (5–10 nM), an effect that was reversed by cell exposure to Aβ1–42 peptide [43]. Another relevant ω-3 fatty acid, docosahexaenoic acid (DHA), did not show any significant stimulatory effect on IL-6 production [43]. In addition, the CHME3 cells were found to release other cytokines, including IL-12 and IFNγ, in response to LPS [52].
A potent inducer of CHME3 cell activation is the non-structural NS3 protein of the hepatitis virus C
(HCV). The recombinant HCV NS3 (at 2–20 ng/ml)
promoted the upregulation and significantly increased the release of several cytokines, i.e., IL-1β, IL-6, and TNFα, and the chemokine IL-8 [40]. The effects of NS3 protein were mediated by binding to TLRs, as TLR2 and TLR6, followed by activation of downstream NFκB signaling pathway. TLR specific agonists inhibited the pro-inflammatory effect of the HCV NS3 protein by promoting the release of anti-inflammatory IL-10 [40]. Similarly, the mRNA levels of several cytokines, with both pro-inflammatory (IL-1β, IL-6, and TNFα) and anti-inflammatory (IL-4 and IL-10) activities, increased in response to microglial infection with the Japanese en-cephalitis virus (JEV) [53,54], together with a significant up-regulation of type I interferon, IFNβ. Increased levels of IFNβmRNA were mediated by activation of the tran-scription factor IRF3 [55] and subsequent expression of IRF8 [53]. JEV-mediated microglial infection is also char-acterized by the induction of TRIM21, which exerts an inhibitory role on microglial antiviral responses [55]. In addition, a more comprehensive characterization of the dynamic changes occurring in the human microglial microRNAome and transcriptome in response to JEV in-fection can be found in the paper by Kumari and collab-orators [54]. This study further extends previous observations, confirming the immune regulatory role of different microRNAs, i.e., miR-155 [53], miR-146a [56], and miRNA-432 [57]. Consistently, microarray data ana-lysis showed the downregulation of STAT1 gene during JEV infection, which suggests impaired signaling down-stream of cytokine receptors/JAK activation [58]. Thus, a complex interplay between miRNAs, transcription fac-tors and mRNAs occur during JEV infection, contribut-ing to the inhibition of microglial antiviral responses (as for example secretion of type I interferon) and facilitating viral replication in CHME3 cells.
The expression of different inflammatory molecules, including IL-1β, IL-6, TNFα, iNOS, vascular endothelial growth factor (VEGF), and TGFβ1, was documented, al-beit only at the mRNA level, in the HMC3 cells [20,21]. The expression levels of IL-6 were reduced by silencing the isoform 4 of NADPH oxidase (NOX4), thus, suggest-ing that the endogenous production of free oxygen radi-cals is linked to basal expression of IL-6 [20]. The basal mRNA levels of other genes, i.e., iNOS, VEGF, and
basal microglial activation. Latently infected microglial cells displayed marginal expression of HIV, but can be promptly activated in response to different inflammatory stimuli (TNFα, IL-1β, and LPS) [19] On the other hand, CHME3 cells were used to test the translational effi-ciency of highly conserved elements on the HCV viral genome, i.e., the internal ribosome entry site (IRES) [60]. In this study, it was demonstrated that the ability of HCV to replicate in microglial cells, together with the property of IRES sequences to change in order to favor viral latency in the CNS and full replication in the liver. At variance of murine BV2 microglial cells, the CHME3 displayed increased resistance to the cytotoxic effects of 5Z-7-oxozeaenol, an inhibitor of TGFβ-activated kinase 1 [61]. Finally, the CHME3 cells were used to identify molecular factors involved in Zika virus cell entry [62].
Free oxygen and nitrogen species production
Rodent microglial cells have been extensively character-ized for their ability to produce reactive oxygen and ni-trogen species, including NO mainly generated in the μM range by the prompt upregulation of iNOS in re-sponse to different pro-inflammatory stimuli. In con-trast, only a small proportion (around 16% of the total) of CHME3 cells was found to express iNOS 24 h after the plating under basal conditions (Table 2). Moreover, the total fraction of iNOS positive cells did not vary in response to the Aβ1–42 peptide, even though a larger percentage of iNOS+/Aβ1–42+ cells was detected at dif-ferent time points (24-96 h incubations) [36]. These data would therefore suggest that the expression of iNOS in the CHME3 cells is related to their phagocytic capacity [36]. Detection of iNOS mRNA was shown in CHME3 cells co-cultured with differentiated SH-SY5Y neuronal cells [50], as well as in resting HMC3 [20] (as discussed above). However, NO production was not evaluated in these studies, neither in other published articles. Thus, there are no available evidence that the CHME3/HMC3 cells release NO under basal conditions or in response to inflammatory activators. On the other hand, it has been shown that the HMC3 cells spontaneously release sizable amount of free oxygen radicals (ROS) ([20]; Table 2). Noteworthy, cells were maintained according to the original protocol [17], in EMEM supplemented with 10% FCS, and antibiotics, at 37 °C in a 10% CO2 humidified atmosphere. The production of ROS ap-peared to be mediated by NOX4 activity, and it was not significantly modulated by short term (2 h) treatments with IFNγ [20]. Consistently, Jadhav and collaborators have shown a basal production of ROS by the HMC3 cells, with a modest (0.15-fold) increase induced by treatment with the HIV TAT-C protein ([21]; Table 2). Specifically, the viral protein was also able to reduce the expression of miR-17 in the HMC3 cells, an effect that
paralleled with increased expression of the NOX2 and NOX4 enzymes. In fact, the 3′ untranslated regions (UTRs) of both genes contain multiple binding sites for miR-17. Thus, miR-17 overexpression in HMC3 cells significantly reduced the expression of NOX2 and NOX4 proteins, whereas the transfection of anti-miR17 oligonucleotides displayed opposite effects on both en-zyme expression and activity. Similar effects were also observed with respect to the expression of certain pro-inflammatory cytokines, i.e., IL-1β, IL-6, and TNFα [21]. Interestingly, this research group had previously shown the ability of the HIV TAT-C protein to modulate the expression of miR-32 and TRAF3 in human micro-glial cells [63]. However, in this previous study, the au-thors employed the CHME3 cells (no source is listed in the paper), whereas later used the HMC3 cells provided by Prof. Krause [21]. Notably, in both cell lines, the HIV TAT-C protein had similar pro-inflammatory effects, by promoting microglial activation through regulation of micro RNA expression.
Phagocytosis
it has been recently shown that the CHME3 cells can re-duce the extent of extracellular accumulation of sAPPα and Aβ1–40 when co-cultured with differentiated SHswe neuronal cells [50]. However, the ability of microglial cells to clear these neuronal products appeared to be sat-urated after 24 h, with accumulation observed after lon-ger incubations (48–72 h). In co-culture with SHswe neurons, CHME3 microglial cells progressively up-regu-lated senescence markers, an effect that can possibly ex-plain the reduced efficiency in the Aβ clearance [50]. Noteworthy, the CHME3 microglial cells were also able to efficiently internalize exosomes released from differ-entiated neuronal cells. In this regard, exosomes derived from SHswe neurons were characterized for a more electron dense content in comparison to exosomes re-leased by wild type differentiated SH-SY5Y cells, and more importantly for their enrichment in miRNAs in-volved in inflammatory processes. Interestingly, when transferred to microglial cells, neuronal exosomes tended to co-localize with lysosomes. However, reduced lyso-somal co-localization was observed when microglia were treated with SHswe-exosomes in comparison to their wild type counterpart, thus suggesting dysfunctional lysosomal activity in microglial cells. Reduced lysosomal function can affect the rate of protein degradation by microglia, thus favoring Aβ accumulation. In addition, exosomes derived from SHswecells were more toxic than those re-leased by SH wild type cells, and microglial cells appeared to be activated in response to SHswe-exosomes [50]. Finally, it has been shown that the HIV TAT-C protein is efficiently internalized by the CHME3 cells, and can be detected within cell nuclei [63].
Consistently, the HMC3 cells were also found to have phagocytic properties [29]. In this study, the HMC3 cells were exposed to tetramethylrhodamine (TRITC)-labeled
Staphylococcus aures, and phagocytosis was assessed by flow cytometry and confocal microscopy. The HMC3 displayed a significant capacity to uptake the bacterial particles, with two distinct populations indeed detected by flow cytometry. However, the overall phagocytic ac-tivity of HMC3 cells was lower if compared to peripheral dendritic cells [29].
Migratory capacity and secretion of matrix metalloproteases
It is currently known that chemokines play an important role in the regulation of myeloid cell function, particu-larly in the control of cell migration within tissues dur-ing inflammation, but also in development and tissue repair [64]. In particular, chemokines can regulate macrophage/microglia migration to the site of inflamma-tion and in the CNS; they mediate the crosstalk with dif-ferent cell types, for example, between microglia and neurons or astrocytes [65]. Accordingly, the expression
of specific chemokine receptors was observed in both the CHME3 and the HMC3 cells, with a similar pattern [29,38]. Consistently, the CHME3 cell were able to mi-grate in response to different chemokines (i.e., MCP-1, MIP-1α, MIP-1β, RANTES, IL-8, and IP-10) [35], albeit IP-10 seemed to reduce cell viability, measured by MTT assay [38]. Furthermore, matrix metalloproteases (MMPs) are important enzymes that favor the remodel-ing of the extracellular milieu, thus increasremodel-ing immune cell motility and migratory capability [66]. Consistently, it was shown that the CHME3 cells can secrete in the incubation medium sizable amounts of MMP2 under basal conditions [67]. The release of MMP2 could be augmented by treatment with different human chemo-kines, including MCP-1, MIP-1β, RANTES, and frac-talkine (albeit to a lower extent) or in response to IL-1β(1–50 ng/ml). Chemokines were also able to in-crease the release of specific tissue MMP inhibitors,
namely TIMP1 and 2, by the CHME3 cells [67]. A
modest release of MMP9 was detected by zymography (since specific ELISA was unavailable, at that time). In addition, MMP activity (measured by zymography) was further increased by different chemokines, particularly
MCP-1 and IL-8, and by treatment with TNFα (1–
10 ng/ml). This study, however, showed a certain de-gree of variability in the CHME3 responses, with func-tional effects of some chemokines observed in some experiments but not in all [67]. Moreover, the CHME3 cells released increased amounts of MMP-1 and MMP-3 in response to CM, harvested from human peripheral blood monocytes infected with Mycobacter-ium tuberculosis (coMTb), in a concentration and time-dependent manner [68]. The stimulatory effect of coMTb was mediated by activation of p38 MAPK, but possibly involved other kinase signaling pathways, in-cluding ERK and AKT. Interestingly, basal ERK activity was detected in CHME3 cells [68]. In addition, the CHME3 cells express ADAMTS-13, an enzyme be-longing to the ADAMTS family of metalloproteases and mainly synthesized in the liver [69]. The expres-sion level of ADAMTS-13 in the CHME3 cells was lower in comparison to other human brain cell lines, including the neuroblastoma SH-SY5Y cells, the glio-blastoma U373 cells, and the human brain endothelial
cells, hCMEM/D3. Moreover, the levels of
ADAMTS-13 were significantly reduced by treatments with IL-1β in the U373 cell line, whereas a trend to-wards reduction was also observed in the CHME3 cells. Other cytokines, including IL-6 and TNFα, had no inhibitory effects [69].
Other properties
5-LOX. Accordingly, a basal production of pro-resolving inflammatory mediators have been observed, including lipoxin A4 (LXA4, approximately 250 pg/ml) and resolv-ing D1 (RvD1, approximately 200 pg/ml) [44]. In addition, the CHME3 cells have been also characterized for their ability to produce neurotrophic and growth fac-tors. A basal release of brain derived neurotrophic factor (BDNF) was assessed and quantified within the range of 8–300 pg/ml 24 h after plating [36]. Similar results on basal BDNF production were also later shown [37]. Interestingly, the Aβ1–42 peptide (5 μg/ml) significantly reduced the release of BDNF by CHME3 cells, an effect that can potentially exacerbate neuronal damage [36]. However, when tested at lower concentrations, the Aβ1–
42 peptide did not modify the secretion of BDNF [36,
43]. Interestingly, the release of BDNF was augmented by treatment with theω-3 fatty acid EPA, whereas DHA had no significant stimulatory effect [43]. CHME3 cells treated with glioma CM were able to release the VEGF-A together with the insulin-like growth factor binding-protein 1. Both factors were implicated in the pro-angiogenetic effects of microglial cells [41].
The cell line was characterized for the ability to influ-ence the proliferation of other cells, including NPCs,
endothelial cells, and lymphocytes. An important
cross-talk between microglial CHME3 cells and NPCs, derived from 5 to 7.5 weeks old human embryonic CNS tissues, was found using in vitro co-cultures [37]. In this experimental paradigm, microglial CHME3 cells signifi-cantly increased the metabolic activity of NPCs and re-duced cell death. In addition, the CHME3 cells significantly sustained NPC proliferation, inhibiting their differentiation towards the neuronal and astrocyte lineage. This effect was indicated by a lower percentage of PSA-NCAM+ (polysialylated neural cell adhesion molecule) and tubulin III+cells on one hand, and lower counts of positive cells for the glial precursor markers, A2B5 and GFAP, on the other hand. Accordingly, the percentage of nestin positive cells, indicating the pres-ence of undifferentiated NPCs, increased in prespres-ence of microglial CHME3 cells added to NPCs during the dif-ferentiation protocol. It was speculated that the inhibi-tory effect of CHME3 cells on NPC differentiation was mediated by the abundant secretion of IL-6 in the incu-bation medium [37]. Interestingly, when co-cultured with CHME3 cells, NPCs increased the expression of CD200, whereas the microglial cells upregulated the syn-thesis of its specific receptor. On the other hand, NPCs significantly increased the rate of microglial proliferation and the production of TGFβ, with a modest increase of IL-6 and a reduction of BDNF release by CHME3 cells [37]. Despite these data on IL-6 and BDNF, in general, pro-survival and anti-inflammatory effects were ob-served in the interaction between NPCs and microglial
cells in vitro, supporting a possible neuroprotective role of human NPC-based therapies. The medium collected by CHME3 cells exposed to glioma U87 CM increased the ability of tube formation of human umbilical vein endothelial cells, and this pro-angiogenetic effect was more evident in comparison to the supernatant of rest-ing CHME3, i.e., not exposed to glioma CM [41]. In addition, a modest, albeit not significant, stimulatory ef-fect on lymphocyte proliferation was observed in vitro using the HMC3 cells [29]. Finally, the electrophysio-logical properties of the human microglial clone 3 cells have been described by Nicholson and Randall [70]. In this research paper the cell line is indicated under the acronym of C13-NJ. Cells showed a mean membrane capacitance of 20.7 ± 0.8 pF, and a mean resting poten-tial −49 ± 4 mV. In addition, the cells exhibited depolarization-induced inward currents, compatible with the expression of Nav 1.5 sodium channel. How-ever, no significant changes in these sodium current properties were observed in response to 12-h treatments with LPS (1 μg/ml) and Aβ1–42 (10 μM). Interestingly, these data are in contrast with evidence obtained using rat microglial cultures, further suggesting the import-ance of human microglial experimental models.
The human microglial CHME-5 cell line
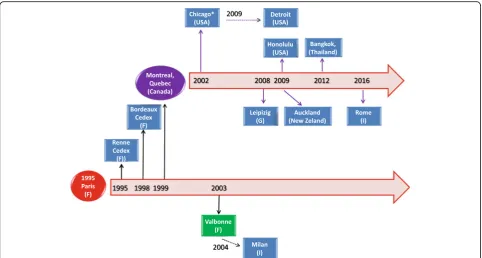
The HMC3 cell line has been widely used under the de-nomination of human microglial CHME-5 cell line. A historical reconstruction of the distribution process of the CHME-5 cell line across different laboratories, based on published articles, is presented in Fig. 2. From this schematic, it appears that the cell line was originally dis-tributed under the name of CHME-5 and used in several publications between the years 1995 and 1999. Later on, the CHME-5 cells have been mainly distributed by the laboratory of Prof. Talbot, University of Quebec, Mon-treal, Canada. Interestingly, the cell line was used in one publication under the name of C13-NJ [46] and distrib-uted under the name of CHME-5 cells [71]. A number of publications have not cited the source of their cell samples whilst others received the cells from academic institutions for which publication records are not avail-able. This may suggest that the cell line was distributed wider than it may be deducted from published articles.
heat shock proteins (Hsc70 and Hsp70), changes in their metabolism, mitochondrial function, and cytoskeleton re-modeling [72, 77]. Accordingly, co-culturing of CHME-5 cells with rat C6 glioma cells promoted the relocation of the heat shock protein Hsp60 to the nucleus together with transient changes in microglial metabolism, including re-duction of oxygen consumption, decreased mitochondrial enzymatic activities and membrane potential, increased lactate release, and reduction of ATP content [73]. In addition, the C6 glioma cells promoted microglial phago-cytic activity and induced cytoskeleton modifications. Functional TREM2 receptors were detected in the
CHME-5 cells [71]. Moreover, the CHME-5 cells
expressed functional receptors for advanced glycation end-products (AGEs), named RAGEs [78]. AGEs in-creased ROS production in CHME-5 cells and reduced cell viability [79]. Consistently, exposure of CHME-5 cells to AGEs triggered microglial activation, as suggested by increased expression of the glucose transporter GLUT-5, induction of MHCII antigens, and increased TNFαrelease [78]. The CHME-5 cells were resistant to low-energy elec-tromagnetic field exposure and did not show any particu-lar changes [80]. In contrast, increased ROS production, increased expression of GLUT-5 and MHCII antigens,
together with a reduction in cell viability were observed in response to high dose ionizing radiations [81].
It was shown that the CHME-5 cells were able to sus-tain the replication of the M-tropic HIV-1 strain Yu-2 with a similar efficiency to human peripheral blood monocytes [82]. In addition, HIV-1 infected CHME-5 cells displayed extended survival and were resistant to cell death induced by LPS in combination with the pro-tein synthesis blocker, cycloheximide. The cytoprotective effect induced by HIV infection was mediated by the HIV TAT protein and subsequent activation of survival signaling depending on the AKT pathway [82]. Since this initial observation, the human microglial CHME-5 cell line has been widely used to study the biology of HIV-1, as documented by more than 15 publications [83–98]. The CHME-5 cells were resistant to murine norovirus MV1 infection [99], whereas they were successfully used
to culture Chlamydia pneumoniae isolated from
interferes with the mitotic fuse [104]. Interestingly, the CHME-5 cells were not able to sustain persistent huCV-OC43 infection, and responded to the acute infec-tion with increased MMP activity and NO producinfec-tion [105]. In contrast to the HMC3/CHME3 aliquots, in-creased iNOS expression and NO production was de-tected also after overexpression of the endogenous retrovirus W envelope protein [88] and in response to a mixture of pro-inflammatory cytokines, including TNFα, IL-1β, and IFNγ [106]. Furthermore, the CHME-5 cells displayed increased arginase (ARG) activity in response to IL-4, which was significantly reduced by several anti-retroviral drugs [106].
In contrast to all the evidence reviewed above, none of the following transcripts was detected in the CHME-5 cells by semi-quantitative RT-PCR using human specific primers: IL-1α and β, IL-6, IL-10, IL-12, TNFα, TGFβ, IFNγ, MIP-1α, and MCP-1 [105]. In addition, it has re-cently been shown by genotyping and amplification of a key human gene CyCT1 that several aliquots of CHME-5 cells (in use in different laboratories) are cross-contaminated by rat glioblastoma cells [19]. This observation further highlights the importance of authen-ticated cell lines as experimental models. This process, which has recently been performed by ATCC® on the HMC3 cells, ensures for the origin of the cell line ex-cluding cross contamination by other species. In addition, it allows researchers to control the genetic drift that can possibly occur with serial passaging of the cells, contributing to cell heterogeneity in cultures [107]. Gen-etic drift may explain the subtle differences observed among different laboratories using the same cell line.
The HMC3 (ATCC®CRL-3304) cell line
The human microglial cell line, HMC3 (ATCC®CRL-3304) (Lot/batch number 70002138), was delivered to our laboratory on June 7, 2017. A certificate of analysis was provided by ATCC® for the specific lot of cells deliv-ered, which certifies the human origin of the cells and the absence of cross contaminating cells from other spe-cies. The latter was confirmed by the cytochrome C oxi-dase I interspecies assay (COI analysis), a PCR based method to detect species specific variants of the COI gene and to rule out inter-species contamination. In addition, the certificate provides a human unique DNA profile, by short tandem repeats analysis, which can be useful to control the cell line for possible phenomena of genetic drift (see above). The HMC3 (ATCC®CRL-3304) cells were immediately placed in liquid nitrogen as sug-gested by the distributor and 4 days later thawed follow-ing the instructions found in the data sheet. Additional information about the culturing conditions was obtained directly by the technical support of ATCC®. Cell culture reagents [Eagle’s Minimum Essential Medium (EMEM,
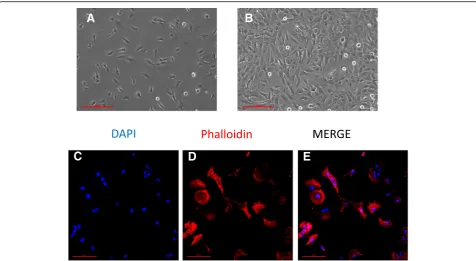
ATCC® 30–2003™) and Fetal Bovine Serum (FBS, ATCC® 30–2020™)] were purchased from ATCC®, and cells were cultured in EMEM supplemented with 10% FBS and an-tibiotics (100 IU/ml of penicillin and 100 μg/ml of streptomycin, Biochrom AG, Berlin, Germany). The en-tire aliquot of frozen cells was plated in one Corning® T75 flask (Catalog #430641) in 15 ml complete growth medium (previously equilibrated for 2 h in the incuba-tor) and incubated in a humidified atmosphere (5% CO2) at 37 °C. This aliquot was numbered using an in-ternal code as passage 1. However, during this first pas-sage in culture, we had to replace the growth medium more frequently than recommended to prevent excessive acidification. The pH of the incubation medium was measured at any medium change. Averaged pH value was 6.88 ± 0.02 (mean ± SEM, n= 13) after 24–48 h of incubation, regardless the number of cells. By avoiding the excessive acidification of the medium, cells remained viable and reached confluency within the times indicated by the ATCC®’s protocol. The technical support of ATCC® confirmed the tendency towards a quick acidifi-cation of the EMEM and more importantly reassured us on the healthy morphology of our cultures (Fig.3). Cells were sub-cultured twice in order to have a homogenous population for the experiments and stored in frozen ali-quots at passage 3 (p3). Mycoplasmas and the related Acholeplasmas (both referred as “mollicutes”) represent a frequent source of cell line contamination. These bac-teria pass through standard 0.22μM filter systems, their growth is not controlled by commonly used antibiotics and is not detectable under contrast phase microscopy. Thus, mollicutes can grow until extremely high titers without producing any turbidity in the supernatants. In addition, mycoplasma contaminations can significantly affect the biology of the cell culture, thus the quality of the experimental results [108]. Before freezing the cells, we excluded possible mycoplasma contaminations using the Venor®GeM Classic Mycoplasma detection kit, thus searching mycoplasma DNA in the incubation medium of almost confluent cultures at p3.
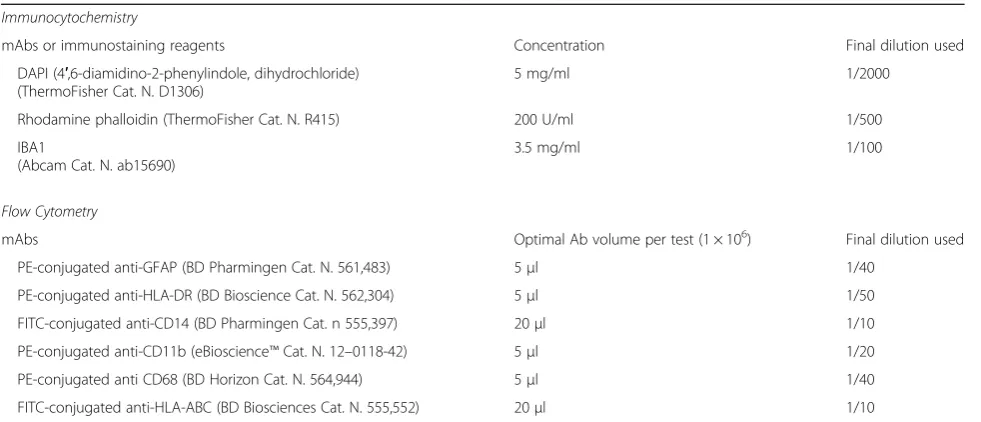
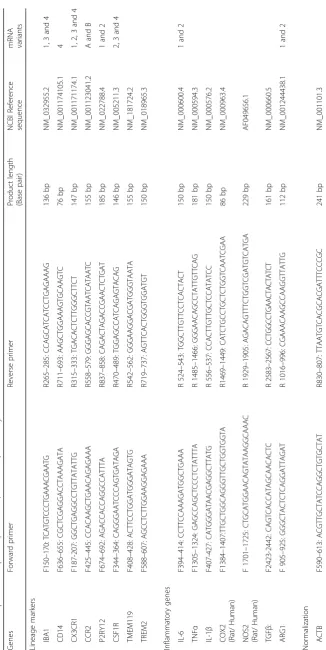
2.4 mg/mlvs 1.5 mg/ml dissolved in the ATCC®EMEM medium. MEM was complemented also with 1 mM so-dium pyruvate and 1X non-essential amino acids (Bio-chrom). When maintained in these media, cells divided more rapidly retaining their morphological features (not shown). For the phenotypical analysis, we plated the cells at 30,000 cells/cm2in T25 flasks and let them grow for 3 days until almost confluent. IFNγ(10 ng/ml), when used, was added in the last 36 h. The expression of spe-cific lineage markers was tested by immunocytochem-istry and flow cytometry. The primary antibodies used for these evaluations are reported in Table 3. The ex-pression of inflammatory genes was analyzed at the mRNA level by reverse transcription followed by real-time (Q)-PCR analysis, performed according to our standard protocol [109]. In brief, total cytoplasmic RNA was prepared from cells using TRIZOL reagent (Invitro-gen) and 1 μg aliquots were converted to cDNA using random hexamer primers and the ImProm-II Reverse Transcriptase kit (Promega). Q-PCRs were performed using the following cycling conditions: 35 cycles of de-naturation at 95 °C for 20 s; annealing at 60 °C for 30 s; and extension at 72 °C for 30 s; the Brilliant SYBR Green QPCR Master Mix 2X (Agilent); and the specific primers reported in Table4. All the primer sets, except the one
used for iNOS and COX2 expression, aligned only hu-man sequences. Q-PCR reactions were carried out in a 20μl reaction volume in a MX3000P real time PCR ma-chine (Stratagene). Relative mRNA concentrations were calculated from the take-off point of reactions (threshold cycle, Ct) using the comparative quantitation method [109]. Ct values forβ-actin (ACTB) expression served as a normalizing signal. ACTB was selected considering that it is a constitutively highly expressed gene in human microglia [2]. Q-PCR efficiency ranged between 94 and 106%. At the end of Q-PCR, the products were sepa-rated by electrophoresis through 2% agarose gels con-taining 0.1 μg/ml ethidium bromide to ensure the product was the correct size. For functional experi-ments, cells were plated at 30,000 cells/cm2in 96 well plates (100 μl/well), let recover overnight and stimu-lated the day after in complete growth medium, i.e., EMEM containing with 10% FBS and antibiotics. IL-6 release was measured with a specific ELISA assay (R&D Systems).
The morphology of a viable culture is shown in Fig.3, i.e., 1 day after plating (Fig. 3a) and when cells reached confluency (day 3 post plating, Fig.3b). In line with Ete-mad and colleagues [29], the HMC3 (ATCC®CRL-3304) cells display a complex morphology, with both globular,
A
B
C
D
E
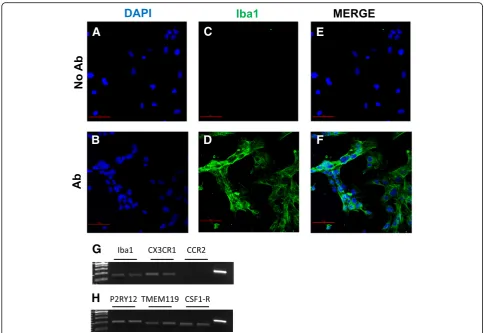
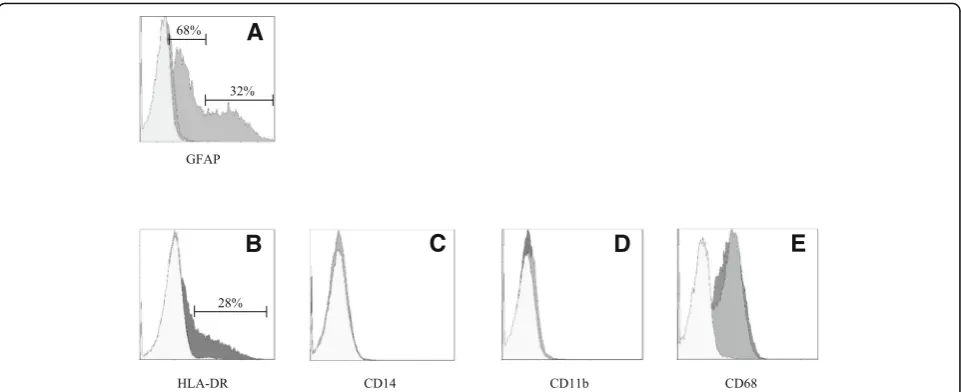
bipolar, and elongated cells detected in culture by rhodamine-phalloidin staining (Fig.3c–e). We confirmed that cells are IBA1 positive (Fig.4d–g). Moreover, we de-tected at the mRNA level the expression of CX3CR1 and CSF1-R (Fig.4g–h), together with other specific markers, comprised in the recently characterized microglial signa-ture [2], i.e., P2RY12 and TMEM119 (Fig.4h). The CCR2 transcript was undetectable (Fig.4g), in line with previous observations [29, 38]. Consistently with the literature and the ATCC®‘s data sheet, the HMC3 cells were GFAP nega-tive (Fig.5a, i.e., the dark gray histogram completely over-laps the background histogram). The glioblastoma U373 cell line, kindly provided by Prof. Grassi (Institute of Physiology, Catholic University Medical School, Rome, Italy), was used as a positive control for the anti-GFAP
antibody (Fig. 3a). The activation marker MHCII
(HLA-DR in the figure) was negative under basal condi-tion and upregulated in the 28% of the HMC3 cell popula-tion by IFNγ treatment (36 h, 10 ng/ml) (Fig. 5b). In addition, resting HMC3 cells were CD14 (Fig. 5c) and CD11b (Fig.5d) negative, and these markers were not in-duced by IFNγ. With respect to CD14 expression, our re-sults are in agreement with the original characterization [17] and the evaluation performed in flow cytometry by
Etemad and colleagues [29]. Finally, the HMC3
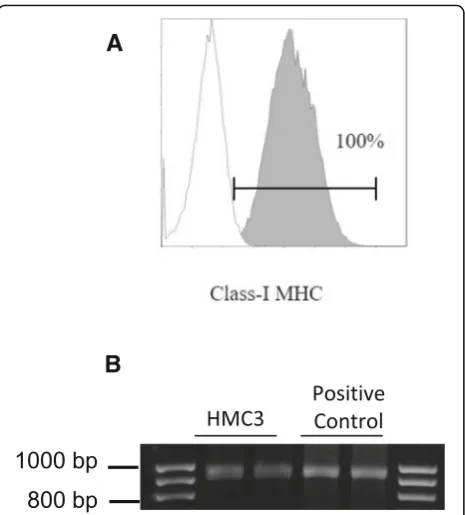
(ATCC®CRL-3304) cells expressed CD68 under basal con-ditions (Fig.5e), in agreement with previous observations [17,29]. However, CD68 was expressed at low level indi-cated by a mean fluorescence intensity (MFI) of 3.3, and no further induction with IFNγwas detected (MFI = 3.6). As shown in Fig. 6a, the HMC3 (ATCC®CRL-3304) cells were found entirely and homogenously positive for human leukocyte antigens A, B, and C (MHCI antigens). The antibody used for this analysis is specific for the human
antigens and does not cross react with rat antigens. In addition, a HLA-B-specific amplification between the first and the third intron was carried out by PCR on genomic DNA samples, extracted by the HMC3 (ATCC®CRL-3304) cells using the QIAamp® DNA Blood mini kit (Qiagen, Hilden, Germany) [110]. The HLA-B locus-specific ampli-fication was performed using the following validated primers: 5BIn1–57 forward primer (forward 5´-GGGA
GGAGCGAGGGGACCG/CCA G-3′; intron 1 36–57)
and 3BIn3–37 reverse primer (reverse 5´-GGAGGC
ATCCCCGGCGACCTAT-3′; intron 3 37–59), yielding a 922 bp product [111]. The PCR reaction contained 100 ng total DNA, 1X PCR buffer, 300 nM of each primer, 1.25 U AccuPrime™ PfX DNA Polymerase (Invitrogen Corpor-ation) in 50 μl final volume. After initial denaturation (10 min at 95 °C), a total of 40 PCR cycles were con-ducted, using the following two-step PCR conditions: de-naturation at 95 °C for 20 s and annealing/extension at 68 °C for 1 min, in a MasterCycler Ep thermocycler® (Eppendorf, Hamburg, Germany). The amplicons were separated by electrophoresis through 1.5% agarose gels containing 0.1 μg/ml ethidium bromide. A human gen-omic DNA sample was provided by ViiV Healthcare Ldt. and used as positive Control for the amplification [112]. Data are presented in Fig. 6b. Taken together, this evidence further confirm the human origin of the HMC3 (ATCC®CRL-3304) cell line.
Consistently with the literature, the HMC3 (ATCC®CRL-3304) cells produced sizable amounts of ROS. Reactive free radicals were measured using H2DCF-DA [2,7- dichlorodi-hydrofluorescein diacetate (Invitrogen)]. At the end of the experiment, the incubation medium was replaced by Hank’s balanced salt solution (HBSS) containing 20 μM of H2DCF-DA [20]. Cells were incubated at 37 °C, in a
Table 3Antibodies and reagents used for immunocytochemistry and flow cytometry Immunocytochemistry
mAbs or immunostaining reagents Concentration Final dilution used
DAPI (4′,6-diamidino-2-phenylindole, dihydrochloride) (ThermoFisher Cat. N. D1306)
5 mg/ml 1/2000
Rhodamine phalloidin (ThermoFisher Cat. N. R415) 200 U/ml 1/500
IBA1
(Abcam Cat. N. ab15690)
3.5 mg/ml 1/100
Flow Cytometry
mAbs Optimal Ab volume per test (1 × 10⁶) Final dilution used
PE-conjugated anti-GFAP (BD Pharmingen Cat. N. 561,483) 5μl 1/40
PE-conjugated anti-HLA-DR (BD Bioscience Cat. N. 562,304) 5μl 1/50
FITC-conjugated anti-CD14 (BD Pharmingen Cat. n 555,397) 20μl 1/10
PE-conjugated anti-CD11b (eBioscience™Cat. N. 12–0118-42) 5μl 1/20
PE-conjugated anti CD68 (BD Horizon Cat. N. 564,944) 5μl 1/40
humidified atmosphere with 5% CO2, for 45 min. The fluorescence signal due to H2DCF-DA oxidation within the cells was quantified using a microplate fluorescence reader (PerkinElmer Inc.), using 485 nm as excitation and 535 nm as emission wavelength [113]. Pro-inflammatory cytokines per se, at 10 ng/ml, did not modify basal levels of ROS pro-duction, whereas IL-1β and TNFα each used in combin-ation with IFNγ slightly increased ROS production by HMC3 cells (0.1–0.2-fold increases), in line with previous observations [21]. However, this effect was not consistent among different experiments, carried out between passage 6 and 13. Interestingly, the production of ROS by HMC3 cells growth in either MEM or DMEMF12 was significantly lower, thus suggesting a less activated phenotype under basal conditions when kept in these media (not shown). In addition, we assessed the production of NO indirectly by measuring nitrite accumulation in the incubation media
[108]. Nitrite levels were undetectable under basal condi-tions and remained so after a 24-h treatment with different pro-inflammatory stimuli, including LPS, LPS/IFNγ, and IL-1β, and TNFαused alone or in combination with IFNγ
(data not shown). Consistently, resting HMC3
(ATCC®CRL-3304) cells did not express iNOS, neither its expression was induced by pro-inflammatory activation (Table 5). Conversely, we observed a basal expression of IL-6 (Table5) in resting HMC3 cells, together with a siz-able release of the cytokine in the incubation medium under basal conditions, i.e., 150 pg/ml. The expression level of IL-6 increased in response to pro-inflammatory cyto-kines, particularly IL-1β in combination with IFNγ (II, Table 5). In addition, the cytokine mixture (II) stimulated basal IL-6 secretion by 20-folds (data not shown). Other pro- and anti-inflammatory genes were studied at transcrip-tional levels under basal conditions and after 24-h
A
C
E
B
D
F
G
H
treatments with II (Table 5). The cytokine mixture pro-moted a significant up-regulation of IL-1β, TNFα, and COX2, leaving unmodified the expression of TGFβ and ARG1. In line with our data, it has been recently shown that the HMC3 (ATCC®CRL-3304) cells express at the mRNA level several pro-inflammatory genes, including IL-1β, TNFα, IL-6, COX2, and in addition heme oxygenase-1 [31]. Interestingly, lumirubin, a photoisomer of bilirubin (generated during phototherapic treatment of neonatal hyperbilirubinemia), promoted microglial inflam-matory activation as indicated by the upregulation of all
these genes except COX2 [31]. Moreover, the
pro-inflammatory effects of bilirubin photoisomers were more prominent on rat hippocampal slices, further highlighting relevant differences between human and ro-dent experimental models. Finally, increased expression and release of both IL-1βand IL-18 has been observed in the HMC3 (ATCC®CRL-3304) cells by treatment with
100 ng/ml LPS for 24 h followed by additional 30 min with 5 mM adenosine triphosphate (ATP) [32]. Exposure of HMC3 (ATCC®CRL-3304) cells to LPS/ATP was associated to increased expression of the intracellular NOD-like recep-tor 3 and activation of caspase 1, together with a significant increase of cFos nuclear protein levels. Pro-inflammatory effects of LPS/ATP were indeed reversed by knockdown of cFos. [32]. The treatment with LPS/ATP significantly af-fected microglial viability. All the effects of the LPS/ATP combination were reduced by the α-2 adrenergic agonist, dexmedetomidine [32]. In these research papers, the HMC3 cells were maintained in MEM [31] or EMEM [32] with 10% FCS and antibiotics.
Conclusions
Evidence reviewed in the present paper suggest that the human microglial cell line clone 3 generated in the
laboratory of Prof. Tardieu has been extensively
A
B
C
D
E
characterized, with respect to cell morphology, antigenic profile, and cell functions. However, cells were used under different denominations, i.e., CHME3, HMC3, C13-NJ, and CHME-5, which contributed to data frag-mentation. In this regard, the experimental data reviewed in this article show that the cells, regardless the name adopted, retain a similar antigenic profile to-gether with similar functional properties. The cells are capable of responding to a pattern of chemokines and inflammatory stimuli, regulating the expression of typical activation markers of microglia. Therefore, these cell lines should be regarded as a unique experimental model. Caution should be taken with data obtained
using microglial cells named CHME-5, since it has been reported that several aliquots in use in different labora-tories were cross contaminated by rat glioma cells [19]. Laboratories using the CHME-5 cells should perform an authentication procedure to confirm the human origin. In this regard, the HMC3 (ATCC®CRL-3304) cells present the advantage to have been authenticated by ATCC® according to a complex procedure, including morphology evaluation, karyotyping, and PCR based ap-proaches to confirm the identity of human cell lines and to rule out both intra- and inter-species contamination.
In addition, we showed that the HMC3
(ATCC®CRL-3304) cells retain most of the original anti-genic properties and express also more specific micro-glial markers (recently identified) [2]. Resting cells produce significant amounts of ROS and IL-6. The latter can be further induced by pro-inflammatory cytokines (particularly IL-1β in combination with IFNγ at 10 ng/ ml). Evidence from the literature together with our ori-ginal data may represent an important starting point for researchers that are planning to use this experimental model.
Abbreviations
ACTB:β-actin; ADAMTS: A disintegrin and metalloproteinase with thrombospondin motifs; APP: Amyloid beta precursor protein; ARG: Arginase; ATCC®: American Type Culture Collection; ATP: Adenosine triphosphate; Aβ: Amyloid beta peptide; BDNF: Brain derived neurotrophic factor; CCL: C-C motif chemokine ligand; CCR: C-C chemokine receptor; CD: Cluster of differentiation; CHME3: Human microglial clone 3 cell line; CM: Conditioned medium; CNS: Central nervous system; coMTb: Human peripheral blood monocytes infected withMycobacterium tuberculosis; COX: Cyclooxygenase; CSF1-R: Colony-stimulating factor 1 receptor; CXCR: C-X-C chemokine receptor; DAPI: 4′ ,6-Diamidino-2-phenylindole dihydrochloride; DHA: Docosahexaenoic acid; DMEM: Dulbecco’s modified minimal essential medium; ELISA: Enzyme-linked immunosorbent assay; EMEM: Eagle’s minimum essential medium; EPA: Eicosapentenoic acid; ERK: Extracellular signal–regulated kinase; FCS: Fetal calf serum; FITC-conjugated: Fluorescein isothiocyanate conjugated; GFAP: Glial fibrillary acidic protein; GM-CSF: Granulocyte-macrophage colony-stimulating factor; H2DCF-DA: 2,7-Dichlorodihydrofluorescein diacetate; HBSS: Hank’s balanced salt solution; HCV: Hepatitis virus C; HIV: Human immunodeficiency virus; HLA-DR: Human leukocyte Antigen D Related;
A
B
Fig. 6Expression of the human class I MHC antigens on HMC3 cells.
aHMC3 were plated at the density 30,000 cells/cm2in T25 flasks,
and grown for 3 days when cells were almost confluent. For the detection of class I MHC surface antigens, aliquots of 5 × 10⁵cells in
100μl were directly incubated with FITC-conjugated anti human HLA-ABC mouse Mab, BD Bioscience. This antibody is specific for human MHCI antigens, and does not cross react with rat MHCI antigens. Cells were analyzed by the 6-parameter (2 scatter and 4 fluorescence signals) Coulter Epics XL flow cytometer (Beckman-Coulter). Results from HMC3 cells at passage 8 are shown. Gating strategy: the analysis was obtained after gating according to morphological characteristics (not shown). Background histogram (white) indicates level of cell autofluorescence. A linear region was used for calculating percentage of positive cells.bGel image of PCR products obtained at the end of a HLA Locus B specific amplification protocol. The 922 bp amplicons were separated by electrophoresis through 1.5% agarose gels containing 0.1μg/ml ethidium bromide. Lines 2–3 amplification products from genomic DNA extracted by HMC3 (ATCC®CRL-3304) cells; lines 4–5 amplification products from a positive control, i.e., an anonymous human genomic DNA sample provided by ViiV Healthcare Ldt
Table 5Gene expression analysis of the HMC3 (ATCC®CRL-3304) cells
Gene Control (mean threshold cycle, Ct)
II (Fold variation relative to control)
Pro-inflammatory genes
IL-6 27.97 ± 0.17 (n= 12) 43.75 ± 2.59 (n= 11)
TNFα 32.50 ± 0.20 (n= 12) 5.37 ± 0.45 (n= 11)
IL1β 29.02 ± 0.10 (n= 12) 4.71 ± 0.32 (n= 12)
COX2 33.00 ± 0.50 (n= 9) 2.51 ± 0.46 (n= 9)
NOS2 No Ct (n= 9) No Ct (n= 9)
Anti-inflammatory genes
TGFβ 28.50 ± 0.16 (n= 12) 1.02 ± 0.06 (n= 12)