R E S E A R C H
Open Access
DNA methylome profiling of all-cause
mortality in comparison with
age-associated methylation patterns
Jesper Beltoft Lund
1, Shuxia Li
2, Jan Baumbach
3,4, Anne Marie Svane
1, Jacob Hjelmborg
1, Lene Christiansen
1,
Kaare Christensen
1,2, Paul Redmond
5, Riccardo E. Marioni
6,7, Ian J. Deary
5,7and Qihua Tan
1,2*Abstract
Background:Multiple epigenome-wide association studies have been performed to identify DNA methylation patterns regulated by aging or correlated with risk of death. However, the inter-relatedness of the epigenetic basis of aging and mortality has not been well investigated.
Methods:Using wide DNA methylation data from the Lothian Birth Cohorts, we conducted a genome-wide association analysis of all-cause mortality and compared this with age-associated methylation patterns reported on the same samples.
Results:Survival analysis using the Cox regression model identified 2552 CpG sites with genome-wide significance (false discovery rate < 0.05) for all-cause mortality. CpGs whose methylation levels are associated with increased mortality appear more distributed from the gene body to the intergenic regions whereas CpGs whose methylation levels are associated with decreased mortality is more concentrated at the promoter regions. In comparison with reported CpGs displaying significant age-dependent methylation patterns in the same samples, we observed a limited but highly significant overlap between mortality-associated and age-associated CpGs (pvalue 2.52e−06). Most importantly, the overlapping CpGs are dominated by those whose overall age-related methylation patterns reduce the risk of death.
Conclusion:All-cause mortality is significantly associated with altered methylation at multiple genomic sites with differential distribution in gene regions for CpGs correlated with increased or decreased risk of death. The age-dependent methylation changes could reflect an active response to the aging process that contributes to maintain individual survival.
Keywords:Mortality, Epigenome-wide association study, Aging, DNA methylation, Old cohorts
Background
As an important mechanism in epigenetic regulation, DNA methylation (DNAm) has been shown to have sig-nificant impacts on biological processes (aging, develop-ment) and diseases [1]. Recent advancement in genomic analysis has enabled collection of large-scale DNAm data at genome levels on samples from older-aged individuals,
such as the Lothian Birth Cohort (LBC) study [2], for glo-bal profiling of the aging DNA methylome. For example, a recent epigenome-wide association study (EWAS) identified a large number of 67,604 differentially meth-ylated genomic sites associated with age in the LBC samples (family-wise error rate, FWER < 0.05) of which 5168 sites were replicated in independent samples [3].
Although studying the age-related change in DNAm can help to assess the epigenetic regulation during hu-man aging [4–6] and might be relevant to age-related changes in health [7], it would be valuable to examine directly the epigenetic associations with death or all-cause mortality, an objective measure of the overall * Correspondence:[email protected]
1Epidemiology and Biostatistics, Department of Public Health, Faculty of
Health Science, University of Southern Denmark, J. B. Winsløws Vej 9B, DK-5000 Odense, Denmark
2Unit of Human Genetics, Department of Clinical Research, University of
Southern Denmark, Odense, Denmark
Full list of author information is available at the end of the article
health of a population. In the literature, several EWASs on all-cause mortality have been published, for example, by Zhang et al. [8] and by Svane et al. [9], revealing sig-nificant sites in association with overall risk of death al-though with low or even no overlap. Because current EWAS has been conducted either on chronological age or mortality, the epigenetic inter->relationship between aging and mortality has not been well described.
Using the LBC data, we performed survival analysis on genome-wide DNA methylation levels with two aims: first, to look for epigenetic markers of all-cause mortality in the older-aged LBC cohorts, and second, to explore the epigenetic link between all-cause mortal-ity and the aging process, by comparing mortalmortal-ity-asso- mortality-asso-ciated methylation changes with age-associated methylation patterns. The second aim took advantage of the published EWAS on age-related changes in DNA methylation levels in the same LBC samples from Li et al. [3].
Methods
The Lothian Birth Cohort samples
The LBC samples consist of 2195 blood samples taken from 1425 individuals of two birth cohorts born in 1921 and 1936 (Table 1), with between 1 and 4 whole blood samples per participant collected over the follow-up waves.
The 1921 birth cohort (LBC1921) was collected in the period 1999–2013. The mean initial recruitment age was 79 years, with 550 individuals (476 with methy-lation data) at the start. The 1936 birth cohort (LBC1936) was collected from 2004 to date and con-tains 1091 individuals (949 with methylation data) with a mean age at initial recruitment of 70 years. Both are longitudinal samples with repeated visits about every 3 years in the Lothian region (Edinburgh and its sur-rounding areas) of Scotland. The LBC samples have been described in open-access protocol and profile arti-cles [2, 10, 11]. During each wave, the blood sample for each participant was collected. Genome-wide DNA methylation was analyzed using the Illumina Human Methylation 450K Beadchip containing 485,512 CpG sites. For this study, only the DNA methylation data from the last available blood sample of each individual were analyzed for association with mortality. The LBC
data are accessible through the European Genome-phe-nome Archive (https://www.ebi.ac.uk/ega/home) with an accession number EGAS00001000910.
Ethics permission for the LBC1921 was obtained from the Lothian Research Ethics Committee (Wave 1: LREC/1998/4/183). Ethics permission for the LBC1936 was obtained from the Multi-Center Research Ethics Committee for Scotland (Wave 1: MREC/01/0/56), the Lothian Research Ethics Committee (Wave 1: LREC/ 2003/2/29). Written informed consent was obtained from all subjects. The study was conducted in accord-ance with the principles of the Helsinki Declaration.
DNA methylation data pre-processing
We removed polymeric probes with European allele fre-quency above 1% (10,627 CpGs), cross-reactive probes (29,233 CpGs) [12], and CpGs with more than 5% missing values or detectionpvalues > 0.05 across all samples (89 CpGs) as probe-level quality control (QC). CpGs from the sex-chromosomes (X and Y) were also removed from the analysis (11,648 CpGs). After preprocessing, 445,544 out of the 485,512 CpGs remained. Sample level QC was per-formed using conventional quality control measurements by removing samples in which > 1% of the probes had a detection p value > 0.05, estimated using the R package
minfi [13]. For subsequent analysis, the methylation β values were logit transformed into methylationMvalue as
M= log2(β/(1−β)).
To account for cell composition effect when measur-ing DNA methylation in whole blood samples, blood cell-type composition has been estimated using House-man’s method [14] implemented in the R package
cell-types450 (https://github.com/brentp/celltypes450). The package estimated cell-type proportions for CD8T, CD4T, natural killer cell (NK), B cell, monocyte, and granulocyte which were included in regression models as covariates for adjusting blood cell heterogeneity.
To control for potential batch effect, we performed a principal component analysis (PCA) on the cohorts and found a subgroup belonging to a specific line of Illumina 450K BeadChip batches (N= 129) (Additional file1: Fig-ure S1). Based on the top 2 principal components from PCA, we ran ComBat [15] using the R package sva[16] to remove the batch effect. As shown by Additional file1: Figure S1, ComBat successfully removed the batch
Table 1The Lothian Birth Cohorts LBC1921 and LBC1936 with elderly participants conducted from 1999 and onward
Dataset LBC1921 LBC1936 Total
N 476 949 1425
Women 286 (60%) 471 (50%) 757
Deaths 365 (77%) 154 (16%) 519
Age (years) at blood sampling (mean) 78–95 (79) 67–77 (70) 67–95
effect. Correction for batch effect enabled joint analysis of the 1921 and 1936 birth cohorts, providing higher statistical power for the EWAS.
Statistical analysis
We fitted a Cox regression model for each CpG to esti-mate the association between methylation and mortality adjusting for age at blood sampling, sex, and correcting for cell composition. Time-to-event was defined as Δage, measuring the time in years from blood sampling to death (with right-censoring). Correcting for multiple testing was done by calculating the false discovery rate (FDR) [17] and defining FDR < 0.05 as genome-wide significance. R scripts for data analysis including data preprocessing have been deposited in GitHub at https://github.com/Silver-Hawk/ Lund_et_al_2019_EWAS_AllCauseMortalityAgePatterns
Pathway analysis
The identified CpGs were linked to nearest genes using the Illumina 450K BeadChip annotation file and split into two sets with either negative or positive mortality associations. Each set was tested for over-representation of gene sets (pathways) using the Molecular Signatures Database through Gene Set En-richment Analysis (GSEA) [18] based on the canon-ical pathway’s curated gene sets (CP, 1329 gene sets in the collection). The over-representation analysis is a statistical test based on hypergeometric distribution for testing if the submitted list of genes contains more genes from a pathway or gene set than would be expected by chance (see below). The test produces a probability score for each pathway or gene set, which is corrected by calculating FDR using the Ben-jamini-Hochberg method [17].
Hypergeometric test
We used a hypergeometric test both for pathway ana-lysis as described above and for testing if the age-associated CpGs (N= 67,604) from Li et al. [3] are over-represented in the significant CpGs for mortality. Assuming Nis the total number of CpGs on the 450K array after QC (here,N =445,544 CpGs),mthe number of significant CpGs for mortality, n the number of CpGs significantly regulated by age, and kthe number of overlapping CpGs significant for both age and mor-tality. The probability for randomly observing X≥k age-regulated CpGs in the m mortality related CpGs can be calculated as:
p Xð ≥kÞ ¼1−Xkr¼
0
m r
N−m n−r
= Nn :
For pathway over-representation analysis, N is the number of genes linked to all CpGs on the 450K array,
m is the number of genes linked to mortality-related CpGs,nis the number of genes in a particular biological pathway, andkis the number of genes belonging to both the pathway under testing and the list of genes linked to mortality-related CpGs.
Results
Single CpG-based EWAS
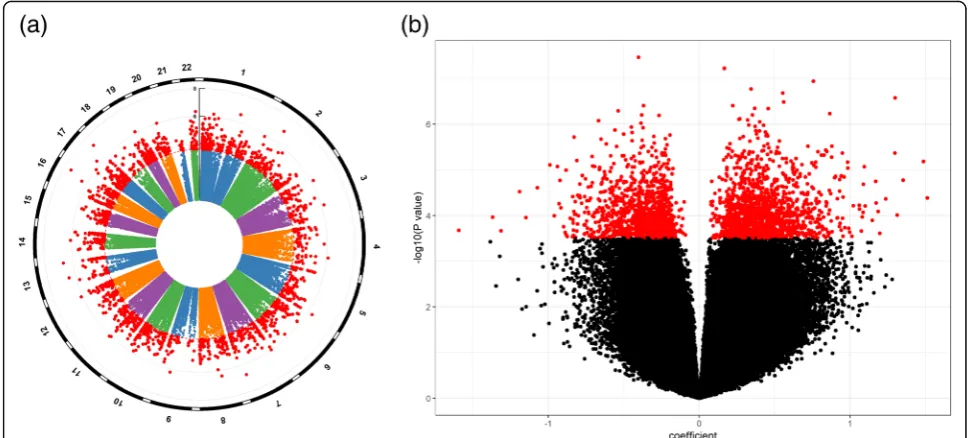
Applying the Cox regression model to each of the measured CpGs on the LBC samples (N= 1425, deaths = 519) identified a total of 2552 CpGs signifi-cantly associated with mortality, with FDR < 0.05. Dis-tributions of chromosome-wise and overall p values are depicted in Fig. 1a and b; CpGs with FDR < 0.05 are marked in red. Of these, 1403 were positively asso-ciated (Fig. 1b, right) and 1149 negatively associated (Fig.1b, left) with mortality. From Fig.1b, we see that there are more CpGs whose methylation levels are positively correlated with mortality than CpGs display-ing negative correlation. Table 2 shows 22 CpGs with
p value < 1e−06. Among them, only 7 are negatively associated with mortality. The full list of significant CpGs (FDR < 0.05) with their associated genes is re-ported in Additional file 2: Table S1. The QQ plot (Additional file 3: Figure S2) indicates a large number of CpGs displaying potential contribution to all-cause mortality but only the top ones reached genome-wide significance (FDR < 0.05, red dots) after correcting for multiple testing.
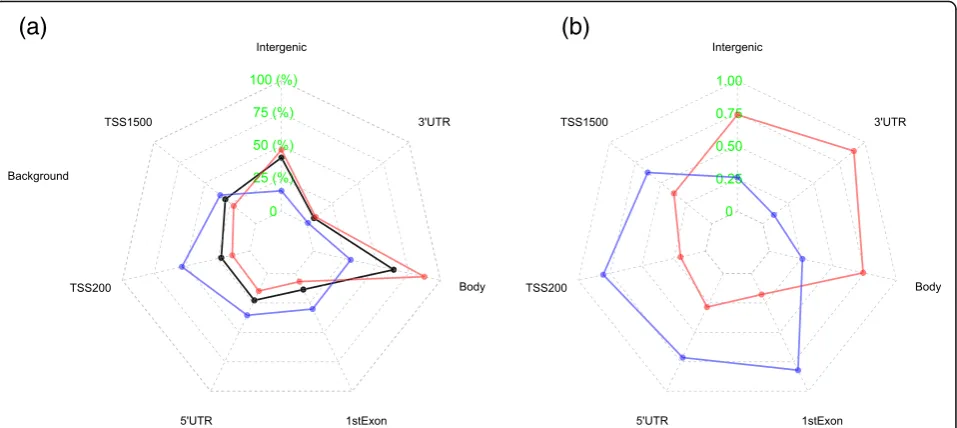
We compared the distribution over gene regions be-tween the two sets of CpGs with positive and negative associations with mortality, to check if there were any differences in their genomic locations (Fig. 2). CpGs associated with increased mortality when methylated (red) appear noticeable more distributed from the gene body to the intergenic regions whereas CpGs as-sociated with decreased mortality (blue) are more con-centrated at the promoter regions, in comparison with the distribution of all CpGs on the 450K array (black) in Fig. 2a. A more striking picture is shown by Fig. 2b which displays the frequency of positive (red) and negative (blue) mortality association CpGs in all mortality-associ-ated CpGs at each region, which shows a striking split in gene regions between the two sets. The frequency in
Fig. 2b is an absolute frequency of positive and negative
mortality association CpGs calculated at each region while the frequency in Fig.2a is a relative proportion of positive or negative mortality-associated CpGs over the regions.
Pathway analysis
Fig. 1Illustration of results from EWAS on mortality presented by plotting−log10(pvalue) against CpG’s chromosomal location (a, Manhattan
plot) and CpG’s regression coefficient in the Cox model (b, volcano plot)
Table 2Statistics and annotations for the top 22 CpGs withp< 1e−06
CpG* HR1 SE Zscore pvalue FDR* CHR* MAPINFO* Gene* Gene group* CpG
island*
cg00154443 0.6695028 0.072733 −5.51634 3.46E−08 0.008403 16 71917454 ATXN1L;ZNF821 Body;TSS200 N_Shore
cg03636200 1.1806664 0.030655 5.417627 6.04E−08 0.009774 17 80005395 N_Shelf
cg04157272 2.1306391 0.142672 5.301819 1.15E−07 0.013814 2 68017838
cg03217572 1.4100455 0.065719 5.228685 1.71E−07 0.013814 7 142561918 EPHB6 Body
cg01083884 1.7394170 0.106624 5.191615 2.08E−07 0.01446 13 113641411 MCF2L Body
cg07202479 3.6623902 0.252289 5.145359 2.67E−07 0.014684 1 159174162 DARC TSS1500
cg10741568 1.7502471 0.109628 5.105981 3.29E−07 0.014684 13 49546137 N_Shelf
cg27649037 1.2494070 0.043894 5.072916 3.92E−07 0.014684 8 53322510 ST18 TSS200
cg16473125 0.6918957 0.072615 −5.07224 3.93E−07 0.014684 16 55090720 Island
cg09049436 1.4448276 0.072928 5.045959 4.51E−07 0.014779 5 178854758
cg14517004 1.5786783 0.090526 5.043703 4.57E−07 0.014779 22 48946660 FAM19A5 Body
cg06654691 0.5845868 0.1069 −5.02195 5.12E−07 0.015521 17 40825980 PLEKHH3 Body N_Shore
cg06936355 2.3773894 0.173358 4.995453 5.87E−07 0.015694 9 99213110 HABP4 Body Island
cg24860169 1.4223750 0.070717 4.98224 6.29E−07 0.015694 1 46924753
cg22819488 0.6837794 0.076321 −4.98058 6.34E−07 0.015694 3 28390286 AZI2;AZI2 1stExon;5′UTR Island
cg07552157 0.7664161 0.053454 −4.97678 6.47E−07 0.015694 3 142720316 SR140 TSS200 Island
cg00003305 1.3086604 0.054424 4.94274 7.70E−07 0.016988 19 30715645 Island
cg04402350 1.3023196 0.053478 4.939353 7.84E−07 0.016988 4 146857565 ZNF827 Body Island
cg09724798 1.3792984 0.06519 4.932918 8.10E−07 0.016988 12 119741507 LOC144742 TSS1500
cg16503753 0.5136465 0.135248 −4.92589 8.40E−07 0.016988 14 64319245 SYNE2 TSS1500 N_Shore
cg01773858 1.4928783 0.081542 4.914106 8.92E−07 0.017321 11 73076892 ARHGEF17 Body S_Shelf
cg12145550 0.6807161 0.078476 −4.90104 9.53E−07 0.017801 20 44600942 ZNF335 TSS200 Island
1
Hazard ratio, compared to baseline hazard
association with mortality separately to GSEA identified 175 and 200 pathways significantly enriched by each of the two lists of genes (FDR < 0.05) (Additional file 4: Table S3 and Additional file5: Table S2). Comparing the pathways in the two tables, there are shared top path-ways such as the MAPK signaling pathway. However, the most significant pathways are characterized by those involving immune function for genes linked to negative mortality association CpGs, whereas for positive mortal-ity association CpGs, the most significant pathways are characterized by genes encoding the extracellular matrix (ECM) proteins.
Epigenetic link between aging and mortality
Using the estimates on age-associated methylation changes from Li et al. [3], we explore the relationship in DNA methylation regulation between mortality and aging. In Fig.3a, we plot the test statistic (zvalue from Cox regression model) on each of the 2552 significant CpGs associated with mortality (FDR < 0.05) on the
x-axis against the corresponding test statistic (t value from linear regression model) on age (p< 0.05 colored in red or blue) on y-axis. Among the 1403 CpGs posi-tively associated with mortality (Fig. 3a, right panel), a large number (580 CpGs, 41.3%) have decreased methy-lation and only a small number (28 CpGs, 2%) has in-creased methylation with aging. The other half (795 CpGs, 57%) of the positive mortality association CpGs do not show any significant age pattern (p> 0.05). Among the 1149 negative mortality association CpGs (Fig. 3a, left panel), 113 (9.8%) CpGs have increased
methylation and only 25 (2.2%) CpGs have decreased methylation with aging. Methylation level at the major-ity (1011 CpGs, 88%) of the negative mortalmajor-ity associ-ation CpGs is not affected by aging (p> 0.05). In
Fig. 3a, CpGs positively associated with mortality but
hypermethylated with age or negatively associated with mortality but hypomethylated with age convey in-creased risk of death as a result of aging and are marked in red; CpGs positively associated with mortal-ity but hypomethylated with age or negatively associ-ated with mortality but hypermethylassoci-ated with age are beneficial to survival during aging and are marked in blue. Using hypergeometric test, we estimated the prob-ability of observing the number of colored CpGs in each of the four areas in Fig. 3a. Only the blue-colored CpGs in the bottom-right showed a p value of 2.52e −06, suggesting it is very unlikely to observe 580 or more CpGs (k) demethylated with age (p< 0.05) if we randomly take 1403 CpGs (m) from all CpGs tested (N) among which 158,144 CpGs (n) are demethylated with age (p< 0.05, EWAS results from Li et al. [3]).
Figure 3b plots the tvalues for the 67,604 age-regu-lated significant CpGs (FWER < 0.05) from the EWAS on aging by Li et al. [3] on the X-axis against their
z-statistic for mortality association in the Cox models fitted in this study. Of the 9688 CpGs methylated with age (Fig.3b, right panel), 841 (8.7%) are negatively and 239 (2.5%) are positively associated with mortality (p< 0.05), with the majority (88.8%) having no connection with mortality (p> 0.05). Of the 57,916 CpGs demethy-lated with age, 367 (0.6%) are negatively and 6328
(a)
(b)
(10.9%) are positively associated with mortality; again, the majority (88.5%) are not related to mortality (p> 0.05). Similar to Fig.3a, red/blue colors represent CpGs whose age-associated methylation patterns increase/de-crease the risk of death. Applying the hypergeometric test, we found the distributions of blue-colored CpGs in Fig. 3b are significantly different from random with
p value = 1.88e−61 for the bottom-right area (n = 21,281, m = 9688, k = 841) and p= 2.12e−71 for the top-left area (n =39,679, m =57,916, k = 6328), suggest-ing that the probabilities for randomly observsuggest-ing the num-ber or more of the blue CpGs in the two areas are extremely low. Tests for the distribution of the number of red CpGs showed no difference from random.
Finally, Fig.3also presents a small group of 178 CpGs with genome-wide significance in both EWAS on mor-tality (FDR < 0.05) and EWAS on aging (FWER < 0.05) (same set of the large dots in Fig.3a, b).
Discussion
Compared with the large number of age-regulated CpGs (N= 67,604) found in the LBC cohorts by Li et al. [3], the 2552 CpGs (FDR < 0.05) detected in association with all-cause mortality in this study is in great contrast in magnitude. A large number of age-related CpGs have also been reported by Moor et al. [19] with 56,579 CpGs, of which less than 0.05% were associated with mortality. Although the number of significant sites identified de-pends largely on the power of a study, the striking differ-ence in the number of significant sites for aging and mortality from the same relatively large LBC sample
could indicate that aging as a complex process can in-volve numerous epigenetic remodeling in the DNA methylome to a larger extent than that for mortality. Note that the above results were all based on blood sam-ples after adjusting for cell compositions. Tan et al. [20] discussed the importance of considering cell type hetero-geneity in epigenetic studies on aging using blood sam-ples and different options of adjustment. According to Tan et al. [20], the widely accepted adjustment scheme that controls for cell compositional effect is an efficient handling of the cell type issue in consideration of statis-tical power and systematic bias [21].
Our findings on the relationship between mortality-and age-associated CpGs seem contradictory to general expectation as aging is related to increased risk of death. The patterns showing in Fig. 3 are based on co-efficients from regression models; thus, the conclusions are made on the mean levels. Taking the blue CpGs in the bottom-right panel of Fig. 3a for example, because of their positive effects on mortality, hypermethylation at these CpGs lead to increased risk of death. However, according to their age-dependent methylation patterns, the mean methylation levels decrease with increasing age. This means increased mortality among a group of individuals with increased methylation by age. However, since the mean methylation is going down with age, the effects of age-associated methylation change at these CpGs do not, on average, increase the hazard of death. We postulate that the significantly over-represented protective effects of age-associated methylation pat-terns could reflect the active response to aging that
(a)
(b)
helps to maintain survival or, in other words, the main stream of age-dependent methylation patterns might represent an epigenetic mechanism for successful aging. The finding merits further investigation with a focus on the causation of DNA methylation and aging to provide clues for elucidating the underlying biology.
As discussed above, the positive and negative mortality association CpGs in Fig.3manifest differently in terms of aging. From Fig.2, we see that they are also differentially distributed over gene regions with positive mortality asso-ciation CpGs distributed mainly from gene body to the intergenic region and negative mortality association CpGs in the promoter regions. The differential distribution could help to explain the functional differences of the two lists of CpGs. The top biological pathways signifi-cantly over-represented by genes linked to the positive mortality association CpGs (Additional file4: Table S3) are mainly implicated in the function of ECM while the most significant pathways from genes linked to the negative mortality association CpGs (Additional file 5: Table S2) are extensively involved in immune functions. The molecular or biological basis of these differences merits further investigation.
Svane et al. [9] performed an EWAS on mortality in middle-aged and old Danish twins (N= 870, deaths = 258) using the same platform for DNA methylation analysis as in our study. A total of 2806 significant CpGs with FDR < 0.05 was revealed. In our primary analysis, without adjusting for the cohort effect between LBC1921 and LBC1936, there were 7 significant CpGs (FDR < 0.05) overlapped with the Danish study. After we corrected the cohort effect using ComBat, no overlapping CpG with FDR < 0.05 was found. There were 57 overlapping CpGs (43 positively and 14 negatively associated with mortality) with p< 0.05 in their study. In another EWAS on all-cause mortality, Zhang et al. [8] reported a list of 58 CpGs from blood samples. Again, no overlap was observed with this study. It has already been shown that low or no replication is a frequent phenomenon in (epi)genome-wide association studies [22]. For example, of the 2806 CpGs reported by Svane et al. [9], only 2 overlapped with the CpGs found by Zhang et al. [8] and none with the mortality-related CpGs reported by a Finnish EWAS [23]. Future large-scale consortium studies and meta-analysis should be encouraged to nar-row down the epigenetic targets for all-cause mortality.
Considering methylation changes at different CpGs in the same regulatory region or gene body could alter the expression of the same gene, we additionally performed gene-level replication using the EWAS results from Da-nish twins. Among their 2806 significant CpGs with FDR < 0.05, 2112 CpGs could be linked to nearby genes using the Illumina Methylation 450K BeadChip annotation file, resulting in a total of 2032 uniquely mapped genes. We
found 330 shared genes from our list of 2036 unique genes linked to our 2552 CpGs with FDR < 0.05. Different from CpG-level replication, the gene-level replication led to a replication rate of over 16%. Using the hypergeo-metric test, we estimated the probability of having 330 or more shared genes between the two EWASs if randomly sampling 2032 genes from the pool of 21,244 proximal genes of the 450K chip. The probability was estimated as
p= 1.64e−23, meaning that it is highly unlikely to observe the 330 overlapping genes by chance.
In summary, this genome-wide DNA methylation profil-ing on the older-age Lothian Birth Cohorts identified 2, 552 CpG associated with mortality. In comparison with EWAS results on aging from the same sample, most mortality-associated CpGs do not display age-dependent patterns and the majority of age-associated CpGs do not correlate with mortality, but the limited overlap between them is highly significant from random. Besides, the pre-dominately beneficial effects to survival from CpGs show-ing age-dependent methylation patterns could perhaps reflect active response to aging or represent an epigenetic regulation for successful aging.
Additional files
Additional file 1:Figure S1PCA performed to identify batch effect, and ComBat correction using theSVAR-package with distributions of M-values before and after ComBat correction. (DOCX 571 kb)
Additional file 2:Table S1List of significant CpGs (FDR < 0.05) found using the Cox-proportional hazard model for finding CpGs associated with all-cause mortality. (CSV 427 kb)
Additional file 3:Figure S2QQ-plot for the EWAS on mortality in the combined dataset of LBC1921 and LBC1936. (DOCX 20 kb)
Additional file 4:Table S3List of pathways enriched by positive mortality association CpGs with FDR < 0.05. (XLSX 37 kb)
Additional file 5:Table S2List of pathways enriched by negative mortality association CpGs with FDR < 0.05. (XLSX 40 kb)
Abbreviations
DNAm:DNA methylation; ECM: Extracellular matrix; EWAS: Epigenome-wide association study; FDR: False discovery rate; FWER: Family-wise error rate; GSEA: Gene Set Enrichment Analysis; LBC: Lothian Birth Cohort; NK: Natural killer cell; PCA: Principal component analysis; QC: Quality control; QQ plot: Quantile-quantile plot
Acknowledgements
Funding
This work was supported by the Velux Foundation research grant #00012540.
Authors’contributions
QT, SL, JB, and KC conceived the concept and designed the experiment. JL, SL, and QT performed the data analysis and wrote the manuscript. AMS, JH, LC, PR, REM, and IJD contributed to the data collection and interpretation of research findings. All authors discussed the results and commented on the manuscript. All authors read and approved the final manuscript.
Ethics approval and consent to participate
Ethics permission for the study protocol was obtained from the Multi-Centre Research Ethics Committee for Scotland (MREC/01/0/56) and from Lothian Research Ethics Committee (LREC/2003/2/29).
Consent for publication
Written consent was obtained for all authors.
Competing interests
The authors declare that they have no competing interests.
Publisher’s Note
Springer Nature remains neutral with regard to jurisdictional claims in published maps and institutional affiliations.
Author details
1Epidemiology and Biostatistics, Department of Public Health, Faculty of
Health Science, University of Southern Denmark, J. B. Winsløws Vej 9B, DK-5000 Odense, Denmark.2Unit of Human Genetics, Department of Clinical
Research, University of Southern Denmark, Odense, Denmark.3Department of Mathematics and Computer Science, University of Southern Denmark, Odense, Denmark.4Chair of Experimental Bioinformatics, School of Life Sciences Weihenstephan, Technical University of Munich, Munich, Germany.
5
Department of Psychology, University of Edinburgh, Edinburgh, Scotland, UK.6Center for Genomic and Experimental Medicine, University of
Edinburgh, Edinburgh, Scotland, UK.7Center for Cognitive Aging and Cognitive Epidemiology, University of Edinburgh, Edinburgh, Scotland, UK.
Received: 7 November 2018 Accepted: 24 January 2019
References
1. Tan Q, Christiansen L, Thomassen M, Kruse TA, Christensen K. Twins for epigenetic studies of human aging and development. Ageing Res Rev. 2013;12(1):182–7.
2. Taylor AM, Pattie A, Deary IJ. Cohort profile update: the Lothian Birth Cohorts of 1921 and 1936. Int J Epidemiol. 2018;47:1042.
3. Li S, Christiansen L, Christensen K, Kruse TA, Redmond P, Marioni RE, et al. Identification, replication and characterization of epigenetic remodelling in the aging genome: a cross population analysis. Sci Rep. 2017;7(1):8183. 4. Wahl S, Drong A, Lehne B, Loh M, Scott WR, Kunze S, et al. Epigenome-wide
association study of body mass index, and the adverse outcomes of adiposity. Nature. 2017;541(7635):81–6.
5. Horvath S. DNA methylation age of human tissues and cell types. Genome Biol. 2013;14(10):3156.
6. Hannum G, Guinney J, Zhao L, Zhang L, Hughes G, Sadda S, et al. Genome-wide methylation profiles reveal quantitative views of human aging rates. Mol Cell. 2013;49(2):359–67.
7. Marioni RE, Shah S, McRae AF, Chen BH, Colicino E, Harris SE, et al. DNA methylation age of blood predicts all-cause mortality in later life. Genome Biol. 2015;16(1):25.
8. Zhang Y, Wilson R, Heiss J, Breitling LP, Saum K-U, Schöttker B, et al. DNA methylation signatures in peripheral blood strongly predict all-cause mortality. Nat Commun. 2017;8:14617.
9. Svane AM, Soerensen M, Lund J, Tan Q, Jylhävä J, Wang Y, et al. DNA methylation and all-cause mortality in middle-aged and elderly Danish twins. Genes. 2018;9(2):78.
10. Deary IJ, Gow AJ, Taylor MD, Corley J, Brett C, Wilson V, et al. The Lothian Birth Cohort 1936: a study to examine influences on cognitive ageing from age 11 to age 70 and beyond. BMC Geriatr. 2007;7(1):28.
11. Deary IJ, Gow AJ, Pattie A, Starr JM. Cohort profile: the Lothian Birth Cohorts of 1921 and 1936. Int J Epidemiol. 2011;41(6):1576–84.
12. Y-a C, Lemire M, Choufani S, Butcher DT, Grafodatskaya D, Zanke BW, et al. Discovery of cross-reactive probes and polymorphic CpGs in the Illumina Infinium HumanMethylation450 microarray. Epigenetics. 2013;8(2):203–9. 13. Aryee MJ, Jaffe AE, Corrada-Bravo H, Ladd-Acosta C, Feinberg AP, Hansen
KD, et al. Minfi: a flexible and comprehensive Bioconductor package for the analysis of Infinium DNA methylation microarrays. Bioinformatics. 2014; 30(10):1363–9.
14. Houseman EA, Accomando WP, Koestler DC, Christensen BC, Marsit CJ, Nelson HH, et al. DNA methylation arrays as surrogate measures of cell mixture distribution. BMC Bioinformatics. 2012;13(1):86.
15. Johnson WE, Li C, Rabinovic A. Adjusting batch effects in microarray expression data using empirical Bayes methods. Biostatistics. 2007;8(1):118–27.
16. Sachs N, de Ligt J, Kopper O, Gogola E, Bounova G, Weeber F, et al. A living biobank of breast cancer organoids captures disease heterogeneity. Cell. 2017;172:373–86.
17. Benjamini Y, Hochberg Y. Controlling the false discovery rate: a practical and powerful approach to multiple testing. J R Stat Soc Ser B Methodol. 1995;57(1):289–300.
18. Subramanian A, Tamayo P, Mootha VK, Mukherjee S, Ebert BL, Gillette MA, et al. Gene set enrichment analysis: a knowledge-based approach for interpreting genome-wide expression profiles. Proc Natl Acad Sci. 2005; 102(43):15545–50.
19. Moore AZ, Hernandez DG, Tanaka T, Pilling LC, Nalls MA, Bandinelli S, et al. Change in epigenome-wide DNA methylation over 9 years and subsequent mortality: results from the InCHIANTI Study. J Gerontol A Biomed Sci Med Sci. 2015;71(8):1029–35.
20. Tan Q, Heijmans BT, Hjelmborg JV, Soerensen M, Christensen K, Christiansen L. Handling blood cell composition in epigenetic studies on ageing. Int J Epidemiol. 2017;46(5):1717–8.
21. Shiwa Y, Hachiya T, Furukawa R, Ohmomo H, Ono K, Kudo H, et al. Adjustment of cell-type composition minimizes systematic bias in blood DNA methylation profiles derived by DNA collection protocols. PLoS One. 2016;11(1):e0147519.
22. Aslibekyan S, Claas SA, Arnett DK. To replicate or not to replicate: the case of pharmacogenetic studies: establishing validity of pharmacogenomic findings: from replication to triangulation. Circ Cardiovasc Genet. 2013;6(4):409. 23. Jylhävä J, Kananen L, Raitanen J, Marttila S, Nevalainen T, Hervonen A, et al.