Open Access
Research
A quantitative comparison of different methods to detect
cardiorespiratory coordination during night-time sleep
Dirk Cysarz*
1,2, Henrik Bettermann
1, Silke Lange
3, Daniel Geue
3and
Peter van Leeuwen
3Address: 1Department of Clinical Research, Gemeinschaftskrankenhaus Herdecke D-58313 Herdecke, Germany, 2Institute of Mathematics,
University of Witten/Herdecke D-58455 Witten, Germany and 3Department of Biomagnetism, Research and Development Center for
Microtherapy (EFMT) D-44799 Bochum, Germany
Email: Dirk Cysarz* - [email protected]; Henrik Bettermann - [email protected]; Silke Lange - [email protected]; Daniel Geue - [email protected]; Peter van Leeuwen - [email protected]
* Corresponding author
Abstract
Background: The univariate approaches used to analyze heart rate variability have recently been extended by several bivariate approaches with respect to cardiorespiratory coordination. Some approaches are explicitly based on mathematical models which investigate the synchronization between weakly coupled complex systems. Others use an heuristic approach, i.e. characteristic features of both time series, to develop appropriate bivariate methods.
Objective: In this study six different methods used to analyze cardiorespiratory coordination have been quantitatively compared with respect to their performance (no. of sequences with cardiorespiratory coordination, no. of heart beats coordinated with respiration). Five of these approaches have been suggested in the recent literature whereas one method originates from older studies.
Results: The methods were applied to the simultaneous recordings of an electrocardiogram and a respiratory trace of 20 healthy subjects during night-time sleep from 0:00 to 6:00. The best temporal resolution and the highest number of coordinated heart beats were obtained with the analysis of 'Phase Recurrences'. Apart from the oldest method, all methods showed similar qualitative results although the quantities varied between the different approaches. In contrast, the oldest method detected considerably fewer coordinated heart beats since it only used part of the maximum amount of information available in each recording.
Conclusions: The method of 'Phase Recurrences' should be the method of choice for the detection of cardiorespiratory coordination since it offers the best temporal resolution and the highest number of coordinated sequences and heart beats. Excluding the oldest method, the results of the heuristic approaches may also be interpreted in terms of the mathematical models.
Background
The time intervals between successive heartbeats (e.g. the
RR tachogram or, equivalently, the series of instantaneous heart rates) may be analyzed with different tools to obtain
Published: 25 November 2004
BioMedical Engineering OnLine 2004, 3:44 doi:10.1186/1475-925X-3-44
Received: 02 September 2004 Accepted: 25 November 2004
This article is available from: http://www.biomedical-engineering-online.com/content/3/1/44
© 2004 Cysarz et al; licensee BioMed Central Ltd.
information about e.g. heart rate variability (HRV) [1], regularity of the time series [2-7], or large-scale correla-tions in the time series [8-10]. Each technique provides different information about the 'time-structure' contained in the series of successive heartbeats. Some of them, like information obtained from HRV, may be linked to the sympathetic and parasympathetic activity of the auto-nomic nervous system [1,11]. Hence, they offer the possi-bility to interpret the derived quantities in terms of physiology. Furthermore, when applied to data obtained from patients suffering from heart diseases, these different information may be combined and used for risk stratifica-tion [12,13]. A large body of work concentrates on these univariate time series analysis and standards have been established [1].
To gain information that cannot be extracted from a single time series, the interaction between two (or more) physi-ological (sub-)systems has been investigated. This is often done on the basis of simultaneously recorded time series of each system. Hence, new bivariate techniques have been developed that aim to quantify the imprint of the physiological interaction between the two systems [14-17]. Especially, techniques which analyze the cardiorespi-ratory interaction have been developed recently [18-24]. Among these techniques the coordination between the series of successive heartbeats and the series of successive respiratory cycles, further denoted as cardiorespiratory coordination, is one focus of attention.
In fact, physiologists had already investigated cardiorespi-ratory coordination in the human organism as early as the 1960ies [25]. Calculating the distance between an inspir-atory onset and its preceding R-peak they found intermit-tent coordination between heartbeat and respiration. In the 1970ies this interesting topic was no longer followed up (except in one study [26]), presumably because the physiological interpretation of the results was limited, although the last reviews of this era appeared in the late 1980ies [27-29]. The investigation of cardiorespiratory coordination has recently been revived mainly by physi-cists and mathematicians. They first studied the interac-tion of two weakly coupled chaotic oscillators and found synchronization of the phases whereas the amplitudes of the oscillators remained uncorrelated [30]. This class of mathematical models may serve as an approximate quali-tative model for the interaction of heartbeat and respira-tion [19]. On the basis of these models new techniques for the analysis of bivariate time series data recorded from these physiological systems have been developed [22,31,32]. Other approaches have also been used to develop methods to analyze the cardiorespiratory interac-tion since the significance of this topic was deemed high [23,33-41].
The similarities or differences between the definitions of the different techniques and the advantages of each tech-nique are not known yet. Unfortunately, a complete review and a (qualitative and quantitative) comparison of the recent literature is too extensive and beyond the scope of this paper. This study is restricted to the comparison of the performance of six different techniques in the detec-tion of cardiorespiratory coordinadetec-tion. Although the com-parison is limited, the insight that is drawn from it provides valuable information with regard to techniques that are not considered in this comparison. A second aim of this study is to investigate the cardiorespiratory interac-tion during night-time sleep since previous studies only dealt with relatively short recordings (no more than one hour).
Methods
Data acquisition and pre-processing
The electrocardiogram (ECG, standard lead II) and the uncalibrated nasal airflow (derived by a thermistor-tech-nique) were recorded simultaneously in 20 healthy sub-jects (7 female, median age: 34.9 years, interquartile range: 13.7 years) using an ambulatory device (Mediko-rder, Tom-Signal, Graz). In each subject the night-time sleeping period was recorded, in some subjects the com-plete evening before the sleep period was also recorded. Hence, the total recording time varied from 7–16 hours. The device's internal sampling rate of the ECG was 3000 Hz. Thus, the times of the automatically identified R-peaks had an accuracy <1 ms and were written into a file. To save memory, the ECG was recorded using a rate of 250 Hz. The data were transferred to a PC and analyzed using Matlab (The Mathworks, Natick, Mass, USA) and C rou-tines. The times of the automatically identified R-peaks were visually controlled, i.e. the times of the R-waves were marked in the ECG, and edited if the times of the auto-matically identified R-peaks did not match the R-peak in the ECG (<0.1% of all peaks). The times of the edited R-peaks had an accuracy of 4 ms because the recorded ECG had a lower sampling rate. Ectopies and artefacts were marked and excluded from the analysis.
necessary and saved into a file. These data served as the basis for further calculations, see Figure 2.
Note that in the following the term 'cardiorespiratory coordination' is used descriptively in the sense that the times of the R-waves and the times of the inspiratory onsets show some kind of temporal incidence. The tem-poral incidence does not imply a physiological coupling between heartbeat and respiration, i.e. 'cardiorespiratory synchronization'.
The first step towards the analysis of cardiorespiratory coordination with respect to different m:n-coordination ratios (m: number of heart beats, n: number of respiratory
cycles) is the calculation of temporal distances between the event markers of the two time series. Generally, two different useful possibilities have to be considered. (1) The temporal distance between inspiratory onsets and successive R-peaks, or, (2) the temporal distance between an inspiratory onset and the preceding R-peak.
1. Temporal distance between inspiratory onsets and suc-cessive R-peaks:
absolute distance: ti = Ri - Ij (1)
2. temporal distance between an inspiratory onset and the preceding R-peak:
absolute distance: tj = Ij - Ri-1 (3)
Note that for the calculation of the absolute distances ti
and n > 1 the appropriate settings of the indices i and j
have to be considered. Furthermore, the relative distance
φi corresponds to a definition of a phase angle of an oscillator on the interval [0, n]. This phase (multiplied by 2π) is equivalent to the cyclic phase calculated via the Hilbert-transformation [32,42]. Similar phases may also be calculated using e.g. the Fourier-transformation [43]. Hence, with respect to the variable φi, the terms 'relative distance' and 'phase' are used synonymously throughout this paper. Compared to φi and ti the calculation of tj and
βj only needs the timings of the R-peaks before and after the inspiratory onset. Thus, these variables contain less information. They have been mainly used in early studies on cardiorespiratory coordination and are not common at present [44,45]. In order to keep this comparison practi-cable, the calculation of the absolute distances tj and the subsequent analysis of these quantities is left out in this study.
In Figure 3 (a) an example of a succession of absolute dis-tances ti is shown, i.e. each point represents the temporal distance of the R-peak to its preceding inspiratory onset (n
= 1). In Figure 3 (b) these distances are calculated for two consecutive respiratory cycles (n = 2). This kind of repre-sentation is known as 'Post Event Time Series' [34,46] and has already been used in some early studies of cardiores-piratory coordination [26]. Since n = 1 in Figure 3 (a), the structures of parallel horizontal lines reveal 4:1- and 3:1-coordination (see marked points). In Figure 3 (b) the arrows indicate 7:2-, 8:2- and 6:2-coordination because n
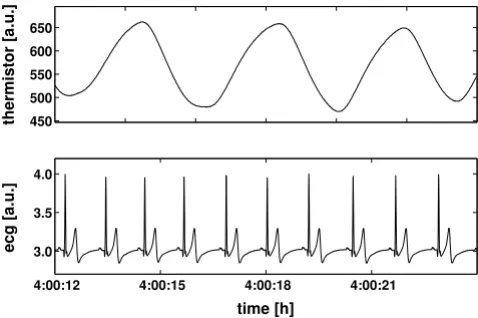
= 2 was used for the calculation of the distances. Figures 3 Example of the recordings
Figure 1
Example of the recordings. Example of a short sequence of the simultaneously recorded electrocardiogram (ecg) and respiratory trace (thermistor) during night time sleep.
Relevant data in the recordings
Figure 2
Relevant data in the recordings. The times of the R-peaks Ri and the times of the inspiratory onsets Ij (defined as
local minima in the respiratory trace) derived from the recordings serve as event markers for further calculations.
450 500 550 600 650
thermistor [a.u.]
4:00:12 4:00:15 4:00:18 4:00:21 3.0
3.5 4.0
ecg [a.u.]
time [h]
4:00:12 4:00:15 4:00:18 4:00:21 R
i−4 Ri−3 Ri−2 Ri−1 Ri Ri+1 Ri+2 Ri+3 Ri+4 Ri+5
Ij−1 Ij Ij+1 Ij+2
time [h]
relative distance: ϕi i j
j j
R I
I I j n
= −
− +
+1 mod
( )
2relative distance:βj j i
i i
I R
R R
= −
−
( )
− −
1 1
(c) and 3 (d) show the relative distances φi of the same sequence for n = 1 and n = 2 respiratory cycles, respec-tively. This kind of representation is called 'Synchrogram' [19]. Obviously, it shows structures of parallel horizontal lines for the same epochs as the absolute distances ti (see markers in Figure 3). The structures with horizontal lines reveal epochs in which absolute distances ti or relative
dis-tances φi, respectively, of each m-th R-peak recurs after one (n = 1) or two (n = 2) respiratory cycles: the cardiotory interaction is coordinated. If the number of respira-tory cycles n is increased (n > 2) these m:n-coordination may be observable in the same manner. In Figure 3 (e) the relative distances βj for the same sequence are shown. As mentioned above, this diagram contains less information compared to the other diagrams. Still, in the case of cardi-orespiratory coordination, a short horizontal structure appears, cf. the markers in Figure 3 (e). These structures show the presence of m:1-coordination, similar to the dia-grams in Figure 3 (a) and 3 (c).
The fact that cardiorespiratory coordination is present if structures with horizontal lines occur leads to the task of detecting these structures in the different diagrams. This task can be carried out by different techniques based on mathematical models or heuristic approaches. Some rele-vant approaches are described in the following.
Detection of horizontal structures in Synchrograms or Post Event Time Series
1. Detection via 'Synchronization-λ'
Along with the development of the Synchrogram a quan-tification on the basis of a mathematical model has been proposed [32,47,48]. Consider two coupled oscillators with appropriately defined phases φ1 and φ2 that may intermittently show a 1:1-synchronization (for simplicity both phases are defined on the interval [0, 2π]). In the synchronized case the difference φ1 - φ2 is constant. In real world data the phases φ1 and φ2 are contaminated by noise. Thus, even during synchronization the difference φ1 - φ2 is not constant. Rather it fluctuates around a constant. To take these influences into account a 'stroboscopic tech-nique' has proven to be useful. Each time the phase φ1 exceeds a pre-defined value θ the phase φ2 is registered. During a synchronization the different values of φ2 are almost constant whereas during complete de-synchroni-zation φ2 spreads equally over the interval [0, 2π]. This approach may easily be generalized for m:n -synchroniza-tion if the phases φ1 and φ2 are replaced by φ1/m and φ2/n. The distribution of φ2 may be quantified by the first Fou-rier mode.
The formalization of this idea is as follows: Observe the phase φ2 at the times t the phase φ1 is φ1= θ :
Next, calculate the first Fourier mode of the distribution of
ξi which is known as circular variance [49] (M values of φ2 have been observed):
If both oscillators are synchronized λ = 1, the completely de-synchronized case yields λ = 0. To get a more reliable result, λ may be calculated for different values of θ and subsequently averaged.
This method is easily applicable to the detection of cardi-orespiratory coordination. Define the phases φ1,2 as fol-lows: φ1 increases linearly on the interval [0, 2π] between two successive R-peaks and φ2 between two successive inspiratory onsets, respectively. To detect coordination for different n:m-ratios this method has to be applied for each desired m:n-ratio. In practice, coordination is present if λ exceeds a pre-defined threshold λ ≥thresλ. In this case the
respective R-peaks are marked as coordinated.
Note that although this method deals with synchroniza-tion of two coupled oscillators it is not able to detect car-diorespiratory synchronization in a physical sense. A detection of synchronization on the basis of two simulta-neously recorded time series would require supplemen-tary information, e.g. the variation of the strength of coupling. Such supplementary information is not availa-ble for the cardiorespiratory interaction. Thus, the term cardiorespiratory coordination denotes a temporal inci-dence of events in both time series without claiming that this incidence is based on a coupling between both systems.
In this study, the window length M is set to M = 20. To obtain a better time resolution of the λ-values the window is forwarded one R-peak or accompanying phase, respec-tively. To obtain more stable values of λ the average of 10 different values of θ, equally distributed over the interval [0, 2π], is used. The threshold is set to thresλ= 0.85. This procedure is successively carried out for the following
m:n-coordinations: for n = 1: m = 2,...,8 and for n = 2: m = 5,7,9,11,13,15.
2. Detection via 'Phase Recurrences'
This method is based on a heuristic approach. Consider a synchrogram containing a sequence with m parallel hori-zontal lines indicating a m:n-coordination. In this sequence the relative distance φi of each m-th R-peak has to be approximately the same. Otherwise parallel ξi =ϕ2( )t ϕ1( )t=θ.
( )
5λ2 ξ ξ
2 1
2 2
1
2
1 1
6
=
+
( )
= =
∑
∑
M j j M
M
j j
M
Example of cardiorespiratory coordination
Figure 3
Example of cardiorespiratory coordination. (A) and (B) show examples of a 'Post Event Time Series' for 1 and 2 respira-tory cycles, respectively. The corresponding 'Synchrograms' are shown in (C) and (D). (E) depicts the 'Synchrogram' for phases
βj. In (A) and (C) the arrows indicate a sequence with 4:1- and a sequence with 3:1-coordination. In (B) and (D) the arrows point to sequences with 7:2-, 8:2- and 6:2-coordination. The arrows in (E) indicate sequences with coordinated inspiratory onsets that correspond to the coordinated sequences in (A) and (C).
A B
23:54
0
23:57
0:00
1
2
3
4
time [h]
t
ir,
i[s
]
23:54
0
23:57
0:00
2
4
6
8
time [h]
t
ir,
i[s
]
C D
23:54
23:57
0:00
0.0
0.2
0.4
0.6
0.8
1.0
time [h]
M
i23:54
23:57
0:00
0.0
0.5
1.0
1.5
2.0
time [h]
M
iE
23:54
23:57
0:00
0.0
0.2
0.4
0.6
0.8
1.0
horizontal lines would not appear. This 'recurrence of phases' may be used to identify coordinated sequences [36] (a slightly different approach is presented in [50]).
The formalization of this concept is straightforward. For a
m:n-coordination check whether the phase difference between the phase of R-peak i + m and the phase of R-peak
i is within a pre-defined tolerance ε. This condition has to be fulfilled for at least k successive R-peaks:
Nr is the total number of R-peaks. In principle, the param-eter k is not pre-defined. But, to be compatible with the description of 'parallel horizontal lines' during coordina-tion, k ≥m needs to be fulfilled. This procedure allows a detection of a structure of parallel horizontal lines already with a length of 2m successive relative distances φi. E.g. a 4:1-coordination may be identified already in a minimal sequence of 8 R-peaks. In the case coordination is detected, the respective R-peaks are marked as coordi-nated. To detect horizontal structures for different m:n -ratios this method has to be applied for each ratio. It is easy to implement and it can be used for absolute dis-tances ti analogously.
In this paper the Phase Recurrence is analyzed with respect to absolute distances ti and relative distances φi for the fol-lowing m:n-coordinations: n = 1: m = 2,...,8 and n = 2: m = 5,7,9,11,13,15. In the case of absolute distances ti the tol-erance ε is set to ε = 0.075, i.e. 75 ms, and in the case of relative distances φi the tolerance is set to ε = 0.025.
3. Detection via 'Quantification of Histograms'
Another technique to detect cardiorespiratory coordina-tion makes use of a sliding window comprising nF succes-sive phases φi that is moved over the entire series of phases [34,46]. First, a distribution of the phases φi is calculated for each window. If cardiorespiratory coordination, i.e. a structure with parallel horizontal lines, is present the dis-tribution of phases φi shows some distinct equidistant local maxima (e.g. four local maxima in the case of 4:1 coordination). In the un-coordinated case the phases φi are randomly distributed and local maxima do not appear. Next, each distribution is quantified by means of a Fourier Transformation. In the case of coordination, the distribution of the phases φi contains several local maxima
resulting in a huge maximum in the power spectrum. In the un-coordinated case the power spectrum does not contain any pronounced maximum since the phases φi are equally distributed. Thus, the appearance of pronounced local maxima in the power spectrum is used to detect car-diorespiratory coordination.
This idea may be formalized as follows [46]. First, choose the length nF of the sliding window and the number of bins k to calculate the distribution. In the completely un-coordinated case the value of each bin xl is nF/k. If a perfect
m:n-coordination is present the following distribution is obtained:
Here, l0 is the index of the bin that contains the first local maximum of the distribution. This distribution is quanti-fied by means of a Fourier transformation:
The average of all bins nF/k is subtracted from each bin to avoid a dc-component in the power spectrum. In the un-coordinated case Px(f) = 0 for all frequencies f. In the case
of a m:n-coordination m local maxima at the frequencies f
= a m, a ≤ k/(2m) appear. These local maxima are con-served even if the parallel horizontal lines are not exactly mapped into m bins but also some surrounding bins are filled. Thus, the distinction between coordinated and un-coordinated cardiorespiratory interaction may be carried out using the difference between the maximum and the minimum of the power spectrum.
diff(Px) = max(Px) - min(Px) (10)
In the coordinated case this difference is large whereas in the un-coordinated case the difference is small. In prac-tice, the R-peaks in the analyzed window are being marked as coordinated if diff (Px) exceeds a pre-defined threshold, i.e. if diff (Px) ≥thresF. This procedure may anal-ogously be applied to absolute distances ti.
Practically, as a compromise between the temporal resolu-tion and a practicable estimaresolu-tion of the distriburesolu-tion, the window length is set nF = 20 and the window is forwarded 1 R-peak each time. The distribution has a bin-width of 0.1 sec for absolute distances ti and 0.025 for phases φi, the number of bins k is adjusted accordingly. The threshold for identifying coordination is set to thresF = 12 for both, absolute distances ti and phases φi. Notice that this imple-mentation does not require a pre-selection of the integers
m and n of a m:n-ratio.
4. Detection via 'Quantification of the distribution of inspiratory onsets in RR-intervals'
In this study, the relative distances βj are also analyzed. They were used in the early studies of the 1960ies and in the subsequent studies of these research groups [25,27-29]. Although this technique does not use all the
informa-∃ >k 1 ϕi m+ −ϕi <ε, i∈{l,...,l+ −k 1 0| ≤ <l Nr− +k 1}. ( )7
∃ = ∈{ + } = −
( )
k l,0 xl nF/m l (l0 n m kz/ ) mod ,k z 0,...,m 1
0 8
if else
P f
k x
n
k e
x l F ifl k
l k
( )= − /
( )
− =
−
∑
1
9 2
0 1
tion available in the recording it is successfully used at present by one research group [44,51-53]. It has to be kept in mind that this technique yields coordinated inspiratory onsets instead of coordinated R-peaks. Thus, in order to get results which are comparable with the previously described techniques, the coordinated inspiratory onsets are replaced by peaks with the following rule: all R-peaks in a respiratory cycle that follow a coordinated inspiratory onset are marked as coordinated.
The quantification of the distribution of βj is carried out as follows. Since the values of βj are in the interval [0,1] they
may be mapped onto the interval [0,2π] by multiplication with 2π. In this study, the distribution of βj in a data win-dow of length nF is quantified by the calculation of the first Fourier mode of the distribution (the circular variance):
Analogously to the 'Synchronization-λ' defined above, the range of γ is 0 ≤γ ≤ 1. If γ = 0 βj is equally distributed indi-cating the completely de-coordinated case. If γ = 1 the βj is constant in the data window indicating the coordinated case. Practically, the inspiratory onsets in a data window are marked as being coordinated if γ ≥ thresγ.
Subse-quently, the R-peaks in the respiratory cycle that follow a
coordinated inspiratory onset are marked as coordinated. The window length nF is set to 10 and thresγ= 0.5. The data window is forwarded one inspiratory onset to achieve the maximal temporal resolution.
Quantitative comparison of the methods, Statistics The goal of the study was to compare quantitatively the results of the different techniques to analyze cardiorespi-ratory coordination. This was achieved in two steps. In the first step the cardiorespiratory coordination of each recording was analyzed with the following techniques: (1) 'Synchronization-λ', (2) 'Phase Recurrence' of relative dis-tances φi, (3) 'Phase Recurrence' of absolute distances ti, (4) 'Quantification of Histograms' of relative distances φi, (5) 'Quantification of Histograms' of absolute distances ti, and (6) 'Quantification of Distribution of relative dis-tances βj'. The detected R-peaks in horizontal structures,
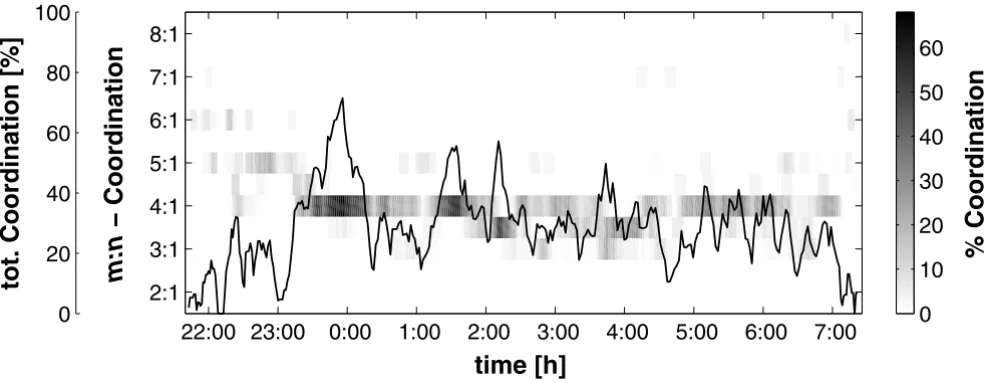
i.e. coordinated R-peaks, are marked with their corre-sponding number m of the m:n-ratio (e.g. all R-peaks in a sequence of 4:1 coordination were marked with 4). This allowed the distinction of coordinated R-peaks with respect to their m:n-ratio. Next, to reduce the amount of information, the percentage of coordinated R-peaks with a certain m:n-ratio in a window of 500 consecutive R-peaks was calculated. To get an adequate temporal resolu-tion, the window was forwarded by 100 R-peaks until the entire series of R-peaks is covered. The percentage of coordinated R-peaks was coded as a greyscale plot because Example of a 'coordination diagram'
Figure 4
Example of a 'coordination diagram'. The 'coordination diagram' shows the course of the relative number of coordinated R-peaks (in a window of 500 R-peaks) at their respective m:n-ratio (method: 'Phase recurrences'). In this examples the 4:1-coordination prevails. The absolute maximum of 68% of coordinated R-peaks turns up at about midnight. The line in the dia-gram depicts the 'total coordination', i.e. the amount of coordination regardless of the m:n-ratio. Obviously, the cardiorespira-tory coordination seems to oscillate.
0
20
40
60
80
100
tot. Coordination [%]
% Coordination
0
10
20
30
40
50
60
time [h]
m:n
− Coordination
22:00 23:00 0:00
1:00
2:00
3:00
4:00
5:00
6:00
7:00
2:1
3:1
4:1
5:1
6:1
7:1
8:1
γ2 πβ πβ
1
2
1
2
1
2 1 2 11
=
+
(
= =
∑
∑
nF k k n
n
F k k
n
F F
the percentage was plotted versus time for all analyzed
m:n-ratios. This plot is called 'coordination diagram' (see Figure 4). In this diagram the amount of cardiorespiratory coordination and its respective m:n-ratio is easily accessible.
The total number of coordinated sequences and the total number of coordinated R-peaks during night-time sleep, i.e. from 0:00 to 6:00 assuming that all subjects were con-tinuously asleep, served as quantitative measures of the performance of each method. They were calculated for each recording. Furthermore, the matrix of Pearson's correlation coefficients r between the coordination dia-grams of the six methods was obtained as follows. Each correlation is calculated comparing the percentages of coordinated R-peaks with a m:n-ratio of two different methods for each data window. Furthermore, to enhance the validity of this comparison, only those pairs of per-centages are used in which at least one percentage is greater than zero. Otherwise the large number of pairs with (0%,0%), i.e. the white area that both coordination diagrams have in common, would lead to a strong corre-lation even if the other parts of the coordination diagrams show apparent divergent m:n-coordination ratios.
Results
An example of a 'coordination diagram' is shown in Figure 4. This example was analyzed with the method of 'Phase Recurrences' of relative distances φi. Since the heart rate decreases during night-time sleep whereas the respiratory rate remains almost constant the m:n-ratios of cardiorespi-ratory coordination also decrease during this period. Thus the sleeping period may be estimated from the 'coordina-tion diagram' by looking at the low m:n-ratios. In the example, the subject slept from 23:30 to 6:30 and had a predominant 4:1-coordination during night-time sleep. At midnight the maximum of approximately 68% is reached, i.e., 68% of all peaks in a window of 500 R-peaks showed a 4:1-coordination with respect to respira-tion. A second local maximum of 4:1-coordination is observable at 1:30. The rest of the night shows sequences with 4:1-, 7:2- (shown in between 4:1- and 3:1-coordina-tion) and also some 3:1-coordination. Although not
shown, it has to be added that qualitatively similar results were obtained with the other techniques. Furthermore, the analysis of the other subjects showed that the predom-inant m:n-coordination ratio during night-time sleep of each subject varies inter-individually and is one of the fol-lowing ratios: 3:1, 4:1, 5:1, 7:2 or 9:2.
The additional line drawn in the coordination diagram represents the 'total coordination', i.e., the percentage of coordinated peaks in a window of 500 consecutive R-peaks regardless of the m:n-ratio. As indicated by the time course of the separate m:n-coordinations the total coordi-nation is not constant or a simple function of time. Instead, the total coordination seems to oscillate. In the course of the night-time sleep the frequency of the oscilla-tion increases whereas the amplitude decreases. Similar qualitative results were obtained using the other techniques.
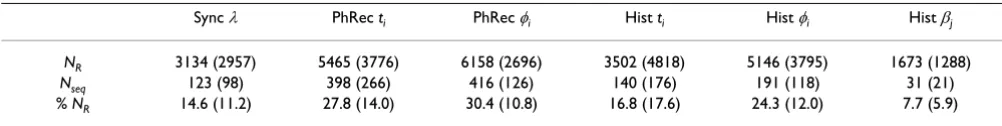
The total number of coordinated R-peaks NR and the total number of coordinated sequences Nseq during night-time sleep contain important quantitative information about the performance of the different methods (see Table 1). The group's median total number of coordinated R-peaks ranges from NR = 1673 R-peaks for the 'Quantification of inspiratory onsets in RR-intervals' (Hist βj) to NR = 6158 R-peaks for the detection via 'Phase Recurrences' of phases
φi (PhRec φi), i.e. 7.7% to 30.4% of the total number of R-peaks during night-time sleep are coordinated with respi-ration. The 'Phase Recurrences' of times ti and the 'Quan-tification of Histograms' of phases φi also detect a high number of coordinated R-peaks during night-time sleep (NR = 5465 and NR = 5146, respectively). Notice that the number of coordinated sequences is highest for the 'Phase Recurrences' (Nseq = 416 for relative distances and Nseq =
398 for absolute distances) compared to other methods. Hence, the coordinated sequences detected by the 'Phase Recurrences' are shorter than the sequences detected by other methods. Although not shown, it has to be added that the high number of coordinated sequences and R-peaks for the 'Phase Recurrences' is due to the setting k ≥ m for equation (7). If this setting is changed to k ≥ m + 8, i.e. the requirement |φi - φi+m| <ω has to be fulfilled at least Table 1: Number of detected sequences with cardiorespiratory coordination. Median and inter-quartile range during night-time sleep of the following parameters: NR total number of coordinated R-peaks, Nseq total number of coordinated sequences, % NR relative
amount of coordinated R-peaks with respect to the total number of R-peaks.
Sync λ PhRec ti PhRec φi Hist ti Hist φi Hist βj
NR 3134 (2957) 5465 (3776) 6158 (2696) 3502 (4818) 5146 (3795) 1673 (1288)
Nseq 123 (98) 398 (266) 416 (126) 140 (176) 191 (118) 31 (21)
m + 8 times, the median number of coordinated epochs decreases to Nseq = 206 and the median number of coordi-nated R-peaks decreases to NR = 4273.
An example of the correlation between the coordination diagrams of the different methods is shown in Figure 5. For this subject the correlation coefficient r ranges from r
= 0.63 to r = 0.91 indicating a good agreement between the different coordination diagrams. The coordination diagrams for 'Synchronization-λ' and 'Quantification of Histograms' of relative distances φi correlate strongest (r = 0.91). And also the coordination diagrams for 'Phase Recurrence' of absolute distances ti and 'Phase Recurrence' of relative distances φi show a strong correlation (r = 0.90).
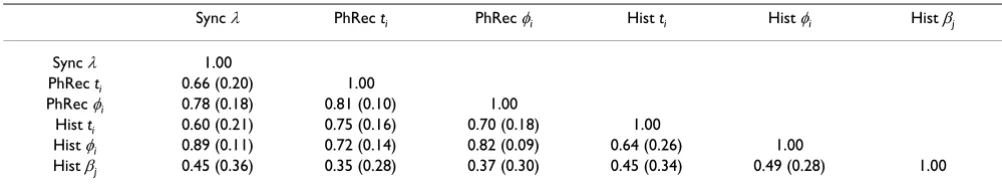
The matrix of correlation coefficients was calculated for each subject. Table 2 lists the median and the interquartile range of each item in the matrix. Again, the results of the analysis of the 'Synchronization-λ' and the 'Quantifica-tion of Histograms' of relative distances φi correlate strongest (median correlation r = 0.89), followed by the correlation between the 'Phase Recurrences' and the 'Quantification of Histograms' of relative distances φi (r = 0.82) and the correlation between the 'Phase Recurrences' of relative distances φi and the 'Phase Recurrences' of abso-lute distances ti (r = 0.81). In all rows of the matrix except the last the correlation coefficients are r > 0.64 indicating a strong correlation between results of the different tech-niques. Since all correlation coefficients in the last row are Example of the correlations between the different methods
Figure 5
Example of the correlations between the different methods. Example of the correlations between the different meth-ods to detect cardiorespiratory coordination.
Hist
β
j
Sync
λ
0.80
0.87
PhRec t
i0.90
0
50
100
% of coordinated R−peaks
0.79
0.71
PhRec
ϕ
i
0.72
0.91
0.82
0.87
Hist t
i0.80
0.72
0.63
0
50
100
% of coordinated R−peaks
0.67
0.68
Hist
ϕ
i
r < 0.5 the correlation between the results of the 'Quanti-fication of inspiratory onsets in RR-intervals' (Hist βj) and
all other techniques is weaker.
Discussion
In recent years a variety of different methods have been proposed to detect cardiorespiratory interaction on the basis of simultaneously recorded time series of heart beat and respiration. In this study, six different methods to identify cardiorespiratory coordination based on mathematical models or heuristic approaches have been quantitatively compared. The main issue of the different methods is the recognition of coordination in synchro-grams and post event time series, i.e. the detection of structures with horizontal lines in these representations. Thus, the procedures permit the quantification of qualita-tive information that is contained in these representations and may provide new information that is not extractable from the isolated univariate time series.
The quantitative comparison of the six different methods to detect cardiorespiratory coordination showed that the group's median total number of coordinated R-peaks and the median total number of coordinated sequences varied depending on the detection method used. The largest number of coordinated R-peaks (30.4% of all R-peaks during night-time sleep) and coordinated sequences was detected by the 'Phase Recurrences' of phases φi. Since the coordinated R-peaks are distributed in the largest number of coordinated sequences this method has the best tempo-ral resolution compared to all other methods used in this study. Furthermore, it is able to detect even very short and intermittent cardiorespiratory coordination because the implementation used in this study only required at least 2m R-peaks to detect a m:n-coordination (typically, m = 2,3,...,8). But, if the minimal number of required coordi-nated R-peaks is increased to e.g. 2(m + 8), this method shows approximately the same number of coordinated epochs and R-peaks as e.g. the 'Quantification of Histo-grams'. Hence, if the 'window length' of this method is increased, the results are similar to those of the methods with a window length of 20 R-peaks. Since the 'Phase
Recurrences' of absolute distances ti also showed a large number of coordinated R-peaks and coordinated sequences, respectively, and the correlation to the results of the 'Phase Recurrences' of phases φi is strong, these procedures showed approximately the same characteristic features. All other methods were less sensitive in the detec-tion of cardiorespiratory coordinadetec-tion because the identi-fication of cardiorespiratory coordination required a minimal window length of 20 R-peaks. The method of 'Quantification of inspiratory onsets in RR-intervals' had an even longer window length, provided that the window length of 10 inspiratory onsets is equivalent to approxi-mately 40 R-peaks since the average ratio of heart rate and respiratory rate, irregardless of any cardiorespiratory coordination, is 4 [35]. Thus, these methods are not as suitable for the detection of cardiorespiratory coordina-tion as the method of 'Phase Recurrences'. Nevertheless, although all methods had different definitions and differ-ent implemdiffer-entation details, they revealed similar qualita-tive features of cardiorespiratory coordination during night-time sleep, i.e., the coordination diagrams showed approximately the same structure and the 'total coordina-tion' (percentage of all coordinated R-peaks regardless of the m:n- ratio) was not constant but oscillated during night-time sleep. Since this oscillation correlates with heart rate variability (HRV) [36] and different sleep stages also correlate with HRV [54,55], this oscillation may have its origin in the sleep architecture.
Another quantitative comparison was carried out by intra-individually correlating the 'coordination diagrams' of each method. The correlation coefficients served as a measure of similarity between the different diagrams. The strongest correlation was observed between the coordina-tion diagrams derived from the 'Synchronizacoordina-tion-λ' and the 'Quantification of Histograms' of relative distances φi. Furthermore, the 'Phase Recurrences' of relative distances
φi and of absolute distances ti correlated strongly. These results indicate that the amount of information contained in the relative distances φi, i.e. the relative timings of the R-peaks in a full respiratory cycle, and in the absolute distances ti, i.e. the timings of R-peaks with regard to the Table 2: Correlations between the different methods to detect cardiorespiratory coordination. Median and inter-quartile range of the correlations coefficients between the different methods to detect cardiorespiratory coordination.
Sync λ PhRec ti PhRec φi Hist ti Hist φi Hist βj
Sync λ 1.00
PhRec ti 0.66 (0.20) 1.00
PhRec φi 0.78 (0.18) 0.81 (0.10) 1.00
Hist ti 0.60 (0.21) 0.75 (0.16) 0.70 (0.18) 1.00
Hist φi 0.89 (0.11) 0.72 (0.14) 0.82 (0.09) 0.64 (0.26) 1.00
preceding inspiratory onset, was approximately the same. Furthermore, the results of the 'Synchronization-λ' showed strong correlations to the 'Phase Recurrences' and the 'Quantification of Histograms'. Thus, the latter meth-ods, which have heuristic origins, may also be explained mathematically by the mathematical models used to develop the method of 'Synchronization-λ'. However, the correlation coefficients concerning the 'Quantification of Histograms' of relative distances βj, i.e. the relative timing of an inspiratory onset in the respective RR-interval, were lower. Thus, these distances seem to contain different information. This difference is attributed to the fact that the calculation of the relative distances βj is not based on the full amount of information available in the recording.
Taken these findings together, it is apparent that the dif-ferent methods may lead to similar results if the maxi-mum amount of information is used. It is important to keep in mind that all quantifications are based on the 'Post Event Time Series' or the 'Synchrogram'. Thus, although some methods have heuristic origins and some have a mathematical model as its origin and although the different approaches differ considerably with respect to their calculations, the relevant information of the 'Post Event Time Series' and the 'Synchrogram' is captured by the different methods.
A debate exits whether the cardiorespiratory coordination is due to physiological interaction between the involved systems or other mechanisms might be responsible, like e.g. a reduced variability in at least one of the involved sys-tems [36,56]. Surrogate data have been used to give at least a quantitative answer to this debate [34,38,57]. The analysis of surrogate data suggests that cardiorespiratory coordination is sometimes due to some kind of physio-logical interaction. Another approach that may be of importance is the stochastic phase synchronization, i.e. the synchronization between coupled systems due to sto-chastic stimuli [58,59]. However, this kind of mechanism has not been explored for the cardiorespiratory system and the implications are not clear yet. Irrespective of this debate, it is an intriguing phenomenon that heart rate and respiratory frequency show a 4:1-ratio on average during night-time sleep [35,60]. The present results also indicate that there seem to be some constraints with respect to var-iability and other features of the involved systems to achieve certain m:n-ratios. Further methods and models have to be developed to explore these features of the car-diorespiratory system.
In conclusion, the different methods to detect cardiorespi-ratory coordination show similar qualitative results. The method 'Phase Recurrences' has the ability to detect most sequences of heart beats coordinated with respiration. It is able to maximize the temporal resolution because even
very short sequences may be detected. Thus, this method should be preferred. The method of 'Quantification of Histograms' of relative distances βj contains different quantitative information since only parts of the full amount of information available is used. Hence, this method is not recommended because a comparison with the other methods is limited. Generally, using appropriate methods, cardiorespiratory coordination is detectable in approximately 20–25% of all heart beats during night-time sleep. Future work should focus on the prerequisites of the appearance of cardiorespiratory coordination dur-ing night-time sleep and whether this appearance is linked to sleep stages. Furthermore, a preliminary study has shown the loss of cardiorespiratory coordination in patients after acute myocardial infarction [61,62]. Hence, the gain of prognostic information of this bivariate analy-sis should be explored further.
Authors' contributions
DC and HB designed the study, recruited the subjects and collected the data. DC carried out the analysis and drafted the manuscript. SL, DG and PvL were involved in the interpretation of the data and participated in the final revision.
Acknowledgements
DC and HB acknowledge financial support from the Weleda AG, Schwä-bisch Gmünd, Germany. The authors would like to thank Roland Zerm and Matthias Kröz for providing data.
References
1. Task Force of the European Society of Cardiology and the North American Society of Pacing and Electrophysiology: Heart rate vari-ability: standards of measurement, physiological interpreta-tion, and clinical use.Circulation 1996, 93:1043-1065.
2. Pincus S, Cummins TR, Haddad GG: Heart rate control in normal and aborted-SIDS infants.Am J Physiol 1993, 264:R638-R646. 3. Pincus SM: Approximate entropy in cardiology. Herzschr
Elektrophys 2000, 11:139-150.
4. Pincus S: Approximate entropy (ApEn) as a complexity measure.Chaos 1995, 5:110-117.
5. Wessel N, Schirdewan A, Malik M, Voss A: Symbolic dynamics – an independent method for detecting nonlinear phenomena of heart rate regulation. Biomed Tech (Berl) 1998, 43(Suppl):510-511.
6. Wessel N, Ziehmann C, Kurths J, Meyerfeldt U, Schirdewan A, Voss A: Short-term forecasting of life-threatening cardiac arrhythmias based on symbolic dynamics and finite-time growth rates.Phys Rev E Stat Phys Plasmas Fluids Relat Interdiscip Topics 2000, 61:733-739.
7. Wessel N, Voss A, Kurths J, Schirdewan A, Hnatkova K, Malik M: Evaluation of renormalised entropy for risk stratification using heart rate variability data. Med Biol Eng Comput 2000, 38:680-685.
8. Ashkenazy Y, Ivanov PC, Havlin S, Peng CK, Goldberger AL, Stanley HE: Magnitude and sign correlations in heartbeat fluctuations.Phys Rev Lett 2001, 86:1900-1903.
9. Peng CK, Havlin S, Hausdorff JM, Mietus J, Stanley HE, Goldberger AL: Fractal mechanisms and heart rate dynamics: Long-range correlations and their breakdown with disease.J Electrocardiol
1995, 28 Suppl:59-65.
11. Akselrod S, Gordon D, Ubel FA, Shannon DC, Berger AC, Cohen RJ: Power spectrum analysis of heart rate fluctuation: a quanti-tative probe of beat-to-beat cardiovascular control.Science
1981, 213:220-222.
12. Makikallio TH, Huikuri HV, Hintze U, Videbaek J, Mitrani RD, Castel-lanos A, Myerburg RJ, Moller M: Fractal analysis and time- and frequency-domain measures of heart rate variability as pre-dictors of mortality in patients with heart failure.Am J Cardiol
2001, 87:178-182.
13. Voss A, Hnatkova K, Wessel N, Kurths J, Sander A, Schirdewan A, Camm AJ, Malik M: Multiparametric analysis of heart rate var-iability used for risk stratification among survivors of acute myocardial infarction.Pacing Clin Electrophysiol 1998, 21:186-192. 14. Porta A, Baselli G, Lombardi F, Montano N, Malliani A, Cerutti S:
Conditional entropy approach for the evaluation of the cou-pling strength.Biol Cybern 1999, 81:119-129.
15. Terry JR, Breakspear M: An improved algorithm for the detec-tion of dynamical interdependence in bivariate time-series.
Biol Cybern 2003, 88:129-136.
16. Baselli G, Cerutti S, Civardi S, Liberati D, Lombardi F, Malliani A, Pagani M: Spectral and cross-spectral analysis of heart rate and artrial blood pressure variability signals.Comput Biomed Res 1986, 19:520-534.
17. Palus M, Komarek V, Hrncir Z, Sterbova K: Synchronization as adjustment of information rates: detection from bivariate time series.Phys Rev E Stat Nonlin Soft Matter Phys 2001, 63:046211. 18. Schäfer C, Rosenblum MG, Kurths J, Abel HH: Heartbeat
synchro-nized with ventilation.Nature 1998, 392:239-240.
19. Schäfer C, Rosenblum MG, Abel HH, Kurths J: Synchronization in the human cardiorespiratory system.Phys Rev E Stat Phys Plas-mas Fluids Relat Interdiscip Topics 1999, 60:857-870.
20. Hoyer D, Hoyer O, Zwiener U: A new approach to uncover dynamic phase coordination and synchronization.IEEE Trans Biomed Eng 2000, 47:68-74.
21. Kotani K, Takamasu K, Ashkenazy Y, Stanley HE, Yamamoto Y: Model for cardiorespiratory synchronization in humans.Phys Rev E Stat Nonlin Soft Matter Phys 2002, 65:051923.
22. Rosenblum MG, Cimponeriu L, Bezerianos A, Patzak A, Mrowka R: Identification of coupling direction: application to cardiores-piratory interaction.Phys Rev E Stat Nonlin Soft Matter Phys 2002, 65:041909.
23. Rzeczinski S, Janson NB, Balanov AG, McClintock PV: Regions of cardiorespiratory synchronization in humans under paced respiration.Phys Rev E Stat Nonlin Soft Matter Phys 2002, 66:051909. 24. Stefanovska A, Haken H, McClintock PVE, Hozic M, Bajrovic F, Ribaric S: Reversible transitions between synchronization states of the cardiorespiratory system.Phys Rev Lett 2000, 85:4831-4834. 25. Stutte KH, Hildebrandt G: Untersuchungen über die Koordina-tion von Herzschlag und Atmung beim Menschen.Pflugers Arch 1966, 289:R47-R48.
26. Pessenhofer H, Kenner T: Method for the continuous measure-ment of the phase relation between heart beat and respiration.Pflugers Arch 1975, 355:77-83.
27. Raschke F: Coordination in the circulatory and respiratory systems. In Temporal disorder in human oscillatory systems Edited by: Rensing L, an der Heiden U, Mackey MC. Berlin: Springer; 1987:152-158.
28. Hildebrandt G: The autonomous time structure and its reac-tive modifications in the human organism. In Temporal disorder in human oscillatory systems Edited by: Rensing L, an der Heiden U, Mackey MC. Berlin: Springer; 1987:160-175.
29. Raschke F: The respiratory system – features of modulation and coordination. In Rhythms in physiological systems Edited by: Haken H, Koepchen HP. Berlin: Springer; 1991:155-164.
30. Rosenblum MG, Pikovsky AS, Kurths J: Phase synchronization of chaotic oscillators.Phys Rev Lett 1996, 76:1804-1807.
31. Rosenblum MG, Kurths J: Analysing synchronization phenom-ena from bivariate data by means of the Hilbert transform. In Nonlinear analysis of physiological data Edited by: Kantz H, Kurths J, Mayer-Kress G. Berlin: Springer; 1998:91-99.
32. Rosenblum MG, Pikovsky AS, Schäfer C, Tass P, Kurths J: Phase syn-chronization: from theory to data analysis. In Neuro-Informatics and Neural Modeling Edited by: Moss F, Gielen S. Amsterdam: Elsevier Science; 2001:279-321.
33. Hoyer D, Bauer R, Walter B, Zwiener U: Estimation of nonlinear couplings on the basis of complexity and predictability – A
new method applied to cardiorespiratory coordination.IEEE Trans Biomed Eng 1998, 45:545-552.
34. Seidel H, Herzel H: Analyzing entrainment of heartbeat and respiration with surrogates. IEEE Eng Med Biol Mag 1998, 17:54-57.
35. Bettermann H, Cysarz D, Van Leeuwen P: Detecting cardiorespi-ratory synchronization by respicardiorespi-ratory pattern analysis of heart period dynamics: the musical rhythm approach.Int J Bifurcat Chaos 2000, 10:2349-2360.
36. Bettermann H, Cysarz D, Van Leeuwen P: Comparison of two dif-ferent approaches in the detection of intermittent cardi-orespiratory coordination during night sleep.BMC Physiol 2002, 2:18.
37. Palus M: Detecting phase synchronization in noisy systems.
Phys Lett A 1997, 235:341-351.
38. Palus M, Hoyer D: Detecting nonlinearity and phase synchroni-sation with surrogate data.IEEE Eng Med Biol Mag 1998, 17:40-45. 39. Janson NB, Balanov AG, Anishchenko VS, McClintock PV: Phase synchronization between several interacting processes from univariate data.Phys Rev Lett 2001, 86:1749-1752.
40. Janson NB, Balanov AG, Anishchenko VS, McClintock PVE: Phase relationships between two or more interacting processes from one-dimensional time series. II. Application to heart-rate-variability data.Phys Rev E Stat Nonlin Soft Matter Phys 2002, 65:036212.
41. Janson NB, Balanov AG, Anishchenko VS, McClintock PVE: Phase relationships between two or more interacting processes from one-dimensional time series. I. Basic theory.Phys Rev E Stat Nonlin Soft Matter Phys 2002, 65:036211.
42. Bracic-Lotric M, Stefanovska A: Synchronization and modulation in the human cardiorespiratory system. Physica A 2000, 283:451-461.
43. Bruns A: Fourier-, Hilbert- and wavelet-based signal analysis: are they really different approaches?J Neurosci Methods 2004, 137:321-332.
44. Galletly DC, Larsen PD: The determination of cardioventilatory coupling from heart rate and ventilatory time series.Res Exp Med (Berl) 1999, 199:95-99.
45. Galletly DC, Larsen PD: Inspiratory timing during anaesthesia: a model of cardioventilatory coupling. Br J Anaesth 2001, 86:777-788.
46. Seidel H: Nonlinear dynamics of physiological rhythms: the baroreflex Ber-lin: Logos; 1998.
47. Mrowka R, Patzak A, Rosenblum M: Quantitative analysis of car-diorespiratory synchronization in infants.Int J Bifurcat Chaos
2000, 10:2479-2488.
48. Tass P, Rosenblum MG, Weule J, Kurths J, Pikovsky AS, Volkmann J, Schnitzler A, Freund HJ: Detection of n:m phase locking from noisy data: application to magnetoencephalography.Phys Rev Lett 1998, 81:3291-3294.
49. Fisher NI: Statistical analysis of circular data Cambridge: Cambridge University Press; 1995.
50. Toledo E, Rosenblum MG, Schäfer C, Kurths J, Akselrod S: Quanti-fication of cardiorespiratory synchronization in normal and heart transplant subjects. In Proc of the Int Symposium on Nonlinear Theory and Its ApplicationsVolume 1. Lausanne: Presses Polytechniques et Universitaires Romandes; 1998:171-174.
51. Galletly DC, Larsen PD: Cardioventilatory coupling during anaesthesia.Br J Anaesth 1997, 79:35-40.
52. Galletly DC, Larsen PD: Relationship between cardioventila-tory coupling and respiracardioventila-tory sinus arrhythmia.Br J Anaesth
1998, 80:164-168.
53. Galletly DC, Larsen PD: Cardioventilatory coupling in heart rate variability: methods for qualitative and quantitative determination.Br J Anaesth 2001, 87:827-833.
54. Versace F, Mozzato M, De Min Tona G, Cavallero C, Stegagno L: Heart rate variability during sleep as a function of the sleep cycle.Biol Psychol 2003, 63:149-162.
55. Elsenbruch S, Harnish MJ, Orr WC: Heart rate variability during waking and sleep in healthy males and females.Sleep 1999, 22:1067-1071.
Publish with BioMed Central and every scientist can read your work free of charge
"BioMed Central will be the most significant development for disseminating the results of biomedical researc h in our lifetime."
Sir Paul Nurse, Cancer Research UK
Your research papers will be:
available free of charge to the entire biomedical community
peer reviewed and published immediately upon acceptance
cited in PubMed and archived on PubMed Central
yours — you keep the copyright
Submit your manuscript here:
http://www.biomedcentral.com/info/publishing_adv.asp
BioMedcentral
57. Toledo E, Akselrod S, Pinhas I, Aravot D: Does synchronization reflect a true interaction in the cardiorespiratory system?
Med Eng Phys 2002, 24:45-52.
58. Bahar S, Moss F: Stochastic phase synchronization in the cray-fish mechanoreceptor'photoreceptor system. Chaos 2003, 13:138-144.
59. Neiman AB, Russel DF: Synchronization of noise-induced bursts in noncoupled sensory neurons.Phys Rev Lett 2002, 88:138103. 60. Hildebrandt G: Reactive modifications of the autonomous
time structure in the human organism.J Physiol Pharmacol 1991, 42:5-27.
61. Leder U, Hoyer D, Sommer M, Baier V, Haueisen J, Zwiener U, Figulla HR: Cardiorespiratory desynchronisation after acute myo-cardial infarction.Z Kardiol 2000, 89:630-637.