World Maritime University
The Maritime Commons: Digital Repository of the World
Maritime University
World Maritime University Dissertations Dissertations
2000
Transport and handling of dangerous cargoes in
port areas : weaknesses of existing international and
Estonian regulations
Tarmo Ots
World Maritime University
Follow this and additional works at:http://commons.wmu.se/all_dissertations Part of theAdmiralty Commons
This Dissertation is brought to you courtesy of Maritime Commons. Open Access items may be downloaded for non-commercial, fair use academic purposes. No items may be hosted on another server or web site without express written permission from the World Maritime University. For more information, please [email protected].
Recommended Citation
Ots, Tarmo, "Transport and handling of dangerous cargoes in port areas : weaknesses of existing international and Estonian regulations" (2000).World Maritime University Dissertations. 243.
WORLD MARITIME UNIVERSITY
Malmö, Sweden
TRANSPORT AND HANDLING OF DANGEROUS
CARGOES IN PORT AREAS:
Weaknesses of Existing International and Estonian Regulations
By
TARMO OTS
Estonia
A dissertation submitted to the World Maritime University in partial
fulfilment of thr requirements for the award of the degree of
MASTER OF SCIENCE
in
MARITIME ADMINISTRATION AND
ENVIRONMENT PROTECTION
2000
FORMAT OF THE DECLARATION
I certify that all the materials in this dissertation that is not my own work has been
identified, and that no material is included for which a degree has previously been
conferred on me.
The contest of this dissertation reflect my own personal views, and are not
necessarily endorsed by the University.
... (Signature)
... (Date)
Supervised by:
Name: Fernando Pardo
Office: professor
World Maritime University
Assessor:
Name: Jan Åke Jonsson
Office: professor
World Maritime University
Co- assessor:
Name: Hans-Jurgen Roos
Office: Harbour Master
ACKNOWLEDGEMENT
My great thanks to Mr. Aarne Oll from the Ministry of Transportation and
Communication who offered me the opportunity to study in the World Maritime
University and who contacted to my sponsor.
I thank my sponsor, the European Commission for providing me financial support to
successfully complete my studies in the university.
My thanks go to Mr.Kirikal and Mr Vainu from the Pakterminal and Mr Petter, Mr
Peips and Mr. Prikk from the Neste terminal who introduced me their everyday
work.
I am grateful to professor F. Pardo for his review of the content of this research paper
and comments he has provided to the author.
I would like to thank the wonderful English teacher Ms D. Sam for these sleepless
hours she spent reading to my dissertation.
I thank all WMU staff, especially course professor Mukherjee and his team whose
ABSTRACT
Title of Dissertation: Transportation and Handling of Dangerous Cargoes in
Port Areas; The Weaknesses of Existing International
and Estonian Regulations
Degree: MSc
The aim of the dissertation is to introduce different aspects concerning
dangerous cargo, its handling and transportation in port areas. As this topic is wide,
the dissertation covers many areas.
To emphasize the importance of dangerous cargo transportation in world
trade, the overview of quantities of this type of cargo handled in different port all
around the world is given. The author also explains the importance to keep statistics
over movement of dangerous cargo and shows how collected information helps to
increase safety and public awareness.
The definition “dangerous cargo” contains hundreds of substances with
different characteristics. The dissertation explains physical and chemical criteria
which makes handling of these substances dangerous.
To show that dangerous cargo is dangerous, accidents through the history is
described. As during last decades different methods have been worked out to
decrease the risk of possible incidents. The author analyses the role of management,
technology and training in avoidance of accidents. Large part of the dissertation is
dedicated to analyses of the international and national (Estonian) legislation
concerning handling and transport of dangerous goods in port areas. In Estonian
CONTENTS
Declaration i
Acknowledgement ii
Abstract iii
Table of Contents iv
List of Tables viii
List of Charts viii
List of Abbrevitations ix
Chapter 1 .Introduction
1.1 Topic description 1
1.2 Research plan 3
1.3 Difficulties 3
Chapter 2 The danger of hazardous substances and
their possible impacts
5
2.1 Definition of dangerous cargo 5
2.2 The classification of dangerous chemicals 6
2.2.1 Description of classes 7
2.3 Physical and chemical criteria which
makes chemicals dangerous 8
2.3.1 Flammability 9
2.3.2 Vapours 11
2.3.3 Oxygen consumption 13
2.4 Possible impacts of dangerous chemicals 13
2.4.1 Pollution of water and mortality
of fauna and flora 13
2.4.2 Destruction of property 14
2.4.3 Death and serious injuries to human life 14
2.4.4 Negative impact to the economy of the
Chapter 3. The overview of the transportation of dangerous
cargoes in the different part of the world 16
3.1 World statistics 16
3.2 Baltic Sea statistics 20
3.3 Estonian statistics 22
Chapter 4 The role of statistics in the transportation
of dangerous goods 28
4.1 The importance of the statistics 28
4.2 A crisis management map 30
Chapter 5. Accidents and their avoidance 32
5.1 Biggest accidents with dangerous substances,
the statistics of the year 1999 32
5.2 Violations of regulations 34
5.3 Safe running of enterprises with major hazards 36
5.3.1 Identification of hazards 36
5.3.2 Safe and environmental friendly management 37
5.3.3 Technical equipment 39
5.3.4 Training of personnel 42
Chapter 6 International regulations of transporting
and storing of DG 44
6.1 The need for international legislation 44
6.2 History of the legislation 46
6.3 Different international organisations and
their legislation 47
6.3.1 United Nations and its legislation 49
6.3.2 IMO, strengths and weaknesses 50
6.3.3 The European Union,
strengths and weaknesses 51
6.4 IMO legislation, its weaknesses 53
6.4.1 IMDG Code 53
6.5 European Union legislation 56
6.6 Helsinki Comission’s legislation 63
6.7 Memorandum of Understanding for the
Transportation of Dangerous Goods in the Baltic Sea 63
Chapter 7 Estonian legislation of transporting and storing
of dangerous goods 65
7.1 Accidents with dangerous goods in Estonia 65
7.2 Estonia and international organisations and
agreements 66
7.3 Legislative and controlling organisations in Estonia 67
7.4 Existing regulations concerning dangerous goods 68
7.5 Non-conformity in Estonian regulations 68
7.6 Violations of existing rules 72
7.6.1 Violations of regulations related to transport of
dangerous cargo to/ from ports by sea and by land 72
7.6.2 Violations of regulations related to
advanced notices 74
7.6.3 Violations related to regulations concerning
safety adviser 76
7.7 Main targets 77
Chapter 8 Conclusion 79
References 81
Annex 1 Summary of chemicals transported in the Baltic Sea 87
Annex 2 Overview of packed dangerous goods transported in 90
the Baltic Sea
Annex 3 Overview of packed dangerous goods transported 91
on ferry lines in the Baltic Sea
Annex 4 List of enterprises liable to be affected
Annex 5 Survey how well people recognise dangerous
cargo placards 93
Annex 6 List of accident happen during the handling and
transport of dangerous goods in ports in 1999 96
Annex 7 List of Helsinki Commission’s Recommendations 100
Annex 8 List of existing Estonian regulations concerning
dangerous goods 101
Annex 9 Examples of three non- unified record lists in Estonia 103
Annex 10 Example of agreement on sea transport between
LIST OF TABLES
Table 1 Flammable range of different types of oils 10
Table 2 Different densities of oil and its products relative to air 12
Table 3 Main oil ports in the USA and their throughput in 1998 18
Table 4 Approximate annual number of dangerous cargo
movement in Canada 18
Table 5 Biggest oil ports in Europe and their throughput in 1998 20
Table 6 Total quantity and number of parcels containing dangerous
goods per class transported in the Baltic Sea 21
Table 7 Main chemicals in packed form imported to Estonia 23
Table 8 Main chemicals in packed form exported from Estonia 24
LIST OF CHARTS
Chart 1 The fire triangle 9
Chart 2 The division of world seaborne trade 17
Chart 3 Biggest oil ports in the Baltic Sea 22
Chart 4 Historical overview of liquid bulk cargo transport
development in the ports of the “Port of Tallinn” 25
Chart 5 Different oil terminals’ throughput in the “Port of Tallinn” 26
Chart 6 Throughput of oil in million tonnes in the “Pakterminal” 26
LIST OF ABBREVIATIONS
ADR European agreement concerning the international carriage of
dangerous goods by road
MOU Memorandum of Understanding
BC Code Bulk Cargo Code
CAS Chemical Abstract Service
CMI Comittee Maritime Internationale
EINECS European Inventory of Existing Commercial Chemical
Substance
ELINICS European List of Notified Chemical Substance
EU European Union
HCB Hazardous Cargo Bulletin
HNS Hazardous Noxious Substances
ILO International Labour Organization
IMDG Code International Maritime Dangerous Goods
IMO International Maritime Organization
ISGOTT International Safety Guidline of Oil Tankers& Terminals
LPG Light Petrol Gas
MARPOL International Convention for the Prevention of Pollution from
Ships
MEPC Marine Environment Protection Committee
OTIF Intergovernmental Organization for Interntional
RID Regulations concerning the international carriage of dangerous
goods by rail
SAFIR Safety and Improvement Reporting System
STCW International Convention on Standards of Training,
Certification and Watchkeeping for Seafarers
TEU 20-feet container
UN United Nations
UNCTAD United Nations Conference on Trade and Development
VOC Volatile organic compounds
CHAPTER 1
INTRODUCTION
1.1 Topic description
By its nature, shipping, especially transport of harmful cargoes, can be called
the second most dangerous industry after the nuclear power industry (Rawson, 1994).
Only vessels have the capability to dump half a million tonnes of dangerous liquid
substances into the sea with a single accident which can cause both environment
catastrophe and death of tens or even hundreds of people. In 1998, five billion tonnes
of cargo was carried by ships around the world. According to the IMO,
approximately 50% of these goods can be classified as hazardous. 100 thousand
chemical substances are defined as dangerous which, if wrongly handled, can cause
death of people, environmental disaster or destruction of property. It is impossible to
predict the impact of the accidents with dangerous substances as all chemicals
behaving depend on their characteristics, quantity and weather conditions.
A port is an area where people should take into consideration the danger of
transport, handling and storing dangerous cargo. It is a place where not only large
quantities, but also different substances, are stored which if mixed may be induce
accidents. As port is a meeting point of different modes of transportation then both
land and sea transport safety regulations must be taken very carefully into
consideration. History shows that there is a need to do that. The five of ten biggest
man- made explosions happened in port areas (Compton, 1999). According to
statistics most maritime accidents related to dangerous cargo happen in harbours.
Estonian ports play quite a significant role in liquid dangerous cargo
shipments in the Baltic Sea area being a link between Russia and the world. Estonia
quickest way between northern Scandinavia and the Baltic States. Estonian ports are
mainly transhipment ports. It means the cargo moves to and from the other states by
rail and road. The use of intermodal transport makes important not to follow only
regulations specified to maritime but also to land transport. In addition to the
economic importance, the Baltic Sea is a unique water area in the world where
freshwater and marine organisms live side by side. Even a medium size chemical or
oil spill can cause long term pollution with severe consequences as water exchange
between the Baltic Sea and the North Sea takes 35 years (Liiv& Marksoo, 1998). As
the country is an IMO member state and a main candidate to join the European
Union, it is very important to know the legislation of both institutions and examine
its impacts on Estonian maritime activities.
As the author of the dissertation is interested in safety of transportation of oil and
its products as this is most quickly developing trade area in Estonian ports then quite
a significant part of the dissertation is dedicated to that area. The author’s aim is to
give an overview of handling of dangerous good, possible threats that exist around
this topic and comparison of existing IMO, EU and Estonian rules.
The objectives of the dissertation are following:
Firstly, to give an overview of the statistics of dangerous cargo movement in
different parts of the world and to show how to use this information. Secondly, to
describe different type of dangerous substances and show what kind of physical and
chemical features make them dangerous to people and the environment. Thirdly, to
emphasise the main reasons of accidents and “near misses” and give ideas how to
avoid them. Fourthly, to analyse the IMO and the EU legislation concerning the
transport, handling and storing of hazardous materials. Do the existing rules decrease
the risk of accidents? What are the differences between IMO and EU legislation?
Why does the European Commission demand more than IMO? These and other
questions will be answered in the dissertation. Finally, the situation of handling of
dangerous cargoes in Estonia is introduced and weaknesses in the current system are
1.2 Research plan
As the dissertation “Transport and handling of dangerous cargoes in port areas;
the weaknesses of existing international and Estonian regulations“ consists of
statistics, facts, regulations analyses and a description of implementing them,
different research methods were used. When statistics and legislation can be
analysed behind the computer screen or on the basis of the literature, then the
implementation of regulations can be checked only in the middle of port operations.
For that reason the author of the dissertation spent his time in different libraries
reading specific literature, but also visited different institutions and stevedore
companies. Estonian Ministry of Transportation and Communication (legislative
organ), the Estonian National Maritime Board (implementing and controlling organ)
and the Port of Tallinn authority and different port operators like Pakterminal,
Eurodeck, Neste (liquid bulk operators) and Ferry Terminal as the main container
operator were visited. These appointments gave the author change to listen to both
legislation drafters’ and terminal operators’ opinions about legislative acts with aim
to understand the strengths and weaknesses of existing regulations. Due to Internet
databases it was possible to find out all of the complete texts of the European
Commission’s directives and Estonian legislation. The analyses of materials
published in the magazines “Cargo Systems”, “Port Development International”, and
the “Hazardous Cargo Bulletin” available in the WMU library helped to bring out
weaknesses and problems related to dangerous cargo.
1.3 Difficulties
The author must thanks all governmental and non- governmental officers,
especially in the Pakterminal and Neste terminal for cooperation and any kind of
help. The most difficult part during the research and writing process was to collect
relevant statistics concerning dangerous cargo movement in Estonia. The main
reason was that general statistics of dangerous cargo movement does not exist. The
information found was not updated and it was impossible to visit all related
companies and institutions during a few weeks. Another problem rised when the
Managers did not hide the fact that minor incidents have happened. Unfortunately
they decided to refuse to give more accurate information. During the research
process the author familiarized with literature which introduce port operations and
maritime transport. To his surprise, problems related to handling of dangerous cargo,
CHAPTER 2
THE DANGER OF HAZARDOUS SUBSTANCES
AND THEIR POSSIBLE IMPACTS
Chemicals cause danger during their transport. Their damaging effect varies
considerably, depending on their classification. In this chapter the definition of
dangerous cargo is introduced. The author also describes different classes of
chemicals and analyses characteristics which make substances dangerous. Finally,
different impacts both to humans and the environment is analysed.
2.1 Definition of dangerous cargo
In the maritime literature and legislation expressions “dangerous cargoes and
goods”, “harmful substances”, and “hazardous materials” can be seen. The variety of
terminology causes confusion and rises the question: “What is the difference between
these words?” Captain Roos, the Harbour Master of the Bremenhaven gives good
explanation. According to him there are three areas which are related to dangerous
substances: production, transport and use. To make better distinctions between them,
in the transport chain dangerous substances should be called “Dangerous Cargoes”.
The IMO uses in its documents both the phrase “dangerous goods” (SOLAS, IMDG
Code) and “Dangerous cargoes” (“Recommendations on the Safe Transport of
Dangerous Cargoes and Related Activities in Port Areas”). The US authorities prefer
“hazardous materials”. Therefore, there is no exact phrase which is used everywhere
in the world and different words is used to describe same thing.
What are dangerous cargoes? Broadly, these are cargoes that endanger lives,
people, property and the marine environment (Rawson, 1994). IMO defines
dangerous cargoes in the “Recommendations on the Safe Transport of Dangerous
Means any of the following cargoes, whether packaged, carried in bulk
packagings or in bulk within the scope of following regulations:
1. petroleum in any form including crude oil, fuel oil, sludge, oil refuse and refined
products mentioned in annex I of MARPOL 73/78.
2. Noxious liquid substances falling into category A, B, C, D of MARPOL annex II.
3. Dangerous hazardous and harmful substances and materials including marine
pollutants and wastes covered by IMDG Code.
4. Solid bulk materials possessing chemical hazards and solid bulk materials
hazardous only in bulk covered by annex B of the BC Code.
The same document adds more.
The term “dangerous cargoes” includes any empty uncleaned packagings which
previously contained dangerous cargoes, unless the packagings have been
sufficiently cleaned….
Though, the definition is wide and almost every port in every country handle some of
these substances or items mentioned in Conventions.
2.2 The classification of dangerous chemicals
Today there are 100 million different kinds of chemicals in the world that can
be referred to as dangerous. It is estimated that not less than 100,000 of them are
commercially traded (Brünings, 1999). Every year 10-20 thousand new chemicals
are developed, around 2000 of them entering to commercial business. The transport
of dangerous substances by sea is especially dangerous as the amounts on board can
be big if to compare with land transport. In a chemical tanker it is possible for each
cargo tank to carry 20 to 2000 times the quantity of single road tanks (James, 1994).
Hazardous materials can cause serious harm to human health and the environment.
The damaging effect of chemicals varies considerably, mostly depends on their type,
toxic content, reactivity, condition of discharge concentration and amount. Some
hazards come from the substance itself but some are the result of contact between
two chemicals. The research to find out the hazards of certain chemicals and their
mixture has been a long- term process where different methods have been used.
1. practical historical knowledge (showed the hazards of explosives)
2. long term experiences ( showed the hazards of asbestos)
3. accidents
4. laboratory tests
On the basis of the characteristics of substances, UN experts on the transportation of
dangerous goods prepared the book “Minimum Requirements for the Transportation
of Dangerous Goods “ in 1956, which divides chemicals into nine groups according
to their characteristics. These groups are the following:
1. explosives
2. gases
3. flammable liquids
4. flammable solids
5. oxidizing substances
6. poisonous substances
7. radioactive materials
8. corrosives
9. miscellaneous dangerous goods
2.2.1 Description of classes.
In this paragraph different groups of chemicals, which are most often
transported, are described.
Flammable substances
The terms “flammable” and “inflammable” are synonyms and refer to the ability of a
substance to burn. A naked flame is not the only possibility to cause the fire, a spark
from static electricity or the impact of something hard on an iron surface can be
sufficient. For instance, carbon disulphide can be ignited by the heat of a steam pipe
(Brice, 1990). Read more about flammable materials in paragraph 2.3.1.
Oxidising substances
These are substances which decompose to release oxygen and can assist fire. A
explosion. Chlorates, perchlorates and nitrates are good examples of oxidising
substances (Brice, 1990).
Radioactive substances
These substances emit ionising rays or particles. In high doses radiation burns
tissues, leading to radiation sickness. Lower doses can induce cancer of various
forms and leukaemia (Brice, 1990).
Corrosives
These substances eat their way through metals, plastic, other materials and tissues.
Strong acids are obvious examples. Strong alkalis are also corrosives but they do not
attack any metals except aluminium.
Poisonous substances
These substances can cause illness or death after one short exposure either by
swallowing, skin contact or inhalation. The effect of these substances can be
reversible or permanent. For example, the inhalation of some solvent vapours can
cause unconsciousness, which may wear off if the victim is moved to the clean air
zone. The absorption of a small amount of methanol, at the same time, can cause
permanent blindness.
2.3 Physical and chemical criteria which makes chemicals dangerous
Flammability is the main hazards faced by those handling dangerous cargo, it
is followed by corrosivity and toxicity. Flammable dangerous goods comprise a vast
range of products across the solid- liquid- gas spectrum from metal carbides and
organic peroxides to liquefied gases and oil products. It is important to be familiar
with the danger of flammability as the volume of this type of cargo is big. At the
same time corrosives, toxic and radioactive substances are transported in relatively
small quantities and under very controlled conditions. Although through Estonian
ports mainly flammable cargoes are transported, then mainly their chemical criteria
are under the view in the dissertation. In addition, many accidents with seafarers and
terminal workers happen when they are affected by a lack of oxygen. For that reason
one paragraph is dedicated to introduce dangers related to oxygen consumption
2.3.1 Flammability
Fires, explosions and poisoning vapours are main source of threats which are met
during the handling of flammable substances. Flammable and explosives materials
do not burn by themselves. Specific physical and chemical conditions influence the
process. The source of ignition (spark or fire), fuel and oxygen must be present. If
one of these elements showed on the chart 1 misses, fire will not occur (Bond, 1991).
Chart 1. The fire triangle
The flashpoint and the suitable mixture of air and gas are main conditions for
combustion and explosions. A flashpoint of a flammable liquid is the lowest
temperature at which it gives off sufficient vapour to form an ignitable mixture near
the surface of the liquid (ISGOTT, 1996). Substances with low flashpoints are more
dangerous than the substance with high one. According to flashpoint it is possible to
group liquids chemicals into two categories entitled non- volatile and volatile.
Non-volatile liquids
Chemicals with flashpoints over + 61°C belong to the group. These liquids produce
in normal temperature vapour which flammable concentration is below the lower
limit. In other words, their gases cannot burn and the substance is not considered as
dangerous (Brünings, 1999). The category includes fuel oils, heavy gas oils and
diesel oils.
Source of ignition
Volatile liquids
Chemicals with flashpoints below +61° belong to the group. Liquids in this category
are capable to produce in normal temperature air/gas mixtures above upper
flammable limits. Examples in this category are jet fuel, kerosene, petrol and crude
oil. Volatile liquids are divided into three subgroups according to their danger:
1. Substances with low flashpoint below –18°C.
The most well known substance is petrol with a flashpoint between -27 °C and
-50°C).
2. Intermediate substances have flashpoint between –18°C and +23°C.
3. High flashpoint liquids have a critical temperature up to +23°C to +61°C. Diesel
oil (+43°C to +88°C) belongs to that class.
As it was mentioned before the temperature of flammable vapours is not enough
to ignite a fire, the sufficient amount of oxygen must be also in present. The suitable
concentration of vapour and oxygen is called the ”flammable range” (ISGOTT, 1996).
Lower limit of that range means that there is an insufficient amount of
hydrocarbon gas in the air to support and propagate combustion (ISGOTT, 1996).
An upper flammable limit means that hydrocarbon gas in the air is above the
flammable limit and there is not enough oxygen to support the fire.
Flammable limits vary for different chemicals and physical conditions such as
pressure, temperature and mixture (Bond, 1991). In practice gas mixtures’ lower and
upper limits of oil cargoes are between 1% and 10% by volume of atmosphere
(ISGOTT, 1996).
Table 1. Flammable range of different type of oils.
Substance Lower limit Upper limit
Crude oil 2.2% 9.5%
Aviation gasoline 1.9% 8.5%
Natural gasoline 1.5% 7.8%
2.3.2 Vapours
Vapours are not dangerous only from the point of safety. Volatile organic
compounds (VOC) vapours, which originate from the manufacture, storage and
distribution of products like gasoline and solvents are also pollutants. They cause
environment contamination and danger to lives and vegetation. Volatile organic
compounds although react with sunlight and form photochemical smog, which
causes global warming. Even more, vapours containing individual toxic products like
benzene (UN no. 1114) are the key substances of causing cancer in human beings.
Volatility (the tendency of oil and its products to produce vapours) is
characterised by the vapour pressure, which depends on temperature, constituents
and the volume of the vapour space. The higher the pressure the bigger the
evaporation.
All liquids have a natural tendency to achieve equilibrium within surroundings.
For liquid stored in a tank this means that evaporation occurs until a certain
concentration of gas has been established in the vapour space. The
equilibrium-saturated concentration depends on the vapour pressure of the liquid. The higher the
vapour’s pressure the bigger the evaporation. The emission of vapours to the
atmosphere during the handling of large quantities of oil is possible in three ways:
• Displacement losses of vapour when filling the tanks
After filling a tank, a small proportion of the liquid will evaporate in attempting
to achieve certain equilibrium concentration of vapour in the tank vapour space.
The evaporation is smaller when the tank already contains any liquid because
then the vapour already exists in the tank.
• Losses through tank vents during the storage
Air temperature influences the emission of vapours in tanks. When the
temperature rises during the daytime the vapour pressure increases and results in
the emission of vapours to the atmosphere. At night, the pressure decreases and
air is drawn into the tank. This creates a driving force for new evaporation until
the vapour equilibrium concentration is re-established. The amounts of losses of
vapours can be significant depending upon the liquid volatility and temperature
• Losses from opening hatches on transport units
These amounts are not big but can still contribute losses. This happens when the
hatch is opened to enter or withdraw the loading arm or the hose.
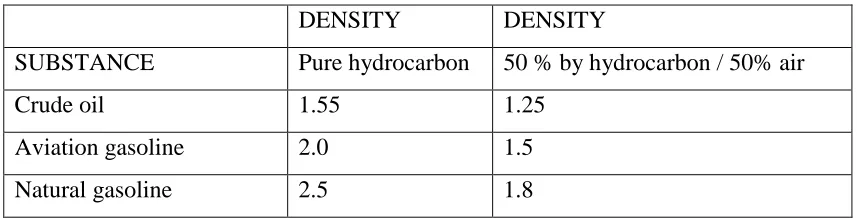
The hazard of vapours depends on their density and toxicity. If the vapour
density is less than 1.0, the vapour rises high and disperses soon (ISGOTT,
1996). In case of density more than 1.0, hydrocarbons’ vapours spread near the
ground or deck and may travel down stairs (ISGOTT, 1996). These vapours do
not disperse quickly and may affect human lives very seriously. For instance, the
density of vapour of petrol is greater than the density of air. Therefore layering
effect must be taken into consideration in handling this type of cargo.
Table 2. Different densities of oil and its products relative to air
DENSITY DENSITY
SUBSTANCE Pure hydrocarbon 50 % by hydrocarbon / 50% air
Crude oil 1.55 1.25
Aviation gasoline 2.0 1.5
Natural gasoline 2.5 1.8
Source: ISGOTT 1996
The toxic hazard of chemicals depend on various kinds of hydrocarbon
constituents of vapour. Toxicity can be influenced by the presence of aromatic
hydrocarbons (benzene, toluene, xylene) and hydrogen sulphide (ISGOTT, 1996).
For instance, already small quantities of petroleum vapour cause symptoms similar to
drunkness with headache and irritation of eyes. In high concentrations it leads to
paralyses, insensibility and death. The smell of petroleum vapour is variable and
sometimes it can be even without smell. This happens when the vapour contains
hydrogen sulphide. Therefore the absence of smell cannot be an indicator of the
2.3.3 Oxygen consumption
The oxygen content in enclosed spaces (like holds or tanks) may be low
because it is removed by chemical reactions. This causes a danger to human life.
There are special symptoms which indicate a lack of oxygen but most people cannot
recognise them until they are too weak to escape without help. The danger is
extremely big when escape needs climbing out of the cargo holes or tank. If the
amount of available oxygen decreases below 21% of the volume of atmosphere
breathing becomes faster and deeper (ISGOTT, 1996). An atmosphere containing
less than 10% oxygen content by volume causes unconsciousness and leads to death
of person unless the victim is removed quickly to the open air (ISGOTT, 1996).
Oxygen level falling under 5% by volume of atmosphere causes immediate
unconsciousness and brain damage even if life is restored later (ISGOTT, 1996).
2.4 Possible impacts of dangerous chemicals
The wrong handling of dangerous chemical substances may cause accidents
which impacts may be very serious. They can pollute water, kill living people and
organisms, destroy property and affect the economy. In the following part of the text
potential consequences are under view.
2.4.1 Pollution of water and mortality of fauna and flora.
Chemicals discharged into the water can affect the aquatic ecosystem in many
ways (Pardo, 1999).
• Impact on the exchange of gases spilled into the water start biological processes which consume the oxygen in the water.
• Energy release cause water temperature increase
• Toxic properties on the surface and in the water affect negatively marine life.
Chemical pollution can be a direct or a long term. When the direct impact
affects the environment immediately, then the long-term influences the flora and
fauna even after the disappearing of the pollution. The reason is that some chemicals
growth, physical disturb feeding or cause tainting and accumulation of substances
into the organisms.
2.4.2 Destruction of property
Explosions and fires of hazardous chemicals are the main reasons of the
damage of vessel and port structure. Especially dangerous are substances belonging
to UN classes 1, 2, 3 and 4.
To show the impact of an explosion, the “Fort Strikene” example is described.
The cargo vessel “Fort Strikene” was moored alongside Victoria dock in Bombay in
1944. There were 1,260 tonnes of dynamite and 1,648 tonnes of bales of cotton
loaded in the same hold. The cotton ignited itself and caused dynamite explosion.
The “Fort Strikene” exploded with such a force that nine ships sank and the port was
completely destroyed. More worse, extremely high waves killed 1,376 people and
damaged hundreds of houses (Compton, 1999).
The incident shows that when large quantities of explosives or flammable chemicals
are transported extreme safety measures must be taken into consideration.
2.4.3 Death and serious injuries to human life
Explosions, fires and toxic vapours of different chemicals are the main
dangers affecting people. As the results of explosions and fires have been already
described in part 2.3.2 then now the main concentration is dedicated to the impact of
vapours.
To show the seriousness of vapour release, the Bhopal gas cloud disaster is
described.
The pesticide factory situated in Bhopal, a city with a population of 670,000 in
central India. On the 3 of December in 1984, 15 tonnes of the highly toxic and
irritant gas methyl isocyonate (UN no 2480) leaked from the tank. The gas cloud
covered a 30- mile long and 1.5- mile wide area. It was estimated that 200,000
people breathed the vapour, 2,500 of whom died due to the flooding of their lungs.
125,000 people required hospital treatment, of whom 20,000 were seriously sick.
2.4.4 Negative impact to the economy of the area where the accident occurred
Pollution’s negative affect the economy basis on its high cost which is can be
divided into two groups. When direct costs are related to the recovery of physical
damage, reconstruction work, and also clean up operations them indirect costs can be
associated with the closure of affected areas for navigation, sea use and customers
trust (tourists number decreases, fish products are boycotted by consumers).
Although international funds (today the International Oil Pollution Fund, which
covers crude oil pollution and in the future the HNS Fund, which covers pollution of
hazardous substances) cover expenses, there are very often occasions when their
financing is not sufficient or the pollution claims are not accepted by the fund. In this
case the money must be taken from the government budget which causes poor
CHAPTER 3
THE OVERVIEW OF THE TRANSPORTATION OF DANGEROUS CARGOES IN THE DIFFERENT PART OF THE WORLD
As the world becomes more industrialised the list of chemicals developed and produced increases year to year. Because of the main principle of logistics and the role of multimodal transport more and more dangerous cargo is transported from one area to another. According to the IMO materials, at the end of the 20th century more than 50% of bulk and 10-15% of conteinerized or packed cargoes transported by sea all over the world are classified as dangerous. The main objective of the chapter is to emphasize the importance of the transportation of dangerous cargo in the world. The author introduces main countries and ports which have leading role in handling of dangerous cargo in the world. More detailed overview of transportation of dangerous cargo in the Baltic Sea is given. Finally, overview of development of movement of harmful substances through Estonian ports in recent years is given.
3.1 World statistics
Chart 2. The division of world seaborne trade in 1997
Source: Intertanko, Drewry Shipping Consultants, 1999
According to the Drewry Shipping Consultants, the US is the biggest importer of Latin-American and northern European oil. The state imports from the Middle-East, Africa, Asia and Mediterranean areas are stagnant. Japan’s crude oil is mainly supplied by the Middle-East. Europe uses mainly local oil. On the basis of the research of the Drewry Shipping Consultants, a similar trend is in oil products seaborne trade. The USA is the main consumer of Latin-American and northern European petrol. Europe itself is concentrated to use its own interregional sources and decreases import from non- European states.
The United States
The United States is the biggest handler of dangerous substances. Inside the state 4 billion tonnes of hazardous cargo are transported annually, involving 500,000 movements per day, mainly by road and rail (Compton, 1994). The state imported 425.8 million tonnes of crude oil and 87.6 million tonnes of oil products in 1998. At the same time 8 million tonnes of crude oil and 15.7 millions tonnes of oil products moved out of the country (BP Amoco Statistical Review of World Energy, 1999). The main ports handling dangerous liquid substances are Philadelphia, Houston and Tampa (table 1). The United States is also the leader in the trading of containerised dangerous cargo. The biggest international trade of hazardous substances in the world is between the USA and northern Europe. It is estimated that 10% of imported containers to the US and 17% of exported from the US carry dangerous substances
35%
10% 2%
53%
crude oil
oil products chemicals
(Lyons, 1999). Between January and July 1999, 7,200,000 TEU-s containing dangerous goods were moved between western coast of the US and Europe (Lyons, 1999). Eastbound coast trade was 600,000 TEU-s (Lyons, 1999). The biggest ports, which handle conteinerized harmful substances in the USA are Long Beach, Los Angeles and New York .
Table 3. Main oil ports in the US and their throughput in 1998 Port Oil throughput
Philadelphia 41million tonnes Houston 40 million tonnes Tampa 13 million tonnes Seattle 13 million tonnes Los Angeles 3 million tonnes
Source: Institute of Shipping Economics and Logistics
Canada
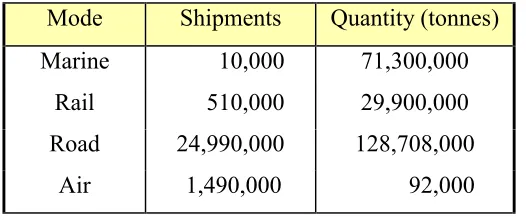
In Canada, 230 million tonnes of packed dangerous goods are transported per year, involving 75,000 movements per day, mainly by road. Statistics show that 56% of Canada’s total cargo is moved by trucks.
Table 4. Approximate annual numbers of dangerous cargo movements in Canada Mode Shipments Quantity (tonnes)
Marine 10,000 71,300,000 Rail 510,000 29,900,000
Road 24,990,000 128,708,000
Air 1,490,000 92,000
Source: Transport Canada
tonnes) and Halifax (4.2 million tonnes) (Institute of Shipping Economics and Logistics, 1998).
Asia
The Asian biggest oil port is Kaohsiung in Taiwan. In 1997, operators handled 36.5 million tonnes of oil and its products. The Japanese ports of Yokohama and Nagoya, with a throughput of 15.3 million and 14.4 million tonnes of oil keep second and third place in Asia (Institute of Shipping Economics and Logistics, 1998).
Europe
According to Mr. Endlicher, Head of Central Logistics of Bayer AG (1997), inside Europe 88% of the movement of chemicals are done by road and 7% by rail. In 1990, 1.3 billion tonnes of hazardous substances were moved by road and 90 million tonnes by train inside EU countries. Inside Germany several hundreds millions of tonnes of chemicals are moved. Another 50 million tonnes are carried out of the country by land (Lambrecht, 1992).
255 million tonnes of liquid dangerous cargoes, from which 10.3 million tonnes were chemicals moved through UK ports in 1991 (James, 1992). Research based two years early statistics showed that 3.6 million tonnes of packed hazardous cargoes were handled by British terminals.
Rotterdam is the main European port for the transport of dangerous cargoes. It is followed by Marseille (France), Milford Haven and Forth Port (UK) and Willhelmshaven (Germany) (table 5).
Table 5. Biggest oil ports in Europe and their throughput in 1998
Port Oil and its product throughput
Rotterdam (The Netherlands) 120 million tonnes Marseille (France) 45 million tonnes Wilhelmshaven (Germany) 36 million tonnes Forth Ports (UK) 33 million tonnes Milford Haven (UK) 33 million tonnes Le Havre (France) 28.8 million tonnes Ventspils (Latvia) 25 million tonnes
London (UK) 18 million tonnes
Genoa (Italy) 17 million tonnes
Source: Institute of Shipping Economics and Logistics
3.2 Baltic Sea statistics
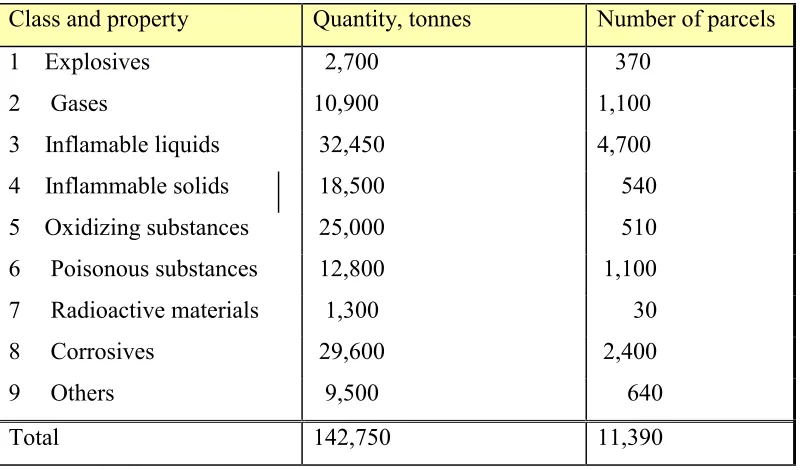
Approximately 143,000 tonnes of packaged dangerous cargo is carried in 4000 shipments in the Baltic Sea every month. A totally of 795 different substances are transported, half of them are carried only once or twice a month and only a hundred of different substances are carried more than 20 times. Summary of the substances is in annex 1.
The main dangerous goods transported in packed form in the Baltic Sea are inflammable gases (class 3 according to IMDG Code), followed by corrosives (class 8) and oxidizing substances (class 5).
east coast and in the Gulf of Finland. Transport activity is quite low in the Gulf of Bothnia.
Table 6. Total quantity and number of parcels per class transported in the Baltic Sea
Class and property Quantity, tonnes Number of parcels
1 Explosives 2,700 370
2 Gases 10,900 1,100
3 Inflamable liquids 32,450 4,700
4 Inflammable solids 18,500 540
5 Oxidizing substances 25,000 510
6 Poisonous substances 12,800 1,100
7 Radioactive materials 1,300 30
8 Corrosives 29,600 2,400
9 Others 9,500 640
Total 142,750 11,390
Source: Helsinki Commission
The ferry lines’ part in transportation of dangerous cargo is significant. 76,000 tonnes which make 53% of the total amount of the dangerous cargo, are shipped with ferries sailing in 34 different routes. (List of these routes is shown in annex 3).
Chart 3. Biggest oil ports in the Baltic Sea
Source: Institute of Shipping Economics and Logistics
3.3 Estonian statistics
As any research covering dangerous cargo movement in all Estonian ports around the country have not been done and the official annual statistics do not exist, it is difficult to find out accurate figures. The only official survey available were done in 1995 by the Helsinki Port Authority in Finland (covered transport of dangerous cargo by ferries between Tallinn and Helsinki) and in 1997 by Estonian Maritime Board’s Hazardous Cargo Division (covered dangerous cargo movement through Estonian three main ports during 10 days). To get more updated information the statistics of handled cargo by main stevedore companies is used.
The direction of traffic flow of dangerous goods in Estonian ports depends very much of the type of the cargo. Bulk cargo moves usually through ports out of the country. According to the port statistics, ammonium nitrate (UN no. 1942 and 2067), which can be qualified as dry bulk, moves 100 % from Russian factories to Estonian ports by rail with aim to export to the world market by ships.
Similar situation is in the liquid bulk trade. Approximately 95% of oil products move from Russia to Estonian ports by railway and later shipped to the world. The remaining 5 % (mainly gasoline) is transported to Estonian ports from the Neste refinery in Finland by ships and is consumed in the country or sent out to the other Baltic States or Russia.
25 17 4.7
3.6 1.7 1.2
0 5 10 15 20 25
Ventspils Tallinn Gdansk Klaipeda Helsinki Peterburg
Opposite to the liquid and dry bulk cargo movement trend, 90% of containerised dangerous cargo is imported to Estonia by ships and moved later to Russia by rail or Latvia and Lithuania by road.
A similar trend is in ferry transport. Most of the trucks and trailers carrying hazardous substances come from Finland and Sweden. Some of them continue their trip to other Baltic States.
Dangerous cargo usually moves through the ports, which are in Tallinn. Most oil products, containers, dry bulk and some trailers are shipped through the biggest Estonian port known as the “Port of Muuga”. Some containers and most of the trailers move through the Old Harbour. Only trucks using ferry route between Paldiski (Estonia)- Kappelskär (Sweden) travel through the Port of Paldiski, which is in the NW part of the country.
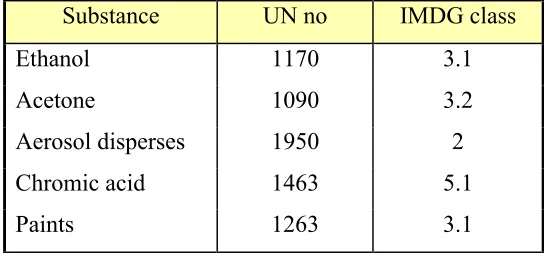
The quantities of packed dangerous cargo transported through Estonian ports are not significant. Research done by the Estonian Maritime Board in 1997 showed that during 10 days 811 tonnes of packed dangerous goods were imported through the three ports (table 5).
Table 7. Main chemicals in packed form imported to Estonia
Substance UN no IMDG class
Ethanol 1170 3.1
Acetone 1090 3.2
Aerosol disperses 1950 2
Chromic acid 1463 5.1
Paints 1263 3.1
Source: Estonian Maritime Administration
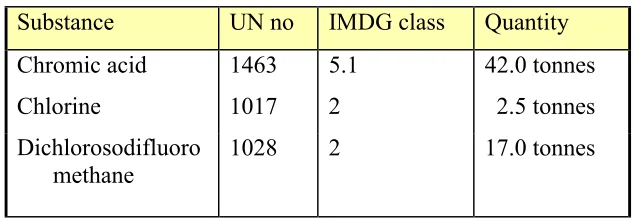
Table 8. Main chemicals exported from Estonia
Substance UN no IMDG class Quantity
Chromic acid 1463 5.1 42.0 tonnes
Chlorine 1017 2 2.5 tonnes
Dichlorosodifluoro methane
1028 2 17.0 tonnes
Source: Estonian Maritime Administration
According to 10 days statistics it is possible to estimate that approximately 30,000 tonnes of packaged dangerous cargo moved through Estonian ports in 1997 (Hurbas, 1997). Although this limited time period may be too short for producing statistically reliable data, it is still useful information, previously not available at all. As the cargo amount has increased between 1997 and 2000, so the number is probably bigger now.
Another research related to truck movements between Estonia and Finland was done in 1995 by Helsinki Port Authority. During the period between 1 January and 30 June, 5,562 tonnes of dangerous cargo in 864 trailers sailed across the Gulf of Finland (Arro, 1996). 4481 tonnes (81% of the total quantity) were liquid chemicals like paints, 461 tonnes (8.3%) of corrosives (class 8) and 233 tonnes (4.2%) of gases (class 2). The research showed that 140 trucks with dangerous cargo moved monthly between Tallinn and Helsinki in 1995. According to the statistics published in the magazine “Cruise & Ferry Info” approximately 5,500 lorries were transported per month between these two towns in 1995. A simple calculation shows that 140 lorries from 5,500 are 2.6%. If to use the same ratio in 1999 when 7,800 tracks sailed between Tallinn and Helsinki per month, then 2.6% is 203 lorries.
Director-General of the Pakterminal, the main advantage why Russian oil exporters prefer Estonian ports to others at the same region is the vicinity to the Russian border. When the “Port of Muuga” situates 210 km from the border then the main competitors Klaipeda in Lithuania and Ventspils in Latvia stays 400 km from Russia. In addition, the Klaipeda port’s oil transit route goes through Belorussia, which automatically adds two extra border crossings and significantly decreases their competitive position in the market.
In 1999, 17.1 million tonnes of oil and its products were handled in four Estonian ports. The biggest throughput (14.5 million tonnes) was in the “Port of Muuga”, followed by the “Port of Vene- Balti” (1.8 million tonnes) and the “Port of Miiduranna” (0.8 million tonnes).
Chart 4. Historical overview of liquid bulk cargo transport development in the ports of “Port of Tallinn”
Source: Statistics of “Port of Tallinn”
Port of Muuga
In 1999, 611 tankers with a total dwt 5,000,000 visited the port. They loaded 13,317,400 tonnes and discharged 611,400 tonnes of oil and its products (source). 14.5 million tonnes of oil handled in the “Port of Muuga” put the harbour on the list of the biggest European oil ports into the 10th position (Institute of Shipping Economics and Logistics, 1998).
5.8
8.01
11.5 14.5
0 2 4 6 8 10 12 14 16
1996 1997 1998 1999
Chart 5. Different oil terminals and their throughput in the “Port of Tallinn” 8 4 3.1 1 0.8
0 2 4 6 8
Pakterminal EOS Eurodek Scantrans Milstrand
throughput in million tonnes
Pakterminal
To emphasise the importance and activities related to oil transportation in Estonia the main oil terminal is introduced. Pakterminal a 50%- 50 % joint venture of Estonian investors and Netherlands’s Ovpak company is the largest of seven existing oil terminals in Estonia. It is also the biggest in the Baltic States. When in 1995 its throughput was 2.24 million tonnes of oil, then in 1999 the number was already 8.04 million (47% of total 1999 year Estonian oil transhipment).
Chart 6. Throughput of oil in the Pakterminal in million tonnes
2.28 3.5 2.76 5.25 4 7.5 6.49 8.01 0 2 4 6 8 10 12 14 16
1996 1997 1998 1999
The number of discharged railway tanks in the terminal increase year by year. In 1997 the terminal handled 86,000 and in 1998 already 129,000 railway tanks. In the year of 1999 the number reached to 139,000. The total storage capacity of the terminal is 206,000 m3. Three rail tanks discharge installations can handle 84 wagons simultaneously. The traffic in the terminal is very active, statistics show that 400 rail tanks carrying 20,000-23,000 tonnes of fuel, are discharged per day, and at least one tanker is moored to load oil in the quay every day. 95% of the cargo comes from Russia and is transhipped by tankers to the world market. 5% of cargo comes by sea and is sent mainly to Russia by rail tanks.
Chart 7. Number of railway tanks handled in the Pakterminal
The rough division of operating cargo in the terminal is the following: • 40% of cargo is classified as heavy oil
• 40% gasoline (UN no.1203, IMDG class 5.1) • 20% kerosene (UN no.1223, IMDG class 3.3)
86000
129000
139000
0 20000 40000 60000 80000 100000 120000 140000
1997 1998 1999
CHAPTER 4
THE ROLE OF STATISTICS IN THE TRANSPORTATION OF DANGEROUS CARGOES
The detail survey about the movement of dangerous cargo may look unimportant to persons who are not involved in handling of harmful substances. In reality the accurate statistics play a significant role in many fields. In the chapter different possibilities how to use the statistics have been analysed.
4.1 The importance of the statistics
Statistics plays an important role in modern industry. It is useful both operator companies and legislative bodies. The developments of companies, service supply level and amount of production, also safety and precaution measures depends on the analysis of statistics. Similar principles are in the business of dangerous goods transportation. Collecting, updating and analysing statistics related to the movement and handling of harmful substances is the key issue which helps to:
• establish state transport policy and local legislation.
than 21°C must be treated in a similar way when they are shipped more than 100 km. All dangerous goods transported more than 400 km have to be moved by combined transport. This is of course in case when ports and railway nets exist. The main reason to establish that regulation is the tank container explosion in the centre of the city of Herborn in 1988. Baltic States, opposite, are interested in cargo movement from Western Europe to Finland using “Via Baltic” road through their countries.
• define main traffic routes and increase safety
Statistics are the basis for develop contingency plan (Sampson, 2000). The authorities have an overview of the amount of dangerous cargo transported through the area. This information gives responsible authorities chance to define possible dangers and impacts and to take measures to avoid accidents or decrease their impacts (local response service officers are trained to deal with possible hazards and specific response equipment is stored in the area).
• restrict dangerous cargo movements in sensitive areas
In case statistics show that large quantities or extremely dangerous substances go through the highly populated or environmentally sensitive areas, local authorities can close some areas for transport. For instance, in Finland it is prohibited to transport chemicals except class 2 in some build up areas. In Norway it is prohibited to transport dangerous substances belonging to UN classes 1, 2 and 3 through long underground tunnels (HCB, 1998).
• make marketing research and develop economy
4.2 “A crisis management map”
“A crisis management map” is not a new invention, which is used already many years in France. Despite of that fact it needs introducing as in many countries the idea is new.
The mapping of transport routes is the easiest way to find out possible dangerous areas on the chemical cargo transport route. The map must also show the places to get some help in case of emergency. In addition, it can help to educate people in how to act in the case of an accident.
CHAPTER 5
ACCIDENTS AND THEIR AVOIDANCE
Transport and handling of dangerous substances are activities with the high risk. In this chapter historical overview of biggest accidents is given. The chapter also points out most common violations in container transportation. Finally, establishment of management system, use of safe technology and continuous training of workers as main areas to avoid accidents happen are analyzed.
5.1 Accidents with dangerous substances, statistics of 1999
Ships loaded with dangerous cargo have been involved with many serious accidents. Here are some remarkable examples.
1917 -Halifax harbor.
An overloaded ship, “Mont Blanc”, lost maneuverability and collided with other vessel. 2,600 tons of dynamite on board exploded. 3000 people died, 6000 were injured and 6,000 buildings were destroyed. The accident is defined as the biggest man- made explosion until the advent of the atomic bomb.
1947 -Brest harbor
21 people lost their lives when the ammonium nitrate on board of the cargo ship “Ocean Liberty” exploded.
1987 – the north- west coast of Spain
The cargo vessel “Cason” grounded. Seawater entered into holds and caused a strong reaction with sodium. The result was the explosion of the cargo. 23 crewmembers died and 20,000 residents of the nearest town were evacuated.
1999 – the south- east coast of UK
The violation of traffic rules caused the collision of the cruise ship “Norwegian Dream” and the containership “Ever Decent”. Containers with dangerous substances started to burn and evaporate toxic fumes. Moreover, some of them fell on the board of the cruise ship and some into the sea. The accident had the potential to turn into a major pollution incident with very bad consequence for the UK’s coastline but due to the quick work of the response team the catastrophe was avoided (Garner, 1999).
during discharge and loading operations. 20 people lost their lives and 45 were injured. The list of all accidents happened in 1999 is available in annex 6.
5.2 Violation of regulations
When states have ratified and implemented legislation concerning dangerous goods, responsible persons from port authorities and maritime administration must concentrate to controlling the enforcement of existing rules. There is a need to do so because surveys show that occasions of the violation of regulations are not rare. Very often risks and dangers associated with transport and handling through ports are ignored. Surveys show that typical violations are related to transport of harmful substances inside containers. During the survey done in 12 ports in Belgium, the Netherlands and Germany in 1989 from 2,437 inspected freight containers 1,384 were deficient, and 497 were barred from carriage. Situation was not better with tank containers because from 473 tank containers 193 were deficient and transport of 89 units were prohibited. Although 41 trailers were inspected from which in 31 items were found some deficiencies.
Violation of container packing rules is also common in other countries. Analyses done in the southern part of the UK showed that the violation rate has reached 81%. The main violations are usually related to stowage/segregation, labelling and documentation. According to M. Compton, a survey done in the USA showed that 46% of violations are related with stowage and segregation, 24% with documentation and 21% with placards.
Stowage and segregation
not familiar of stresses affecting containers during transportation, especially at sea in rough weather. Very often the planning of stowage is not done correctly, things are not put tightly or the centre of gravity is in the wrong place. Violation of these rules causes movement of the cargo and breakage of packages and even in some cases the lost of containers overboard. The ferry “Nordic Pride” incident is one example from the long list.
In rough weather conditions the vessel “Nordic Pride” on the route Zeebruggee-Immingham lost four tank containers loaded with triethylene tetranine (UN no 2259, class 8: corrosives) and ethyl acylate (UN no 1912, marine pollutant) overboard. The investigation found out that the main reason was a too- high centre of gravity of the transport unit (Champion, 1991).
Documentation and labelling
Correct documentation and labeling plays an important role in the transport of dangerous goods. All who are involved in the transport chain must know what they are dealing with. In case of emergency, documentation helps the crew and the response team to deal with the cargo, otherwise people’s lives can be endanger and the wrong emergency response technology is used. To emphasize the importance of documentation the vessel “Santa Clara I” incident’s one aspect is described. After the storm which damaged several packages and drums on board of vessel, workers of the shipyard were sent to clean the hold. After entering the hold 32 workers got poisoning and were sent to the hospital. The problem was that magnesium phosphate (UN no 2011) was not included into the cargo manifest and the hazard of air poisoning in the hold was not appreciated. Problems with documentation and placards normally fall within one of the following areas: unsigned or missing documents; incompetent or incorrect information in documents, wrong size, missing or wrong information giving placards.
5.3 Safe running of enterprises with major hazards
that for every actual accident involving a ship, there are around 10 “near misses”- events which could have resulted in an accident (Norwegian Shipowner Association, 1995). The simple calculation shows that in this case of 31 accidents there were 300 possible accidents in 1999. Moreover, there is an enormous number of violation of rules or so-called non-conformities, which could cause “near- misses” or accidents (Norwegian Shipowners Association, 1995). Accidents and nearly misses do not just happen. There is always any cause. Different sources declare that 80-90% of accidents are caused by human failure, but human errors are avoidable through the improvement of management systems, the use of environmental friendly technology and the training of employees. Of course, where dangerous goods are handled the risk of incidents can never be eliminated. However, by using good, well-planned operating procedures the risk can be minimised.
5.3.1 Identification of hazards
In general, safety management is defined as a set of management activities that ensure that hazards are effectively identified, understood and minimized. The OECD (1992) recognises 21 management tasks and factors in the prevention of chemical incidents. Among them the most important are hazard identification (what can happen), hazard analyses (why it can happen), consequent assessment (what are the results and how much they cost) and assessment of information and lessons learnt from relevant major accidents.
critical review of existing management system, the improvement of technical equipment or the extra training of employees.
Even the idea of creating an accident database seems quite simple, in real life it is quite difficult to implement it. It is relatively easy to identify accidents, but “near-misses” and non- conformities cause more problems. Employees are not interested in reporting their errors as they scare to show themselves in a bad light and lose their jobs. To avoid this kind of threats, companies must establish official policies to encourage to report of errors and not to punish the workers. Employees at the same time should trust management. Only the wide co-operation of both sides helps to achieve the real aim; the safe and environmentally friendly handling of dangerous goods.
5.3.2 Safe and environmental friendly management
During the last ten years the importance of environmental matters has increased significantly. A large number of resolutions, recommendations, standards and codes related to environment protection have been drafted. But this is only the beginning. As Mr. P. Barnevik, president and chief executive of ABB said: “If you think today’s environmental requirements seem like a breeze, you should get ready for the storm tomorrow.” It means, companies have to establish new goals for environmentally friendly activities, otherwise in the near future they are enforced to leave the market.
ISO 14,000 is a voluntary document about management system which monitors an operation’s impact on the environment. The main goals of the system are related to pollution prevention and a decrease in the risk of potential accidents. For ports it means mainly the existence of environmental friendly loading technology and oily waste reception facilities. In 1995, 38,000 organisations planned to become registered to ISO 14000 (Horck, 1999). Environmental friendly management plays especially important role in the Baltic Sea area because of the unique status of the sea. The ISM Code is a mandatory document established by IMO for ship companies. It is compulsory to all tankers and gas carriers of 500 gt and upward. The Code establishes a system for the safe and environmental friendly management and operation of vessels with the aim to support and encourage a safety culture in shipping. The result is that the Code forces substandard shipowners to remove out of business and the marine environment is better protected. Even the analyse of the code is not the aim of the dissertation the author wants to emphasise the importance of one paragraph of the Code.
Chapter 5.2 says the following:
“the master has an overriding authority and the responsibility to make decisions with respect to safety and pollution prevention.”
This point is very important. The author of the dissertation has been witness of the situation where a master of a tanker refused to enter the port because of the bad weather. Despite the possible danger of accident the terminal management used all kinds of pressure including influencing the shipowner to force the ship berthing. The operator company needed the ship to load the cargo quickly into it and get free space as terminal tanks were full but new trains arrived continuously. In a good shipping company which has implemented a safety management system this kind of pressure is useless and does not give any effect.
5.3.3 Technical equipment
pressure inside pipeline systems and static electricity. At the same time external factors like faulty design and corrosion of pipelines’ structures can also cause accidents (Marshall, 1987). In the following part of the section the most dangerous technical parts are under view.
Hoses, loading arms and their connections
Most of the accidents during the cargo loading/discharging are related to wrong handling of hoses. The result can be very tragic. An accident in Landskrona, Sweden shows that. On the 16th of January in 1976, a French tanker started to discharge 533 tons of anhydrous ammonia. The liquid ammonia hose ruptured, and a large cloud of liquid ammonia released. The master and the chief mate who happened to be close to the transfer died. The reason for the accident was a rude violation of existing rules. The used hose was suitable for propane and butane but not for anhydrous ammonia. The pressure was too strong and the hose broke (HCB, 1999).
Even the development of hoses has been significant during last decade, changing from metallic to thermoplastic composite, they still demand very careful handling (Barber, 1985). Hoses must be checked visually before every connection operation (ISGOTT, 1996). A pressure tests must be done after specific intervals, depends on the manufacturers recommendations (ISGOTT, 1996). In addition, as the tanker falls and rises during the loading operations, strain on the hoses must be avoided.
Nowadays the most popular hose construction material is polypropylene (thermoplastic composite hose). It is resistant to organic and inorganic acids, alkalis, hydrocarbons and all solvents (Barber, 1985). In addition, they are lighter and more flexible to pressure ratings (Barber, 1985). At the same time metallic hoses are more suitable for transporting liquid chemicals with temperature up to 60°C (Barber, 1985).
instance, Malmö’s oil port uses in most cases chicksans (Horck, 1999). The disadvantage of the loading arm is their price and dimensions. As loading arms are specifically designed to the specific terminal taking into account the elevation changes (resulting from the tide, freeboard of smallest and largest tanker for which the berth is intended), the price is expensive. Although they take a lot of space. In many terminals 30-50 lines are installed side by side on quay. Tanker manifold can contain similar number of flanges. Very often some of them are used simultaneously. So the space is important.
The other area which must be under the careful attention, are connections between terminal’s hoses and ship’s manifolds. Spills and leakage from connections are mainly caused in three reasons which are following:
1. Flanges of ship manifolds and terminal’s pipelines does not fit because of different standards.
2. Poor conditions of flanges in terminals and on vessels
3. Terminal workers negligence to close correctly bolted connections.
Pressure in pipelines
The strength of pipelines must be equal to the pump speed. When terminals want to increase their loading rate more powerful pumps are used. The increased pressure inside lines can cause broke of it. A similar danger is when during the discharging process a tanker’s pumps are used (Horck, 2000). Very often vessels’ equipment is more powerful than the terminals’ capacity to handle the product. A shipowner who is interested in spending less time in the port wants to use the maximum potential of his equipment. To avoid dangers caused by high pressure during the loading/discharging operation an agreement must be exchanged between the terminal and tanker regarding pump speed, flow rate and the rate of valve closure.
Insulation system