Harpenden, Herts, AL5 2JQ
Telephone: +44 (0)1582 763133 Web: http://www.rothamsted.ac.uk/
Rothamsted Research is a Company Limited by Guarantee Registered Office: as above. Registered in England No. 2393175.
Rothamsted Repository Download
A - Papers appearing in refereed journals
Stewart, I. D., White, I. M. S., Gilmour, A. R., Thompson, R., Woolliams,
J. A. and Brotherstone, S. 2012. Estimating variance components and
predicting breeding values for eventing disciplines and grades in sport
horses. Animal. 6 (9), pp. 1377-1388.
The publisher's version can be accessed at:
•
https://dx.doi.org/10.1017/S1751731112000596
The output can be accessed at:
https://repository.rothamsted.ac.uk/item/8qw86
.
© 21 March 2012, The Animal Consortium
doi:10.1017/S1751731112000596
Estimating variance components and predicting breeding values
for eventing disciplines and grades in sport horses
I. D. Stewart
1-, I. M. S. White
1, A. R. Gilmour
3, R. Thompson
4, J. A. Woolliams
2and
S. Brotherstone
11
Institute of Evolutionary Biology, University of Edinburgh, Kings Buildings, West Mains Road, Edinburgh EH9 3JT, UK;2The Roslin Institute, Royal (Dick) School of Veterinary Studies, University of Edinburgh, Easter Bush, Midlothian EH25 9RG, Scotland, UK;3School of Mathematics and Applied Statistics, Faculty of Informatics, University of Wollongong, Wollongong, NSW 2522, Australia;4Rothamsted Research, Harpenden, Hertfordshire AL5 2JQ, UK
(Received 23 May 2011; Accepted 5 December 2011; First published online 21 March 2012)
Eventing competitions in Great Britain (GB) comprise three disciplines, each split into four grades, yielding 12 discipline-grade traits. As there is a demand for tools to estimate (co)variance matrices with a large number of traits, the aim of this work was to investigate different methods to produce large (co)variance matrices using GB eventing data. Data from 1999 to 2008 were used and penalty points were converted to normal scores. A sire model was utilised to estimate fixed effects of gender, age and class, and random effects of sire, horse and rider. Three methods were used to estimate (co)variance matrices. Method 1 used a method based on Gibbs sampling and data augmentation and imputation. Methods 2a and 2b combined sub-matrices from bivariate analyses; one took samples from a multivariate Normal distribution defined by the covariance matrix from each bivariate analysis, then analysed these data in a 12-trait multivariate analysis; the other replaced negative eigenvalues in the matrix with positive values to obtain a positive definite (co)variance matrix. A formal comparison of models could not be conducted; however, estimates from all methods, particularly Methods 2a/2b, were in reasonable agreement. The computational requirements of Method 1 were much less compared with Methods 2a or 2b. Method 2a heritability estimates were as follows: for dressage 7.2% to 9.0%, for show jumping 8.9% to 16.2% and for cross-country 1.3% to 1.4%. Method 1 heritability estimates were higher for the advanced grades, particularly for dressage (17.1%) and show jumping (22.6%). Irrespective of the model, genetic correlations between grades, for dressage and show jumping, were positive, high and significant, ranging from 0.59 to 0.99 for Method 2a and 0.78 to 0.95 for Method 1. For cross-country, using Method 2a, genetic correlations were only significant between novice and pre-novice (0.75); however, using Method 1 estimates were all significant and low to moderate (0.36 to 0.70). Between-discipline correlations were all low and of mixed sign. All methods produced positive definite 12312 (co)variance matrices, suitable for the prediction of breeding values. Method 1 benefits from much reduced computational requirements, and by performing a true multivariate analysis.
Keywords:genetic evaluation, sport horse, eventing, (co)variance matrices
Implications
There is demand for tools to estimate (co)variance matrices with a large number of traits. Different methods to produce large (co)variance matrices were examined using eventing data Great Britain. Two methods that combined sub-matrices from bivariate analyses, as well as an alternative, which performed a 12-trait multivariate analysis using data augmentation and imputation, were found to be appropriate.
Depending on the trait, heritability estimates were 7.2% to 17.1% for dressage, 8.9% to 22.6% for show jumping and
1.3% to 3.9% for cross-country, indicating that genetic progress can be made by selection in the population. Genetic correlations between grades for dressage and show jumping were positive, high and significant, ranging from 0.59 to 0.99, indicating that selection for one grade within these disciplines also selects for other grades.
Introduction
Eventing is the equestrian sport in which the horse and rider compete in each of the three individual competition disciplines – show jumping, dressage and cross-country. Internationally, genetic evaluations for performance in sport
horses tend to focus on the individual disciplines of show jumping and dressage, for which many studbooks produce annual breeding value estimates. Genetic evaluations for eventing competition are rare. Langlois (1980) and most recently Ricard and Chanu (2001) performed evaluations in the French population, the latter using earnings and ranks of the overall competition, and Kearsleyet al. (2008) performed an evaluation in the horse population of Great Britain (GB), using penalty points, and analysing individual disciplines and an overall trait. The heritability of overall competition in the French population was 0.11/0.17 (annual results; natural log of earnings per number of starts and per number of places, respectively) and 0.07 (rank in each event; Ricard and Chanu, 2001). The heritability in the GB population was 0.09 to 0.11 for dressage, 0.08 to 0.23 for show jumping, 0.02 to 0.03 for cross-country and 0.05 for overall competition, using the performance measure of penalty points in a single competition (Kearsleyet al., 2008). These estimates for the show jumping and dressage phases were similar to those derived from evaluations of the individual disciplines.
In GB eventing competition data, there are 12 traits for the combinations of discipline (3) and grade (4; which are, in order of increasing ability, pre-novice, novice, intermediate and advanced). The overall performance in a competition is based on a sum of the scores for the individual disciplines. Ideally, genetic evaluations would be based on a 12-trait model. To enable this, genetic parameters for each of the discipline-grades and correlations between them would need to be estimated. Separate breeding values for each of the 12 competition-grades could then be predicted for each horse. These would be available for all traits, or could be combined into an aggregate index, for example, for each discipline, or for the competition overall. The production of 12 traits, or an index based on these, is of interest as it allows flexibility depending on the breeding goals. For example, breeders may have a particular interest in breeding for a specific level of competition, that is, advanced for the professional rider, or novice for the amateur rider, or the interest may be in producing a horse for competing in one or more of the disciplines.
Genetic evaluations for sport horses typically estimate variance components using residual maximum likelihood (REML), and then predict breeding values using best linear unbiased prediction (BLUP). Most BLUP programs require estimated (co)variance matrices that are positive definite. When the whole matrix is being estimated directly, this fre-quently results in non-positive definite matrices (negative eigenvalues), and the probability of this increases as the number of traits increases (Hill and Thompson, 1978). This can be avoided by imposing constraints to keep the matrix positive definite. However, to cope with the computational demands of estimating (co)variance matrices for a large number of traits, often (co)variance matrices are calculated for subsets of the traits, and the estimates are then com-bined. Again, this frequently results in non-positive definite matrices, and particular methods are required to combine the sub-matrices and produce a positive definite full matrix.
Such methods include Mantysaari (2004), which uses a random regression model modified to use a rank-deficient sire (co)var-iance matrix, Wall et al. (2005), which introduced a method based on the Cholesky decomposition, minimising the Frobenius distance (Higham, 2002; Sorensenet al., 2002), among others (Knol and Ten Berge, 1989). A disadvantage of this approach is that combining sub-matrices to form a full (co)variance matrix does not make best use of the available information. Alter-natives to REML include Bayesian methods, such as Markov Chain Monte Carlo (MCMC) simulation, which has been used in horse populations (Stocket al., 2007). A comparison of Bayesian methods and REML is discussed in detail in Misztal (2008). A feature of MCMC is that it is suitable for multivariate analysis, but may be slow to compute (Misztal, 2008).
This study was driven by the need to develop compre-hensive genetic evaluations of horses competing in eventing competitions in GB using the information from all 12 traits in a multivariate fashion. However, the problems encountered in obtaining a positive definite 12312 (co)variance matrix prompted the study to include a comparison of different methodologies.
Material and methods
Data
Competition results, from 1999 to early 2008, were obtained from British Eventing, the body regulating the sport in GB. Results from GB competitors competing in national and international competitions were included. The performance traits used were the penalty point scores for each of the three individual disciplines. Penalty points were converted to normal scores within the competition class, using the method of Kearsleyet al. (2008), adapted from Royston (1982). The better performing horses were awarded fewer penalty points, and thus a negative Normal score represented a better performance than a positive score. The competition class grouped competi-tors competing against each other at the same event and covers the standard of the competition, date, location and related temporary environmental factors such as weather. The transformation of penalty points to Normal scores achieved a distribution closer to the Normal, with a zero mean score for each competition class. Horses less than 4 years old were excluded, and horses 20 years or older were grouped into a single age group.
The ability-grade combinations were as follows: dressage pre-novice (DP), dressage novice (DN), dressage inter-mediate (DI), dressage advanced (DA), show jumping pre-novice (SJP), show jumping pre-novice (SJN), show jumping intermediate (SJI), show jumping advanced (SJA), country pre-novice (XCP), country novice (XCN), cross-country intermediate (XCI) and cross-cross-country advanced (XCA). In the following discussion, those 12 combinations were the 12 traits.
exclusions during the latter phases resulted in slightly less records for them. Records where penalty points did not follow this pattern of performance-related exclusion were removed.
Horses and riders often appear in multiple grades in the data set as a whole. Conversely, some horses may not have competed in all (i.e. the latter) phases of competition because of exclusions, or within every grade; however, because of genetic connections between animals (in this case limited to connections within half-sib groups) and genetic associations between grades and disciplines, breeding values can be pre-dicted for all horses at all grades and disciplines. The rider was considered an important source of variation (Kearsleyet al., 2008) and is estimable because riders are associated with more than one horse (mean number of horses per rider52.8), and horses are also commonly associated with more than one rider (mean number of riders per horse51.7). Riders have been recorded consistently since 1999; data before this time where rider was intermittently recorded were excluded. The sire of competing horses was available from British Eventing, and was generally well recorded. Sires were recorded by name, however, with no other unique identifiers. Data were cleaned manually, conservatively grouping sire names where they were con-sidered to be the same animal. Variance components were estimated using a data set reduced in size to include sires with either (i) 30 or more individual progeny competing in either pre-novice or pre-novice grades or (ii) any progeny in intermediate or advanced grades.
Models
The basic model was a sire model with mixed linear effects, fitted within each discipline-grade:
y¼meanþgenderþageþage2þclassþsireþrider þhorseþe:
The fixed effects were gender of the horse (‘gender’: stallion, geldings and mares), the age of the horse at the time of competition fitted as linear and quadratic covariates and competition class (‘class’). Random effects were the additive genetic effect of the sire (‘sire’), the rider (‘rider’), the perma-nent environment of the horse (‘horse’) and the residual error (e). The random effects of the sire, rider, horse and residual error were assumed to be normally distributed with (co)variance matricesSsireNI,SriderNI,ShorseNIandSeNI.
Owing to computational constraints, it was impossible to perform a standard 12-trait multivariate analysis for the full model, and thus three alternative methods were used to estimate the 12312 (co)variance matrices. The relationship between traits was assumed to be unstructured, that is, there were no specified correlations between grades.
Method 1. A method called data augmentation was used to perform a 12-trait multivariate analysis. This data augmen-tation is based on work by Thompson (1994) and Clayton and Rasbash (1999) where computational requirements are reduced, using data with hierarchically nested random effects, by repeatedly fitting sub-models in an overlapping
series, with each sub-model being fitted in turn to data adjusted for effects not in the current sub-model. In an iteration of the full model, an internal iteration of each sub-model is performed. This greatly reduces the computational requirements. Fixed and random effects are updated as they are re-estimated. A simplified form of Gibbs sampling is used to add noise to the updated estimates at each step, thus preventing bias in the estimated effects. For random effects, the noise added to each solution is taken as a sample from a normal distribution with a variance equal to the prediction error variance of that solution; for fixed effects, the noise is sampled from a normal distribution with variance equal to the square of the standard error. The calculations were carried out in a development version of ASReml 3 (Gilmour
et al., 2009).
For example, if the two sub-models are: (1) y2Zu5
Xb1e and (2) y2Xb5Zu1e, where y is a vector of phenotypic observations,uandbare vectors of random and fixed effects respectively, e is a vector of residual errors,
Z and X are design matrices allocating observations to random and fixed effects, the process is as follows:
(i) For model 1, assumeuis 0, estimate and add noise tob. (ii) For model 2, augment the data by subtractingXbusing an imputed value ofbfrom (i), estimateuand variances and add noise tou.
(iii) For model 1, augment the datayby subtractingZuusing an imputed value ofufrom estimate ofufrom (ii), estimate and add noise tob.
(iv) Repeat (ii) and (iii), for total number of iterations. (v) Exclude burn-in iterations, and calculate averages of
estimates.
In this analysis, the full model was split into four sub-models. These were: (1) the fixed effect of class within discipline and grade, (2) the random effect of sire within discipline and grade, (3) the random effect of rider within discipline and grade and (4) the random effect of horse within discipline and grade. The fixed effects of gender within discipline and grade and age (linear) and age (quadratic) within discipline and grade were included in all sub-models. A burn-in period of 60 iterations was allowed, and 500 iterations were executed. Residual error covariances were fixed at zero because, as a simplification, it was assumed that there was no covariance between discipline-grades for the remaining un-explained variance. (Co)variance matrices for each random effect were estimated as the average overall iterations excluding the burn-in period, making a total of 440 iterations.
The 12-trait multivariate model (before division into sub-models) was
y¼dg meanþdg genderþdg ageþdg
age2þdg classþdg sireþdg rider
þdg horseþdg e;
(polynomial, linear and quadratic) and competition class (‘class’). Random effects were the additive genetic effect of the sire (‘sire’), the rider (‘rider’), the permanent environment of the horse (‘horse’) and the residual error (e). The random effects sire, rider, horse and residual error were assumed to be normally distributed with (co)variance matrices SsireNI, SriderNI, ShorseNIandSeNI. The estimated matrices were constrained to be positive definite by performing an expectation-maximisation update if the average information REML update generated a non-positive definite matrix.
The analysis gives solutions plus their standard errors for all fixed and random effects. Unfortunately, as yet no stan-dard errors are available for estimates of variance compo-nents; therefore, estimates of standard errors from the bivariate analyses were used (see section ‘Methods 2a/2b’ below). The standard errors from the various models are unlikely to differ much, and we might expect the standard errors from a 12-trait analysis to be lower than the standard errors obtained if only 2 of the 12 traits were included in the analysis. For this model, standard errors of correlations between traits are approximate.
Methods 2a/2b. A series (66) of bivariate analyses, for every possible pair of discipline-grade traits, was run using ASReml. Two distinct methods were then used to combine the series of 232 sub-matrices from each strata (sire, horse, rider) into the 12312 covariance matrices.
Method 2a: For each of the 66 bivariate analyses, three pairs of observations were sampled from a multivariate Normal distribution defined by the 232 covariance matrix. These were analysed in a 12-trait multivariate analysis using ASReml, where the only fixed effect in the model was a separate mean for each of the 66 bivariate analyses. At least three samples were required to ensure that the resulting (co)variance matrix matched the (co)variance matrix from the bivariate analysis. This is an extension of
Wallet al. (2005), designed to ensure that a mean could be fitted in the final model.
Method 2b: The average (co)variance values for the 66 bivariates were calculated as simple means. To convert these average (co)variance matrices into positive definite matrices, they were decomposed to give the eigenvalues and eigenvec-tors. Negative eigenvalues were changed to 1310210and the matrices were re-composed. This method is a simplification of more complex methods that minimise the Frobenius distance between the original estimate and the final positive definite estimate (Higham, 2002; Sorensen et al., 2002), that is, equivalent to computing the positive definite matrix that is best fitting by least squares (Knol and Ten Berge, 1989). Standard errors of correlations were not accounted for in the process.
Thus, three methods were used to produce the positive definite 12312 (co)variance matrices, suitable for BLUP estimation of breeding values. To estimate the effect of fixed effects for Methods 2a/2b, the results from the 66 bivariates were averaged.
Calculation of functions of variance components
Heritabilities (h2), repeatabilities (r2) and fractions of variance due to permanent environment (c2) and rider (w2) were calcu-lated as functions of the various components using the phe-notypic variance defined as s2p ¼ s2s þ s2c þ s2o þ s2e. The functions were calculated as h2 ¼ ð4s2
sÞ=s2p;r2 ¼ ðs2
s þ s2cÞ=sp2;c2 ¼ ðs2c3s2sÞ=s2p and w2 ¼ s2o=s2p; where s2
p is the total variance, s2s is the sire variance, s2c is the residual horse variance,s2
ois the rider variance ands2eis the residual variance.
Results
Table 1 summarises the data set, giving the number of records, horses, sires, number of records by horse gender and number of riders for each discipline-grade in the data set.
Table 1Number of records, horses, sires, number of records by horse gender and number of riders for each discipline-grade in the data set (the total number of horses, sires and riders was 19 829, 3017 and 11 841, respectively)
Number of records by gender
Discipline-grade Number of records Horses Sires Stallions Geldings Mares Riders
DA 18 413 2202 1308 138 16 081 2194 1017
DI 77 943 6863 2982 1133 61 579 15 231 3301
DN 113 434 10 731 2608 1162 81 585 30 687 6079
DP 135 277 16 664 2396 814 90 788 43 675 10 767
SJA 16 405 2163 1285 126 14 325 1954 989
SJI 66 430 6380 2844 934 52 843 12 653 2969
SJN 116 304 10 625 2626 1261 83 801 31 242 5948
SJP 130 953 16 460 2392 804 87 874 42 275 10 597
XCA 14 765 2052 1235 110 12 907 1748 945
XCI 59 058 6090 2732 836 47 052 11 170 2810
XCN 106 558 10 277 2612 1150 76 991 28 417 5715
XCP 120 939 16 055 2383 747 81 357 38 835 10 315
Comparison of models
The computing resources required by the data augmentation method were extremely small compared with the bivariate methods. Overall, fitting the data augmentation model took
,7 h, compared with ,4 h for each of the 66 bivariates (i.e. 264 h in total). All runs were performed on a computer with a 2.4 GHz clock speed. The bivariate analyses were each allowed up to 4 GB of memory and the data augmentation method up to 8 GB. The differences in the (co)variances and solutions produced by the three methods were used to compare models.
Phenotypic variance
As the trait was a normal score (mean 0, standard deviation 1), the phenotypic variance is expected to be<1, depending on class sizes. Estimates of the total phenotypic variance for the three methods are shown in Tables 2 to 4. Estimates from all methods were close to the anticipated value of 1. Estimates from the data augmentation method had a greater range over the disciplines, compared with the bivariate methods, and tended to be higher within the more advanced grades.
Heritabilities
Heritability estimates for the 12 traits, as estimated by the different methods, are given in Tables 2 to 4 for the indivi-dual disciplines.
Irrespective of the method of analysis, heritabilities were significantly.0 for all traits excluding the higher grades in cross-county. Show jumping showed the greatest heritability, followed by dressage and then cross-country.
From Method 1, the advanced grade of all disciplines had the highest heritability (Tables 2 to 4). This was particularly
true for dressage (17.1%) and show jumping (22.6%). The remaining grades of dressage were very consistent (8.0% to 9.0%). For show jumping, pre-novice grade had the lowest heritability (10.6%). Note that the higher heritability esti-mates were associated with both higher phenotypic and higher genetic variance.
Comparing Methods 2a and 2b, the differences were slight, with the greatest absolute difference in heritability estimates being 1.5%, and because the standard error of the estimate was 0.9% this was likely to have been a chance occurrence. The standard errors were taken as averages over the bivariate analyses. Given this small difference, only Method 2a will be described more fully.
The pattern of magnitudes of heritability across disciplines and grades was similar to Method 1, with show jumping having the highest heritability (8.9% to 16.2%), followed by dressage (7.2% to 9.0%) and then cross-country (0.3% to 1.4%) and estimates of heritability tending to be greatest in advanced grade.
Repeatabilities
Repeatability estimates, which are the proportion of phenotypic variance explained by the horse genetics and the horse’s per-manent environment combined, represent the upper limit to the heritability. These are also given in Tables 2 to 4. Methods 2a and 2b were in good agreement. Estimates from Method 2a were highest for dressage, 24.1% to 29.8%, followed by show jumping, 15.8% to 21.0%, with cross-country being the lowest again (8.5% to 9.8%).
Although the pattern was similar for Method 1, there were differences: for dressage at advanced grade, the estimate was lower compared with the bivariates; for show jumping at advanced and intermediate grades, the estimates were
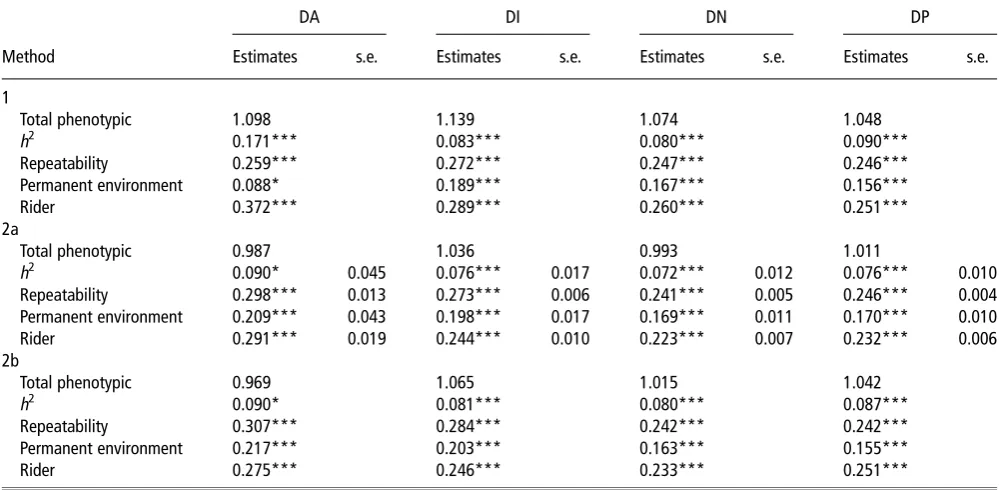
Table 2Functions of variance components for dressage as estimated by the three methods
DA DI DN DP
Method Estimates s.e. Estimates s.e. Estimates s.e. Estimates s.e.
1
Total phenotypic 1.098 1.139 1.074 1.048
h2 0.171*** 0.083*** 0.080*** 0.090***
Repeatability 0.259*** 0.272*** 0.247*** 0.246***
Permanent environment 0.088* 0.189*** 0.167*** 0.156***
Rider 0.372*** 0.289*** 0.260*** 0.251***
2a
Total phenotypic 0.987 1.036 0.993 1.011
h2 0.090* 0.045 0.076*** 0.017 0.072*** 0.012 0.076*** 0.010
Repeatability 0.298*** 0.013 0.273*** 0.006 0.241*** 0.005 0.246*** 0.004
Permanent environment 0.209*** 0.043 0.198*** 0.017 0.169*** 0.011 0.170*** 0.010
Rider 0.291*** 0.019 0.244*** 0.010 0.223*** 0.007 0.232*** 0.006
2b
Total phenotypic 0.969 1.065 1.015 1.042
h2 0.090* 0.081*** 0.080*** 0.087***
Repeatability 0.307*** 0.284*** 0.242*** 0.242***
Permanent environment 0.217*** 0.203*** 0.163*** 0.155***
Rider 0.275*** 0.246*** 0.233*** 0.251***
higher; and for all grades of cross-country, estimates were slightly higher. However, there is no evidence to suggest that these differences are statistically significant.
Horse’s permanent environmental variance
The proportion of phenotypic variance explained by the permanent environment of the horse is given in Tables 2 to 4.
The permanent environmental variance is the variance due to environmental effects that have consistently influenced the horse’s performance, such as long-term training, sta-bling, any early-life influences and also, in this analysis, the maternal effects that cannot be identified, as dams were unknown. Estimates were again very similar between Methods 2a/2b. For Method 2a, the permanent environment Table 3Functions of variance components for show jumping as estimated by the three methods
SJA SJI SJN SJP
Method Estimates s.e. Estmates s.e. Estimates s.e. Estimates s.e.
1
Total phenotypic 1.044 0.997 0.940 0.866
h2 0.226*** 0.126*** 0.134*** 0.106***
Repeatability 0.246*** 0.207*** 0.197*** 0.169***
Permanent environment 0.019 0.081*** 0.063*** 0.063***
Rider 0.140*** 0.141*** 0.126*** 0.092***
2a
Total phenotypic 0.947 0.908 0.863 0.841
h2 0.162*** 0.040 0.095*** 0.014 0.094*** 0.011 0.089*** 0.009
Repeatability 0.211*** 0.011 0.169*** 0.005 0.169*** 0.004 0.150*** 0.004
Permanent environment 0.049 0.036 0.074*** 0.013 0.075*** 0.009 0.062*** 0.007
Rider 0.113*** 0.010 0.113*** 0.006 0.091*** 0.004 0.084*** 0.003
2b
Total phenotypic 0.932 0.937 0.902 0.855
h2 0.155*** 0.090*** 0.107*** 0.104***
Repeatability 0.210*** 0.183*** 0.180*** 0.158***
Permanent environment 0.054 0.093*** 0.073*** 0.054***
Rider 0.105*** 0.120*** 0.111*** 0.088***
SJA5show jumping advanced; SJI5show jumping intermediate; SJN5show jumping novice; SJP5show jumping pre-novice. *P,0.05, **P,0.01, ***P,0.001.
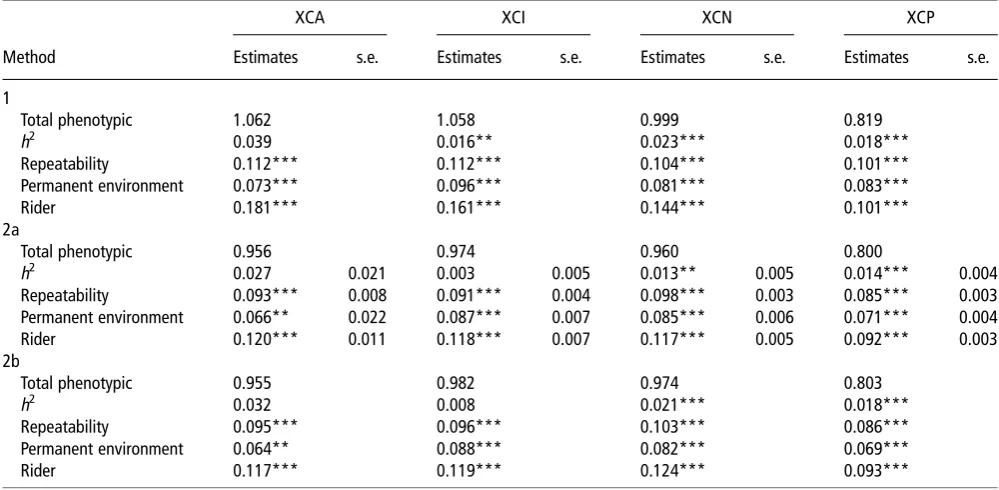
Table 4Functions of variance components for cross-country as estimated by the three methods
XCA XCI XCN XCP
Method Estimates s.e. Estimates s.e. Estimates s.e. Estimates s.e.
1
Total phenotypic 1.062 1.058 0.999 0.819
h2 0.039 0.016** 0.023*** 0.018***
Repeatability 0.112*** 0.112*** 0.104*** 0.101***
Permanent environment 0.073*** 0.096*** 0.081*** 0.083***
Rider 0.181*** 0.161*** 0.144*** 0.101***
2a
Total phenotypic 0.956 0.974 0.960 0.800
h2 0.027 0.021 0.003 0.005 0.013** 0.005 0.014*** 0.004
Repeatability 0.093*** 0.008 0.091*** 0.004 0.098*** 0.003 0.085*** 0.003
Permanent environment 0.066** 0.022 0.087*** 0.007 0.085*** 0.006 0.071*** 0.004
Rider 0.120*** 0.011 0.118*** 0.007 0.117*** 0.005 0.092*** 0.003
2b
Total phenotypic 0.955 0.982 0.974 0.803
h2 0.032 0.008 0.021*** 0.018***
Repeatability 0.095*** 0.096*** 0.103*** 0.086***
Permanent environment 0.064** 0.088*** 0.082*** 0.069***
Rider 0.117*** 0.119*** 0.124*** 0.093***
accounted for 16.9% to 20.9% of phenotypic variance in dressage compared with 4.9% to 7.5% in show jumping and 6.6% to 8.7% in cross-country. The large estimate for the influence of permanent environment on dressage perfor-mance compared with show jumping explains why the repeatability is estimated to be greater for dressage, yet its heritability appeared smaller.
For Method 1, estimates were consistent with Methods 2a/2b, with the exception of advanced grades in dressage and show jumping, which were noticeably smaller. For dressage, estimates ranged from 8.8% to 18.9% and for show jumping from 16.9% to 24.6%.
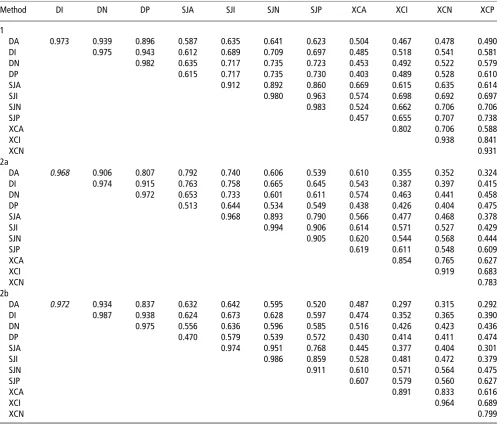
Rider variances as a proportion of total variance
The estimates of variance due to the rider were very similar when estimated by Methods 2a and 2b. The maximum absolute difference in the estimates was 2.7% of total pheno-typic variance (standard error on rider variance was 0.6%). The proportion of variance due to the rider, as estimated by Method 2a, was 22.3% to 29.1% for dressage, 8.4% to 11.3% for show jumping and 9.2% to 12.0% for cross-country. Estimates by Method 1 tended to be greater in magnitude than Method 2a/2b estimates.
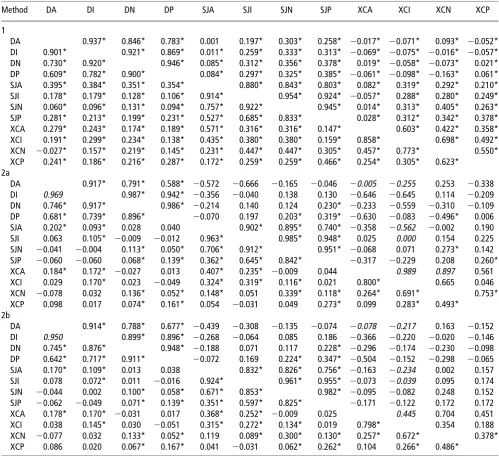
Genetic correlations
Genetic correlations are presented in Table 5. Correlations within grades were all significant. For dressage, these ranged from 0.783 to 0.946; for show jumping, from 0.803 to 0.954; and for cross-country, from 0.358 to 0.698. There was a clear pattern that correlations between sequential grades were higher than those between more distant grades. Results from Methods 2a and 2b were very similar. For both methods, genetic correlations between the grades were significantly dif-ferent from zero for dressage and show jumping, positive and high (for dressage 0.59 to 0.99, for show jumping 0.74 to 0.99). For cross-country, there is a need for greater caution as genetic correlations between the grades were only significantly differ-ent from zero between novice and pre-novice, with an estimate of 0.75. This provides evidence that for dressage and show jumping, and at least within lower grades of cross-country, within the discipline, the same loci (or loci in linkage dis-equilibrium) are predominantly responsible for performance at the different grades.
For Method 1, correlations between disciplines were largely significant. Between show jumping and dressage, significant correlations ranged from 0.011 to 0.385, but estimated corre-lations between cross-country and other disciplines appeared more heterogeneous in sign ranging from 20.163 to 0.093 for dressage. By contrast, from Methods 2a and 2b between-discipline correlations were largely not significant, but also of varied sign and magnitude. Correlations between the lower grades of dressage and show jumping were statistically sig-nificant, positive but low, and a low significant correlation between show jumping and XCP and XCN was found. Esti-mates for dressage and cross-country were indicative of there being negative correlations of moderate magnitude. For Method 2b, comparing the genetic correlation matrix before
and after bending (considering only estimates that were sig-nificantly different from zero in the positive definite matrix), the average absolute change was 0.054.
Horse and rider correlations
Correlations for the horse (representing the permanent environment and 33the sire genetic component) between grades and within disciplines were all significant and generally high (Table 5). Rider correlations are in Table 6.
From Model 1, correlations between disciplines were largely significant, although low/moderate. Correlations between show jumping and cross-country were slightly higher than between other disciplines. Rider correlations were all significant. Within-discipline correlations were very high. Between-discipline correlations were moderate/high, although slightly lower between dressage and cross-country compared with the other disciplines.
By Method 2b, horse correlations within disciplines were 0.64 or more for dressage, but showed a greater range of 0.36 to 0.96 for show jumping and 0.10 to 0.80 for cross-country. The correlation structures were clearly banded, with high or moderate correlations observed between adjacent grades, lower correlations between grades once removed and lowest between pre-novice and advanced. Significant correla-tions between disciplines were positive but low. In general, rider correlations, both within and between disciplines, were significant. Within-discipline correlations were high, and between-discipline correlations were generally moderate.
Comparison of correlation estimates between Method 2a and Method 1
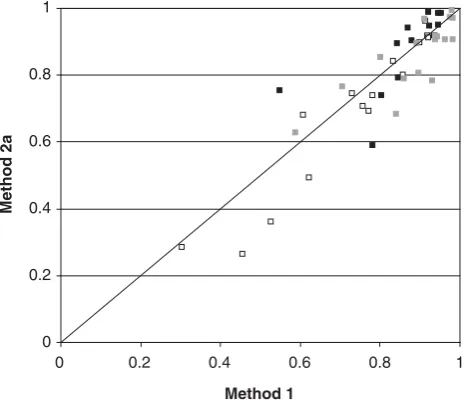
Figure 1 shows a more detailed comparison of methods restricted to estimates that were within discipline and statisti-cally different from 0 (based on s.e.). The genetic correlations, once away from 1, showed more scatter, probably because of their greater sampling error. The horse correlations, comprising both the genetic and permanent environment, were broadly in agreement between the methods, with no evidence of consistent bias. For the rider correlations, again there was no evidence of a consistent bias between methods.
Between-discipline correlations were different (not shown). There was a consistent trend for Method 1 to estimate genetic correlations or horse correlations that were larger than for Method 2a (with the comparison restricted to those that were judged to be statistically significant). The same was true for rider correlations, with the exception of correlations including some of the more advanced grades, where estimates by Method 2a were often higher than Method 1.
Fixed effects of gender and age
performed better than mares, and mares better than stallions. For the Methods 2a and 2b, there were no discernable differ-ences for cross-country.
For all models and all traits, there was a significant quadratic association between performance and age, indicat-ing a curvilinear increase in performance with age. Figures 2 to 4 illustrate the change in performance with age, using example results from the bivariate analyses. As might be predicted, performance in the more advanced grades peaked at a later age. For all disciplines, similar patterns were observed, although between disciplines peak performance between grades varied and was least pronounced in show jumping.
Discussion
There is a demand for tools to estimate (co)variance matrices for a large number of traits in an acceptable time frame. The current test day model used by the dairy cattle industry in the United Kingdom requires a 27327 (co)variance matrix, and other industries may desire even larger matrices. For exam-ple, a BLUP with 100 traits would be ideal for the silvicultural objectives of Skogforsk (the Forestry Research Institute of Sweden; B. Andersson, personal communication, December 2010). A rapid analysis would enable easy re-estimation of (co)variance matrices, rather than the current situation Table 5Horse (below diagonal) and genetic (above diagonal) correlation matrices for the 12 traits, as estimated by the three different methods
Method DA DI DN DP SJA SJI SJN SJP XCA XCI XCN XCP
1
DA 0.937* 0.846* 0.783* 0.001 0.197* 0.303* 0.258* 20.017* 20.071* 0.093* 20.052* DI 0.901* 0.921* 0.869* 0.011* 0.259* 0.333* 0.313* 20.069* 20.075* 20.016* 20.057* DN 0.730* 0.920* 0.946* 0.085* 0.312* 0.356* 0.378* 0.019* 20.058* 20.073* 0.021* DP 0.609* 0.782* 0.900* 0.084* 0.297* 0.325* 0.385* 20.061* 20.098* 20.163* 0.061*
SJA 0.395* 0.384* 0.351* 0.354* 0.880* 0.843* 0.803* 0.082* 0.319* 0.292* 0.210*
SJI 0.178* 0.179* 0.128* 0.106* 0.914* 0.954* 0.924* 20.057* 0.288* 0.280* 0.249*
SJN 0.060* 0.096* 0.131* 0.094* 0.757* 0.922* 0.945* 0.014* 0.313* 0.405* 0.263*
SJP 0.281* 0.213* 0.199* 0.231* 0.527* 0.685* 0.833* 0.028* 0.312* 0.342* 0.378*
XCA 0.279* 0.243* 0.174* 0.189* 0.571* 0.316* 0.316* 0.147* 0.603* 0.422* 0.358*
XCI 0.191* 0.299* 0.234* 0.138* 0.435* 0.380* 0.380* 0.159* 0.858* 0.698* 0.492*
XCN 20.027* 0.157* 0.219* 0.145* 0.231* 0.447* 0.447* 0.305* 0.457* 0.773* 0.550* XCP 0.241* 0.186* 0.216* 0.287* 0.172* 0.259* 0.259* 0.466* 0.254* 0.305* 0.623*
2a
DA 0.917* 0.791* 0.588* 20.572 20.666 20.165 20.046 20.005 20.255 0.253 20.338
DI 0.969 0.987* 0.942* 20.356 20.040 0.138 0.130 20.646 20.645 0.114 20.209
DN 0.746* 0.917* 0.986* 20.214 0.140 0.124 0.230* 20.233 20.559 20.310 20.109 DP 0.681* 0.739* 0.896* 20.070 0.197 0.203* 0.319* 20.630 20.083 20.496* 0.006
SJA 0.202* 0.093* 0.028 0.040 0.902* 0.895* 0.740* 20.358 20.562 20.002 0.190
SJI 0.063 0.105* 20.009 20.012 0.963* 0.985* 0.948* 0.025 0.000 0.154 0.225
SJN 20.041 20.004 0.113* 0.050* 0.706* 0.912* 0.951* 20.068 0.071 0.273* 0.142 SJP 20.060 20.060 0.068* 0.139* 0.362* 0.645* 0.842* 20.317 20.229 0.208 0.260*
XCA 0.184* 0.172* 20.027 0.013 0.407* 0.235* 20.009 0.044 0.989 0.897 0.561
XCI 0.029 0.170* 0.023 20.049 0.324* 0.319* 0.116* 0.021 0.800* 0.665 0.046
XCN 20.078 0.032 0.136* 0.052* 0.148* 0.051 0.339* 0.118* 0.264* 0.691* 0.753*
XCP 0.098 0.017 0.074* 0.161* 0.054 20.031 0.049 0.273* 0.099 0.283* 0.493* 2b
DA 0.914* 0.788* 0.677* 20.439 20.308 20.135 20.074 20.078 20.217 0.163 20.152 DI 0.950 0.899* 0.896* 20.268 20.064 0.085 0.186 20.366 20.220 20.020 20.146 DN 0.745* 0.876* 0.948* 20.188 0.071 0.117 0.228* 20.296 20.174 20.230 20.098 DP 0.642* 0.717* 0.911* 20.072 0.169 0.224* 0.347* 20.504 20.152 20.298 20.065
SJA 0.170* 0.109* 0.013 0.038 0.832* 0.826* 0.756* 20.163 20.234 0.002 0.157
SJI 0.078 0.072* 0.011 20.016 0.924* 0.961* 0.955* 20.073 20.039 0.095 0.174
SJN 20.044 0.002 0.100* 0.058* 0.671* 0.853* 0.982* 20.095 20.082 0.248 0.152
SJP 20.062 20.049 0.071* 0.139* 0.351* 0.597* 0.825* 20.171 20.122 0.172 0.172
XCA 0.178* 0.170* 20.031 0.017 0.368* 0.252* 20.009 0.025 0.445 0.704 0.451
XCI 0.038 0.145* 0.030 20.051 0.315* 0.272* 0.134* 0.019 0.798* 0.354 0.188
XCN 20.077 0.032 0.133* 0.052* 0.119 0.089* 0.300* 0.130* 0.257* 0.672* 0.378*
XCP 0.086 0.020 0.067* 0.167* 0.041 20.031 0.062* 0.262* 0.104 0.266* 0.486*
DA5dressage advanced; DI5dressage intermediate; DN5dressage novice; DP5dressage pre-novice; SJA5show jumping advanced; SJI5show jumping intermediate; SJN5show jumping novice; SJP5show jumping pre-novice; XCA5cross-country advanced; XCI5cross-country intermediate; XCN5cross-country novice; XCP5cross-country pre-novice.
where in many genetic evaluation systems, due to comput-ing overheads, the (co)variance components are not re-estimated regularly and BLUP re-estimated breeding values (EBVs) are being produced based on variance components compiled using ad hoc methods from old data. Therefore, any method offering an advance in such methodology would have important applications.
We compared three methods of producing large (co)var-iance matrices for genetic evaluations, using a data set of results from eventing competitions in the United Kingdom. Two methods that combined smaller sub-matrices from bivariate analyses were investigated: (i) Method 2a, a novel method based on Wallet al. (2005) that generates samples of each bivariate distribution to perform a multivariate analysis and obtain a positive definite 12312 (co)variance
matrix and (ii) Method 2b, spectral decomposition of the matrix of mean results replacing negative eigenvalues with positive values to obtain a positive definite (co)variance matrix. The latter is likely to be relatively well applied in practice. The two ‘bivariate’ methods, differing only in the way that the bivariate matrices were combined, gave, in this case, very similar results for functions of variance compo-nents. Method 1 was the novel data augmentation function in ASReml. The multivariate nature of Method 1 will result in greater accuracy (with the increase in accuracy determined by the absolute differences between the residual and genetic correlations between traits).
(Co)variance estimates and functions of variance compo-nents produced by the three methods were in general similar. Correlation estimates were more often significant for Method 1, Table 6Rider correlation matrices for the 12 traits, as estimated by the three different methods
Method DI DN DP SJA SJI SJN SJP XCA XCI XCN XCP
1
DA 0.973 0.939 0.896 0.587 0.635 0.641 0.623 0.504 0.467 0.478 0.490
DI 0.975 0.943 0.612 0.689 0.709 0.697 0.485 0.518 0.541 0.581
DN 0.982 0.635 0.717 0.735 0.723 0.453 0.492 0.522 0.579
DP 0.615 0.717 0.735 0.730 0.403 0.489 0.528 0.610
SJA 0.912 0.892 0.860 0.669 0.615 0.635 0.614
SJI 0.980 0.963 0.574 0.698 0.692 0.697
SJN 0.983 0.524 0.662 0.706 0.706
SJP 0.457 0.655 0.707 0.738
XCA 0.802 0.706 0.588
XCI 0.938 0.841
XCN 0.931
2a
DA 0.968 0.906 0.807 0.792 0.740 0.606 0.539 0.610 0.355 0.352 0.324
DI 0.974 0.915 0.763 0.758 0.665 0.645 0.543 0.387 0.397 0.415
DN 0.972 0.653 0.733 0.601 0.611 0.574 0.463 0.441 0.458
DP 0.513 0.644 0.534 0.549 0.438 0.426 0.404 0.475
SJA 0.968 0.893 0.790 0.566 0.477 0.468 0.378
SJI 0.994 0.906 0.614 0.571 0.527 0.429
SJN 0.905 0.620 0.544 0.568 0.444
SJP 0.619 0.611 0.548 0.609
XCA 0.854 0.765 0.627
XCI 0.919 0.683
XCN 0.783
2b
DA 0.972 0.934 0.837 0.632 0.642 0.595 0.520 0.487 0.297 0.315 0.292
DI 0.987 0.938 0.624 0.673 0.628 0.597 0.474 0.352 0.365 0.390
DN 0.975 0.556 0.636 0.596 0.585 0.516 0.426 0.423 0.436
DP 0.470 0.579 0.539 0.572 0.430 0.414 0.411 0.474
SJA 0.974 0.951 0.768 0.445 0.377 0.404 0.301
SJI 0.986 0.859 0.528 0.481 0.472 0.379
SJN 0.911 0.610 0.571 0.564 0.475
SJP 0.607 0.579 0.560 0.627
XCA 0.891 0.833 0.616
XCI 0.964 0.689
XCN 0.799
DI5dressage intermediate; DA5dressage advanced; DN5dressage novice; DP5dressage pre-novice; SJA5show jumping advanced; SJI5show jumping intermediate; SJN5show jumping novice; SJP5show jumping pre-novice; XCA5cross-country advanced; XCI5cross-country intermediate; XCN5cross-country novice; XCP5cross-country pre-novice.
which may be partially due to the fact that standard errors for these values were approximate values.
As the trait was a normal score (mean 0, standard devia-tion 1), the variance of each trait would be expected to be
<1, depending on class sizes. In the data augmentation analysis, the increase in phenotypic variance with grade within a discipline could be explained by the fact that Method 1 was a 12-trait analysis, with information on per-formance at all grades included and thus the analysis at least partly accounts for selection between grades, as well as producing more accurate variance component estimates. It would also be feasible to obtain phenotypic variances.1 when analysing heritable traits with substantial inbreeding with a pedigree of many generations in depth. However, in this analysis, it was only possible to use a sire model that makes no allowances for inbreeding.
No formal comparison of the fits of the models could be performed. The three methods produced largely consistent
results. Methods 2a and 2b are suitable for implementation and will produce large, positive definite (co)variance matri-ces, but require large computing resources. Method 1 pro-duced results that were generally consistent with Methods 2a and 2b. Method 1 enables the production of large (co)v-ariance matrices in a computationally efficient way, and harvests the full benefits of a multivariate analysis. Differ-ences in variance component estimates between Methods 1 and 2a/2b may be due to the increased accuracy of Method 1, a result of the multivariate nature of the analysis.
The heritability estimates for the dressage phase of the competition are comparable with estimates for the individual competition discipline in GB, which were 0.15 (s.e. 0.018) when breed is not accounted for (Stewartet al., 2010), and also with international estimates. For example, heritabilities ranging from 0.10 to 0.20 have been estimated in various breeds (see Huizinga and Van Der Meij, 1989; Ricardet al., 2000; Ducro et al., 2007; Janssens, 2008; Olsson et al., 2008). Similarly, heritability estimates for show jumping are comparable to international estimates for competition data, ranging from 0.10 (Hanoverian, Trakehner, Oldenburg; Janssens, 2008) through 0.20 in Dutch Warmbloods (Huizinga and Van Der Meij, 1989) to 0.27 in the Swedish Warmblood (Olsson, 2008).
0 0.2 0.4 0.6 0.8 1
0 0.2 0.4 0.6 0.8 1
Method 1
Method 2a
Figure 1 Estimates of correlations within grades for the genetic (black), horse (white) and rider (grey) effects plotted for Method 1v. 2a. Only correlations where standard errors indicated that values were significantly different from zero are included.
-0.4 -0.3 -0.2 -0.1 0.0 0.1 0.2 0.3
4 5 6 7 8 9 10 11 12 13 14 15 16 17 18 19 20
Age
Performance (-1*normal score)
advanced intermediate novice prenovice
Figure 2 Performance with age for each grade of dressage.
-0.3 -0.3 -0.2 -0.2 -0.1 -0.1 0.0 0.1 0.1 0.2
4 5 6 7 8 9 10 11 12 13 14 15 16 17 18 19 20
Age
Performance (-1*normal score)
advanced intermediate novice prenovice
Figure 3 Performance with age for each grade of show jumping.
-0.6 -0.5 -0.4 -0.3 -0.2 -0.1 0.0 0.1 0.2 0.3
4 5 6 7 8 9 10 11 12 13 14 15 16 17 18 19 20
Age
P
e
rf
ormance (-1*normal score)
advanced intermediate novice prenovice
The genetic variation detected in the analysis for cross-country was low and to some extent it may be masked by greater environmental variance. Improved pedigree data may help to elucidate the genetic variation further. However, our results indicate that in a selection programme, the greatest genetic gain can be achieved in show jumping, followed by dressage, and that little gain will be made in cross-country. Therefore, a breeding programme designed to select for eventing competition performance in GB will be best suited to select for the show jumping or dressage phases of the competition. Even if this were considered as a phenotypic selection rather than a selection for breeding, performance at lower grades was a poorer predictor of per-formance at high grade for cross-country than for show jumping or dressage. At present in the United Kingdom, the situation in practice is directly contrary to this, as breeders of eventing horses tend to consider cross-country performance as the primary selection aim (J. Rogers, personal commu-nication, May 2010). This traditional practice is derived from the origins of the discipline that originated in the Military and was dominated by cross-country. Greater weighting was placed on cross-country, with requirements for dressage and show jumping lower. The dressage phase was aimed at increasing the control the rider has over the horse, and the show jumping phase was used to test the recovery of the horse after a cross-country competition. More recently, because of international influences, the regulation of the discipline has changed. A lower weight has been given to cross-country, which is judged to be too dangerous and less and less con-forming to animal welfare regulations. This has changed the type of horses needed to compete in this discipline.
Within the disciplines of dressage and show jumping, correlations between the grades were high, indicating that the same loci (or loci in linkage disequilibrium) are respon-sible for performance at the different grades, and therefore selection for performance in one grade also selects for per-formance in another grade. Analogous correlations between the grades for cross-country were estimated by Method 1 as significantly different from zero but more moderate; results by Methods 2a/2b were harder to estimate partly due to a lack of genetic variance detected, particularly in the higher grades.
Overall, the results from the data augmentation method indicate that selection for performance in dressage will improve performance in show jumping and that performance in show jumping will improve performance in cross-country. There was an indication that selection for dressage merit would reduce the merit for cross-country. Higher correlations between the lower grades may be due to general traits that jointly affect performance in both, that is, an amateur horse that is athletic and with good temperament should have good ability, at lower levels of competition, in all disciplines. However, at the highest grade of competition these effects are less apparent, where more specific traits, such as the gaits and jumping, have more influence on performance.
Variance components due to the horse and rider were considered separate random effects. This was possible because of the fact that one rider often rode multiple horses,
and that many horses were ridden by multiple riders. If the latter were not true, different treatments of the rider effect within the model could be considered. For instance, a hier-archical model (of horse within rider) could be used. Alter-natively, rider could have been included as a fixed effect.
Gender effects for show jumping and particularly dressage found indication of an advantage for stallions. Given that stallions are a selection of the male population retained for breeding, this is understandable. However, gender effects were often not significant. It was surprising that no gender effect was detected for cross-country, as there is clear evi-dence of an advantage for males as evievi-denced for racing (Entin, 2008).
The analysis was restricted to a sire model, and thus genetic connections were limited (restricted to within half-sib groups). Although this was sufficient to proceed with the analysis, the precision of the estimates of variance compo-nents and EBVs will have been reduced, with this reduction reflected in the standard errors. Assortative mating was not accounted for, possibly inflating the sire variance component, and overestimating EBVs for superior sires (and under-estimating for inferior sires). Selection and inbreeding were also not accounted for. In horse populations, the assumption of random mating rarely holds. Selection has been practised over time and non-random mating occurs, in that superior horses tend to be mated as do inferior horses, and there may be specialised breeding for the different disciplines. Another potential problem is the selection of horses present in the data. The consequence of this will be to reduce heritability estimates. The breeding objective for the British sport horse is to cater for both professional elite levels of competition and riders, as well as amateur riders. Traits such as athleticism, soundness, rideability and conformation suitable for competing in a range of disciplines, including dressage, show jumping and eventing, are required. The data augmentation 12-trait analysis enables all traits to be considered in the analysis, and thus the accuracy of breeding values is maximised. The results for the analysis suggest that there are positive genetic correlations between dressage and show jumping and show jumping and eventing, indicating that selection for one discipline will also enhance performance in another. However, correlations between eventing and dressage were sometimes negative. The British sport horse has made its name in eventing competition, and thus selection for this discipline may reduce performance in dressage.
Twelve breeding values for each of the discipline-grade traits are now available. These can be combined into an index for overall competition performance, with weightings depending on the breeding purpose. In breeding for elite levels of com-petition, performance at the more advanced grades is impor-tant. However, a main aim of sport horse breeding in the United Kingdom is to produce horses for amateur and young riders, which constitute the vast majority of the riding and competing population, and for which traits such as temperament and general ability have most influence. The accuracy of the breeding values at lower and intermediate levels of competition is likely to be higher, as the accuracy of breeding values is dependent on the number of records. At advanced grade, a horse may compete far less than at lower grades (possibly only four times per year), resulting in fewer records and hence lower accuracies for advanced breeding values.
In conclusion, this work investigated three methods of estimating large (co)variance matrices. Two of these meth-ods, based upon bivariate analysis, are computing intensive but reliable and appropriate for implementation at present. The third method (using data augmentation) requires far fewer computing resources, is much quicker to run, and will be valuable in the future for the production of large (co)variance matrices.
Acknowledgements and funding
The authors would like to thank BBSRC, British Equestrian Federation (BEF) and Biosciences KTN for funding and British Eventing for providing data. This work has made use of the resources provided by the Edinburgh Compute and Data Facility (ECDF; http://www.ecdf.ed.ac.uk/). The ECDF is partially sup-ported by the eDIKT initiative (http://www.edikt.org.uk).
References
Clayton D and Rasbash J 1999. Estimation in large crossed random-effect models by data augmentation. Journal of the Royal Statistical Society, Series A 162, 425–436.
Ducro BJ, Koenen EPC, van Tartwijk JMFM and van Arendonk JAM 2007. Genetic relations of first stallion inspection traits with dressage and show-jumping performance in competition of Dutch warmblood horses. Livestock Science 107, 81–85.
Entin P 2008. Do racehorses and Greyhound dogs exhibit a gender difference in running speed? Equine and Comparative Exercise Physiology 4, 135–140. Gilmour AR, Gogel BJ, Cullis BR and Thompson R 2009. ASReml user guide release 3.0. VSN International Ltd, Hemel Hempstead, UK. www.vsni.co.uk.
Higham NJ 2002. Computing the nearest correlation matrix – a problem from finance. IMA Journal of Numerical Analysis 22, 329–343.
Hill WG and Thompson R 1978. Probabilities of non-positive definite between-group or genetic covariance matrices. Biometrics 34, 429–439.
Huizinga HA and Van Der Meij GJW 1989. Estimated parameters of performance in jumping and dressage competition of the Dutch Warmblood horse. Livestock Production Science 21, 333–345.
Janssens S 2008. Breeding programs and estimated breeding values. Retrieved May 12, 2011, from http://www.biw.kuleuven.be/genlog/livgen/chgs_is_Breed-prog.html
Kearsley CGS, Woolliams JA, Coffey MP and Brotherstone S 2008. Use of competition data for genetic evaluations of eventing horses in Britain: analysis of the dressage, showjumping and cross country phases of eventing competition. Livestock Science 118, 72–81.
Knol DL and Ten Berge JMF 1989. Least-squares approximation of an improper correlation matrix by a proper one. Psychometrika 54, 53–61.
Langlois B 1980. Estimation de la valeur ge´ne´tique des chevaux de sport d’apre`s les sommes gagne´es dans les compe´titions e´questres franc¸aises. Annales de Ge´ne´tique et de Se´lection Animale 12, 15–31.
Mantysaari EA 2004. Multiple-trait across-country evaluations using singular (co)variance matrix and random regression model. Proceedings of the 2004 Interbull Meeting Sousse, Tunisia, 4pp.
Misztal I 2008. Reliable computing in estimation of variance components. Journal of Animal Breeding and Genetics 125, 363–370.
Olsson E, Na¨sholm A, Strandberg E and Philipsson J 2008. Use of field records and competition results in genetic evaluation of station performance tested Swedish warmblood stallions. Livestock Science 117, 287–297.
Ricard A and Chanu I 2001. Genetic parameters of eventing horse competition in France. Genetics Selection Evolution 33, 175–190.
Ricard A, Bruns E and Cunningham EP 2000. Genetics of performance traits. In The Genetics of the Horse (ed. AT Bowling and A Ruvinsky), pp. 411–438. CABI Publishing, Wallingford, UK.
Royston JP 1982. Expected normal-order statistics (exact and approximate). Journal of the Royal Statistical Society. Series C 31, 161–165.
Sorensen AC, Pong-Wong R, Windig JJ and Woolliams JAW 2002. Precision of methods for calculating identity-by-descent matrices using multiple markers. Genetics Selection Evolution 34, 557–579.
Stewart ID, Woolliams JA and Brotherstone S 2010. Genetic evaluation of horses for performance in dressage competitions in Great Britain. Livestock Science 128, 36–45.
Stock KF, Hoeschele I and Distl O 2007. Estimation of genetic parameters and prediction of breeding values for multivariate threshold and continuous data in a simulated horse population using Gibbs sampling and residual maximum likelihood. Journal of Animal Breeding and Genetics 124, 308–319.
Thompson R 1994. Integrating best linear unbiased prediction and maximum likelihood estimation. Fifth World Congress on Genetics Applied to Livestock Production 18, 337–340.
Thore´n Hellsten E, Viklund A˚, Koenen EPC, Ricard A, Bruns E and Philipsson J 2006. Review of genetic parameters estimated at stallion and young horse performance tests and their correlations with later results in dressage and show-jumping competition. Livestock Science 103, 1–12.