VOLUME 36, ARTICLE 41, PAGES 1209
−
1254
PUBLISHED 13 APRIL 2017
http://www.demographic-research.org/Volumes/Vol36/41/ DOI: 10.4054/DemRes.2017.36.41
Research Article
Childbearing among first- and
second-generation Russians in Estonia against the
background of the sending and host countries
Allan Puur
Leen Rahnu
Liili Abuladze
Luule Sakkeus
Sergei Zakharov
This publication is part of the Special Collection on “Childbearing among the Descendants of Immigrants in Europe,” organized by Guest Editors Hill Kulu and Tina Hannemann.
©2017 Puur, Rahnu, Abuladze, Sakkeus & Zakharov.
This open-access work is published under the terms of the Creative Commons Attribution NonCommercial License 2.0 Germany, which permits use, reproduction & distribution in any medium for non-commercial purposes, provided the original author(s) and source are given credit.
1 Introduction 1210
2 Theoretical perspectives and previous findings 1212
3 The context of the study 1215
3.1 Russians in Estonia 1215
3.2 Fertility trends in Estonia and Russia 1216
4 Research aim and hypotheses 1217
5 Data and methods 1218
6 Results 1221
6.1 Transition to motherhood 1221
6.2 Transition to second birth 1224
6.3 Transition to third birth 1226
6.4 Factors associated with convergence with host-country pattern 1228
7 Summary and discussion of the findings 1229
8 Acknowledgements 1233
References 1235
Childbearing among first- and second-generation Russians in
Estonia against the background of the sending and host countries
Allan Puur1 Leen Rahnu2 Liili Abuladze2 Luule Sakkeus2 Sergei Zakharov3
Abstract
BACKGROUND
An expanding literature documents the childbearing patterns of migrants and their descendants in contemporary Europe. The existing evidence pertains mainly to the northern, western, and southern regions of the continent, while less is known about the fertility of migrants who have moved between the countries of Eastern Europe.
OBJECTIVE
The aim of this study is to examine the fertility patterns of first- and second-generation Russians in Estonia, relative to the sending and host populations.
METHODS
The study draws on the Estonian and Russian Generations and Gender Surveys. Proportional hazards models are estimated for the transitions to first, second, and third births.
RESULTS
Russian migrants in Estonia exhibit greater similarity to the sending population, with a lower propensity for having a second and third birth than the host population. This pattern extends to the descendants of migrants. However, mixed Estonian-Russian parentage, enrolment in Estonian-language schools, and residence among the host population are associated with the convergence of Russians’ childbearing behaviour
1
Corresponding author: Estonian Institute for Population Studies, Tallinn University, Estonia. E-Mail:
2
Estonian Institute for Population Studies, Tallinn University, Estonia.
with the host-country patterns. The findings support the cultural maintenance and adaptation perspectives; selectivity was found to be less important.
CONTRIBUTION
The study focuses on a previously under-researched context and underscores the importance of contextual factors in shaping migrants’ fertility patterns. It raises the possibility that, depending on the childbearing trends and levels among the sending and receiving populations, large-scale migration may reduce rather than increase aggregate fertility in the host country. With the advancement of the fertility transition in sending countries, this situation may become more common in Europe in the future.
1. Introduction
During the period following the Second World War, European societies experienced a large influx of migrants (Castles, de Haas, and Miller 2014). For the major receiving countries, the youthful age structure of the migrants made a significant contribution to maintaining a positive balance between births and deaths, and moderated the tempo of population ageing. Owing to their large numbers, immigrants and their descendants have resulted in European societies becoming increasingly heterogeneous in terms of cultural background, and made the advancement of integration an important policy issue (Coleman 2006; 2009).
this reason, research on migrants and their descendants can contribute to an improved understanding of how economic and cultural factors influence fertility decisions.
Our study complements the existing literature by analysing the childbearing behaviour of Russians in Estonia. We examine the extent to which their fertility patterns are similar to those of the sending and host populations. For this purpose, we distinguish between first-generation Estonian Russians and their descendants, who were born and raised in different contexts. In order to understand the process of demographic integration, we seek evidence of factors that facilitate the shift of migrants and their descendants’ fertility behaviour towards the host-country patterns. We make a comparative analysis of the transition to first, second, and third births among the migrant and non-migrant groups included in the study, employing longitudinal data and event history methods.
2. Theoretical perspectives and previous findings
Several complementary mechanisms have been proposed to explain childbearing patterns among migrant groups (for a recent overview, see Kulu and González-Ferrer 2014). Following the approach employed in the literature whereby a single study seldom considers all possible mechanisms, this article focuses on the cultural maintenance, adaptation, selection, and composition perspectives, which can be applied to migrants as well as their descendants. Applicability beyond the first generation sets these perspectives apart from several others (disruption, interrelation of events, legitimacy) that focus solely on the short-term impact of the move. Also, the cultural maintenance, adaptation, and selection perspectives primarily relate to differences in the quantum of fertility, which is the main focus of this study.
As childbearing norms and values are transmitted from one generation to the next (Barber 2001; Murphy and Knudsen 2002; Kolk 2014), the fertility patterns inherited from the country of ancestry may persist among migrants and the descendants of migrants. In the literature, the latter phenomenon is termed ‘cultural maintenance’ (Abbasi-Shavazi and McDonald 2002). The continuity of ethnic childbearing differences across generations is also central to the subculture hypothesis, which was originally developed in order to account for the higher fertility of ethnic minority groups in the US (Goldscheider and Uhlenberg 1969; Roberts and Lee 1974). From another point of view, cultural maintenance is also associated with the socialisation perspective (Andersson 2004; Kulu and Milewski 2007; Milewski 2010). The latter emphasises the role of norms, values, and behavioural patterns to which migrants have been exposed during childhood, and assumes that these influences have a lasting impact over the life course. According to the socialisation perspective, international migrants tend to maintain the childbearing patterns that are characteristic of their country of origin, even if they differ from those prevailing in the host society. As the descendants of migrants are exposed to the norms, values, and behavioural patterns of their parents, socialisation can be viewed as a mechanism that enables cultural maintenance. Socialisation to ethnic subcultures has been considered in European studies as a way to explain fertility patterns among the descendants of migrants that have limited convergence with those prevailing in the host societies (Milewski 2010, 2011; Dubuc 2012).
First, the general social and economic conditions in the host country are assumed to affect the cost of childbearing (Becker 1981; Hotz, Klerman, and Willis 1997) in a similar manner for all subgroups of the population. Second, through exposure to the host society and social interaction, immigrants are believed to adopt the norms and values prevailing in the destination country (Hirschman 1983; Alba 2005). Shifts in preferences concerning family size and the timing of childbearing are assumed to bring about the convergence of migrants’ fertility behaviour with the host-country patterns. The adaptation perspective is also applicable to the descendants of migrants, as convergence with the host-country behaviours may extend across several generations.
The empirical results of studies of childbearing among migrants and their descendants lend support to both the cultural maintenance and adaptation perspectives. Many studies have found that a substantial similarity in fertility levels may be achieved within a relatively short span of time following the arrival of migrants in the host country (Rindfuss 1976; Ford 1990; Mayer and Ripbahn 2000; Andersson 2004). At the same time, the persistence of differences in fertility between migrant groups and the host population, even after controlling for demographic and socioeconomic composition, supports the cultural maintenance argument. In Europe, larger differences are characteristic of migrants from high-fertility settings (Andersson and Scott 2007; Coleman and Dubuc 2010; Milewski 2011). The descendants of migrants from high-fertility contexts tend to have lower high-fertility levels than their parents’ generation, usually between those of the latter and the natives of the host society (Milewski 2007, 2010; Garssen and Nicolaas 2008; Dubuc 2012; Scott and Stanfors 2011; Krapf and Wolf 2015). Similar findings for second-generation migrants are also reported in the United States and Australia (Kahn 1988; Stephen and Bean 1992; Landale and Hauan 1996; Abbasi-Shavazi and McDonald 2000; 2002; Khoo et al. 2002; Parrado and Morgan 2008). Evidence in support of the cultural maintenance and socialisation perspectives also comes from studies that have incorporated country-of-origin fertility levels directly into the multivariate models (Kahn 1988; Cygan-Rehm 2011; Stichnoth and Yeter 2013).
The intermediate position of the second generation reported in many empirical studies indicates that adaptation and cultural maintenance are complementary rather
than mutually exclusive.4 Among the descendants of migrants, childbearing decisions
are shaped not only by the host society in which they grew up, but also by their parents’ values and norms. It follows that the fertility patterns of the second generation depend on the strength of these competing influences. If the impact of the host society exceeds that of the subgroup, the fertility of the migrants’ descendants converges with the
host-4
country pattern. By contrast, if the influence of the subculture prevails, the second generation exhibits behaviours that are closer to their parents’. This supports the argument that the integration of second-generation migrants may be a segmented process: the descendants of migrants may follow varying paths of adaptation, depending on their parents’ human and social capital, and on modes of incorporation into the host society (Zhou 1997; Portes, Fernandez-Kelly, and Haller 2009; Haller, Portes, and Lynch 2011).
Previous research has also provided evidence of specific factors that can facilitate (or hinder) the adaptation of migrants’ and their descendants’ fertility to native patterns (Forste and Tienda 1996). Fluency in the host-country language appears to play a salient role in reducing fertility among migrants who move from high- to low-fertility settings, and their descendants (Kahn 1988; Swicegood et al. 1988; Kulu and Hannemann 2016). For the second generation, research has revealed the importance of the main language spoken in the parental home (Pailhé 2015). Further, the residential concentration of migrants and ethnic minorities has long been associated with the maintenance of distinctive behavioural patterns. For the United States, Fischer and Marcum (1984) found that residence in predominantly Mexican-American neighbourhoods is associated with higher fertility, net of the effects of individual-level variables. Concerning other aspects of reproductive behaviour, Brewster (1994) demonstrated that differences between racial groups are not solely the outcome of variation in individual characteristics, but also reflect neighbourhood environment. Similar findings are also reported for the United Kingdom (Wilson and Kuha 2016). Finally, in accord with expectations, mixed parentage and partnering with host-country natives have been found to be conducive to the adaptation of migrants’ childbearing behaviour (Kahn 1988; Saenz, Hwang, and Aquirre 1994; Andersson and Scott 2007; Scott and Stanfors 2011; Stichnoth and Yeter 2013).
fertility differentials between the former and the latter (Bean, Swicegood, and Berg 2000; Hill and Johnson 2004; Krapf and Wolf 2015). The characteristics of migrants may be transmitted to the second generation by their parents (Frank and Heuveline 2005). Therefore, in order to properly assess the convergence of migrants’ and their descendants’ fertility with native patterns, their compositional differences from the sending and receiving populations should be considered.
In this study we apply the abovementioned theoretical perspectives to first- and second-generation Russians in Estonia. In order to facilitate the formulation of specific hypotheses, the following section briefly describes the characteristics of the latter group and the fertility patterns of the sending and host populations.
3. The context of the study
3.1 Russians in Estonia
In the newly established Republic of Estonia, ethnic Russians constituted 8% of the total population at the time of the 1922 census. The Second World War inflicted particularly heavy losses on ethnic minorities, including Russians (Katus, Puur, and Sakkeus 1997, 2000a). It has been estimated that following the transfer of border areas from Estonia to Russia in late 1944, the Russian population in Estonia dropped to less than 3% of the total (Katus 1990). Large-scale in-migration from Russia began around 1945 and remained high until the late 1980s; by the late 1980s their proportion had increased to 30% (Sakkeus 1994). Migration to Estonia was to an important extent driven by Soviet economic policies and somewhat higher Estonian living standards, which made the country attractive for labour migrants (Kahk and Tarvel 1997).
The restoration of Estonia’s independence brought large-scale immigration to a close and resulted in a wave of return migration in the 1990s (Sakkeus 1996). Since then, the volume of migration between Russia and Estonia has been relatively moderate, and the proportion of ethnic Russians has stabilised at one-fourth of the total population. Post-war migrants to Estonia comprised 38% of Russians residing in the country at the 2011 census; the remaining 62% were their descendants born in Estonia (ESA 2016).
city of Tallinn the spatial segregation between ethnic groups has increased rather than decreased since the late 1980s, driven chiefly by socioeconomic factors (Tammaru et al. 2016; Mägi et al. 2016). Following the transition to a market economy, Russians have encountered greater difficulties in adapting to the new reality: their unemployment rates have been higher and their earnings lower than the national average.5 There is also evidence of considerable sectoral and occupational segregation of ethnic groups in the labour market (Puur 2000; Luuk 2009; Lindemann 2013). The rates of intermarriage between Russians and the host population are relatively low in Estonia (Van Ham and Tammaru 2011; Rahnu 2016).
However, the situation is gradually changing among the younger generations. Estonian language proficiency among Russians in the young adult age groups exceeded 70% at the time of the 2011 census. It can be expected that similar shifts towards improved integration will occur in other domains as well.
3.2 Fertility trends in Estonia and Russia
Although Estonia and Russia belonged to the same state entity starting from the 18th century, their paths towards demographic modernisation were not identical. In Estonia the onset of the fertility transition can be traced back to the middle of the 19th century, and a rapid decline in birth rates persisted until the late 1920s, when fertility dropped below replacement level (Katus 1994). In Russia, birth rates began a steady fall at the very end of the 19th century, and the fertility transition came to a close in the 1960s (Zakharov 2003, 2008).
The disparity between timeframes of the demographic transition accounted for a noticeable difference in fertility levels between Estonia and Russia in the early postwar decades (Table A-1 in the Appendix). However, during the 1960s fertility levels in the two countries converged.6 In Estonia, a moderate rise in period fertility rates occurred in the late 1960s which returned fertility to close to replacement level, while in Russia the fertility transition came to a close with the total fertility rate (TFR) stabilising at levels between 1.9 and 2.0 children per woman. As a consequence, the difference in fertility levels between the countries reversed. In the 1970s and 1980s, Estonia
5
From 2000 to 2015 the difference in unemployment rates between Russians and the total population ranged between 2 and 7 percentage points; in 2014 the net equivalent income of Russians was 13% below the national average for Estonia (ESA 2016).
exhibited slightly higher TFRs than Russia; the reversal can also be discerned in cohort fertility (Table A-1 in the Appendix). The evidence pertaining to parity-specific measures suggests that the reversal was driven by the progression to second and third births (Bondarskaya 1994; Katus 2000; Zakharov 2008).
A major break in fertility trends occurred in the early 1990s, when birth rates plummeted all over Eastern Europe. In Estonia, the period TFR bottomed out in 1998 at 1.28 children per woman; in Russia, the lowest fertility level (1.16 children) occurred one year later. In the 21st century, fertility rates in both countries have gradually recovered (Puur and Klesment 2012; Frejka and Zakharov 2012; Zakharov 2015). In Estonia, a persistent recovery began in 2004, and the highest period TFRs were
achieved from 2008 to 2010 (1.70–1.72 children per woman).7 In Russia, the recovery
was spread over a somewhat longer span of years, but the peak level from 2012 to 2013 (1.69–1.71 children) was similar to that observed in Estonia a few years earlier. Recent comparative studies (Myrskylä, Goldstein, and Cheng 2013; Frejka et al. 2016) suggest that Estonia’s moderate advantage in completed cohort fertility has persisted in generations born in the late 1960s and early 1970s, whose family formation largely began in the 1990s.
4. Research aim and hypotheses
Although previous research has addressed fertility patterns among the migrant-origin population in Estonia (Katus, Puur, and Sakkeus 2000b, 2002; Katus, Puur, and Põldma 2002; Billingsley, Puur, and Sakkeus 2014), only a few analyses have specifically focused on the fertility behaviour of Estonian Russians (Sakkeus 2000; Abuladze et al. 2013). This study aims to fill this void by systematically comparing them with the populations of the sending and host countries.
Our first hypothesis (H1) posits that the fertility patterns of Russians in Estonia bear greater resemblance to those of the country of origin than to those prevailing in the host society. The hypothesis draws on the cultural maintenance perspective, according to which migrant groups may preserve fertility behaviour that is different from the country of destination for several generations. Our assertion is guided by the contextual features described in the previous section, including slow integration during the Soviet period, the large size of the group, spatial concentration, and linguistically divided schools.
Our second hypothesis (H2) anticipates that the childbearing behaviour of second-generation Russians in Estonia will more closely resemble that of the first second-generation
7
than that of the host population, in accord with the cultural maintenance perspective. Slow integration makes this outcome plausible. But even if this hypothesis is confirmed, we expect that greater integration into the host society, measured by individual and contextual variables, will be associated with convergence with the host-country patterns (hypothesis H3).
Our fourth hypothesis (H4) is that differences between the groups included in this study will vary across parity transitions. Based on the convergence that occurred in the timing of parenthood and levels of childlessness between the sending and receiving countries, we anticipate little or no difference in the transition to first birth. However, we expect more inter-group variation in second- and third-birth risks, in line with the fertility trends in the sending and host countries discussed in the previous section.
In addition to testing our main hypotheses, this study is expected to provide some insight into the role of selection and the characteristics of the migrants. Research on migrant fertility reviewed in earlier sections shows that the profile of migrants and their descendants, in terms of socioeconomic status and other characteristics, may be different from that of the sending or receiving populations. It can be assumed that the specificity of fertility behaviour among migrants and their descendants will be diminished when these differences are controlled for.
5. Data and methods
This study used data from the national surveys carried out in Estonia and Russia 2004– 2005 within the framework of the Generations and Gender Programme (Vikat et al.
2007).8 Both surveys applied the life course approach and collected detailed
retrospective histories of childbearing and partnership dynamics, and a variety of other issues. Comparability of the data was achieved through common guidelines for the survey design, and a standard questionnaire and survey instruments (UNECE 2005). Both surveys used nationally representative probability samples of the resident population. In the Estonian survey, respondents were selected from the population enumerated in the 2000 census, employing a single-stage random procedure; a total of 7,855 women and men born between 1924 and 1983 were interviewed, with a response rate of 70%. The Russian survey used a multi-stage sampling procedure resulting in 11,261 interviews with respondents in the 1924–1987 birth cohorts; the overall response rate for the Russian GGS was 44%. Further information on the data sources is available from methodological publications (Independent Institute for Social Policy 2004; Katus, Puur, and Põldma 2008).
We investigate childbearing patterns among Russians who have settled in Estonia, against the background of Estonians in the host country and Russians in the country of origin. These three groups were defined on the basis of self-declared ethnicity, which was available from both surveys. Russians in Estonia were divided into migrants (the first generation), who were born abroad, and the descendants of migrants, who were born in the host country but whose parents (or grandparents) had migrated to Estonia.9 Guided by an approach frequently taken in fertility research, only women were included in the analyses.
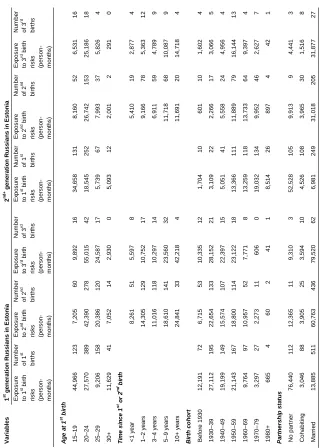
The childbearing transitions examined in the following sections include entry into motherhood, progression from first to second birth, and progression from second to third birth. In order to compare fertility patterns among the subgroups included in the study, we fitted piecewise constant proportional hazards models for each parity transition. To measure the effect of the covariates, the models use time (in months) to conception, backdated from recorded live births. The onset and end of the risk periods vary between models for each parity transition, and are explained in the section that follows. Table 1 presents the number of women, births, and exposure time used in the models, disaggregated by parity transitions and population groups. Additional information on our study population (exposure time and number of births disaggregated by parity transitions and control variables) is provided in the Appendix (Table A-2).
Our modelling strategy was as follows. For each parity transition, we estimated a series of main effects models and monitored the change in the effect of the main independent variable (population group) on fertility outcomes as other covariates were
added in a stepwise procedure.10 The first model (M1) included the main independent
variables, process time, and birth cohort (prior to 1930, 1930–1939, 1940–1949, 1950– 1959, 1960–1969, 1970–1979, 1980–1987). In the second model (M2), a time-varying control for partnership status (married, cohabiting, no partner) was added; in the models for second and third births, M2 also included the age of the respondent at first birth (15–19, 20–24, 25–29, 30+). Model M3 adds controls for the respondents’ birthplace (major city, urban, rural) and number of siblings (0, 1–2, 3+). In Model M4 we added a time-varying covariate for educational attainment (currently enrolled in education, ISCED1–2; ISCED3–4; ISCED5–6). Model M5 (the final model) includes an additional control for lifetime migration history. This variable combines information on the
9 In our study, the descendants of migrants consist mostly of second-generation migrants (81%), plus a small group of third-generation migrants (19%). Second-generation migrants are defined as those who were born in the country of current residence and who have at least one parent born in a foreign country. Third-generation migrants are those who themselves and whose parents were born in the country of current residence. It would have been preferable to present the results separately for second- and third-generation migrants, but the limited sample size of our survey data prevented us from doing this.
10
respondents’ birthplace and residence at the time of the survey, and classifies it according to four categories (urban, from urban to rural, from rural to urban, rural).11
Table 1: Number of respondents, childbearing events, and exposure time. Russians in Estonia, sending and host populations, female birth cohorts 1924–1987
Parity and population group
Number of respondents
Number of births
Exposure time (person-months)1
First birth
Russians in Russia
1st generation Russians in Estonia 2nd+ generation Russians in Estonia Estonians
Second birth Russians in Russia
1st generation Russians in Estonia (ref) 2nd+ generation Russians in Estonia Estonians
Third birth Russians in Russia
1st generation Russians in Estonia (ref) 2nd+ generation Russians in Estonia Estonians
5,777 777 612 3,296
4,793 706 461 2,709
2,696 470 245 1,912
4,858 711 462 2,733
2,714 472 244 1,923
570 75 38 695
623,909 93,371 64,035 393,059
504,775 77,033 44,896 210,352
453,485 92,424 37,834 263,633
1
Time at risk starts at age 15 for first birth or at date of previous birth for higher-order parities and ends 8 months prior to recorded live birth; censoring occurs at interview or at age 45 for first birth or 20 years after previous birth for higher-order parities. Source: Estonian and Russian GGS, authors’ calculations.
For second and third births we estimated a few additional models (M6, M7, and M8) in order to investigate whether Russians’ greater integration into Estonian society is associated with convergence in childbearing patterns. These models are based on M5 and incorporate mixed Russian-Estonian parentage, exposure to the host-country language at school, and the proportion of Estonians in the municipality of residence.12 The focus on second and third births in these additional models is motivated by the fact
11
Birthplace was removed from Model M5, since it partially overlaps with the migration history variable. 12
that the difference in fertility levels between Russians in Estonia and Estonians mainly relates to the progression beyond first birth, as will be demonstrated in the following section. Therefore, the effects of the integration variables are sought from the transition to second and third births.
The modelling results, produced as maximum likelihood estimates of parameter effects, are presented in the form of hazard ratios. To conserve space, presentation of the findings focuses on the main independent variable. Discussion of the results for the control variables is omitted in the article, but estimates based on the final model are available in the Appendix (Table A-3).
6. Results
6.1 Transition to motherhood
As the first step, we present Kaplan-Meier estimates of the proportion of childless women by age among Russians in Estonia, Russians in the country of origin, and Estonians (Figure 1).
A comparison of survival curves shows virtually no difference in the proportion of women who eventually enter motherhood: in all three groups around 90% of women have at least one child. This finding reflects the disappearance of the Malthusian marriage pattern in Estonia during the early postwar decades, as noted in previous sections. With regard to timing, Russian women in their country of origin tend to have their first child earlier than Estonians, whereas Russian women in Estonia display an intermediate pattern between the former and the latter. At younger ages the fertility behaviour of childless Russian women in Estonia bears a stronger resemblance to the host population, but after passing the median age at first birth their entry into motherhood tends to accelerate. As a consequence, the proportion of childless Russian women in Estonia converges with that of their coethnic counterparts in their country of origin. Disaggregation of the former group of women into first-, 1.5-, and second-generation migrants (not shown) suggests that the similarity in estimates between Estonian Russians and Estonians observed at younger ages may be driven by the disruption effect related to migration from one country to another.13
13
Figure 1: Kaplan-Meier estimates for transition to first birth. Russians in Estonia, sending and host populations, female birth cohorts 1924– 1987
Source: Estonian and Russian GGS, authors’ calculations
Table 2 displays the estimates of first-birth risks from a series of event history models for childless women. The respondents were followed from age 15 until the conception that led to motherhood, censoring at the respondents’ 45th birthday or the interview, whichever event occurred first. A small number of respondents who had conceived their first child before age 15 were excluded from the analysis.
Russia as well as from Estonians (the difference from Estonians is significant only at the 10% level). The Kaplan-Meier estimates suggest that the observed differences in first-birth risks are driven wholly by the timing of childbearing (the ultimate proportion of women who enter motherhood does not vary across the population groups included in the study).
Table 2: Hazard ratios for transition to first birth (piecewise constant proportional hazards models). Russians in Estonia, sending and host populations, female birth cohorts 1924–1987
Population group M1 M2 M3 M4 M5
Russians in Russia Russians in Estonia (ref) Estonians
Russians in Russia
1st generation Russians in Estonia (ref) 2nd+ generation Russians in Estonia Estonians
1.07** 1 0.92**
1.04 1 0.93 0.89***
1.09*** 1 1.01
1.07* 1 0.96 1.00
1.08** 1 0.98
1.10** 1 1.05 1.00
1.14*** 1 1.01
1.15*** 1 1.03 1.02
1.09** 1 0.94*
1.07 1 0.96 0.92*
Note: ***p<0.01; **p<0.05; * p<0.1.
Time at risk starts at age 15; censoring occurs at interview date or age 45. Model 1: controlled for process time and birth cohort.
Model 2: M1 additionally controlled for partnership status.
Model 3: M2 additionally controlled for birthplace and number of siblings. Model 4: M3 additionally controlled for education.
Model 5: M4 additionally controlled for migration history. Estimates for control variables are presented in the Appendix (Table A-3). Source: Estonian and Russian GGS, authors’ calculations.
The lower panel of Table 2 presents a comparison of first-generation Russians and their descendants in the host country. In general, the model estimates show only a limited difference between the latter and the former: the difference in hazard ratios
ranges from ‒7% to 5%, reaching statistical significance in none of the models.
However, the modelling results reveal a moderate shift across generations towards increased convergence with the host population. In the final model the first-birth hazard for the descendants of Russian migrants lies between that of first-generation Russians and that of Estonians. As a consequence, the difference in hazard ratios between the descendants of Russian migrants and Estonians fails to reach the level of statistical significance, unlike that for the first generation.14 This shift towards convergence also explains why the difference between the sending population and the first generation of Russians is smaller than that between the sending population and all Russians in Estonia, and why it is statistically insignificant.
14
6.2 Transition to second birth
The analysis of second birth follows the same scheme as that employed for first birth. Figure 2 displays the Kaplan-Meier plots for the transition to second birth, which includes all women who have entered motherhood. The comparison of survival curves reveals that for second births the difference between the population groups is not limited to the timing of childbearing but extends to parity progression ratios. Approximately three-quarters of Estonian mothers give birth a second time, while the corresponding proportion of Russians in their country of origin is slightly above 60%. The Kaplan-Meier estimates for Russians residing in Estonia are between those of the host and sending populations, but are closer to the latter.
Figure 2: Kaplan-Meier estimates for transition to second birth. Russians in Estonia, sending and host populations, female birth cohorts 1924– 1987
Source: Estonian and Russian GGS, authors’ calculations
resulted in a second birth; censoring occurred at the interview or 20 years after the first birth. Respondents who had given birth to twins were excluded from the analysis of second (and third) births.
The estimates corroborate the pattern revealed by descriptive measures. It appears that Russian women in Estonia feature an intermediate level of second-birth risks that is markedly lower than that of the host population but exceeds that of Russians in their country of origin. Although the hazard ratios vary across models, in the final model Russians in Estonia exhibit second-birth risks that are significantly different from those estimated for Estonians as well as from those of their coethnic counterparts in Russia. However, the second-birth risks for Russians in Estonia are more similar to those of their counterparts in their country of origin.
Table 3: Hazard ratios for transition to second birth (piecewise constant proportional hazards models). Russians in Estonia, sending and host populations, female birth cohorts 1924–1987
Population group M1 M2 M3 M4 M5
Russians in Russia Russians in Estonia (ref) Estonians
Russians in Russia
1st generation Russians in Estonia (ref) 2nd+ generation Russians in Estonia Estonians
0.93* 1 1.53***
0.89** 1 0.84** 1.46***
0.99 1 1.72***
0.96 1 0.88 1.67***
0.99 1 1.66***
1.00 1 1.01 1.69***
1.01 1 1.68***
1.02 1 1.01 1.70***
0.91** 1 1.45***
0.90* 1 0.95 1.44***
Note: ***p<0.01; **p<0.05; * p<0.1.
Time at risk starts at first birth; censoring occurs at interview date or 20 years after first birth. Model 1: controlled for process time and birth cohort.
Model 2: M1 additionally controlled for age at first birth and partnership status. Model 3: M2 additionally controlled for birthplace and number of siblings. Model 4: M3 additionally controlled for education.
Model 5: M4 additionally controlled for migration history. Estimates for control variables are presented in the Appendix (Table A-3). Source: Estonian and Russian GGS, authors’ calculations.
6.3 Transition to third birth
In contemporary low-fertility settings, progression beyond the second child is considered discretionary (Ryder 1980; Sobotka and Beaujouan 2014). Although only a minority of women in our study opted to have a third child, Kaplan-Meier estimates reveal a considerable difference between the groups (Figure 3). Among the host population, around 40% of mothers have a third child, whereas the corresponding proportion in the country of origin does not exceed 25%. Unlike for lower parities, Russians in Estonia feature the lowest rate of progression to third births among the three groups (20%).
Figure 3: Kaplan-Meier estimates for transition to third birth. Russians in Estonia, sending and host populations, female birth cohorts 1924– 1987
Source: Estonian and Russian GGS, authors’ calculations
next child; observations were censored at the interview or 20 years after the second birth, whichever event occurred first.
Multivariate results corroborate the pattern revealed by the Kaplan-Meier plots. Russians in Estonia feature a likelihood of third births that is lower than their counterparts in Russia, and even lower than in the host population. A comparison of estimates obtained from the initial and final models shows that the inclusion of control variables markedly reduces the difference in third-birth risks across the subgroups investigated in the study. This suggests that there may be selectivity associated with Russians in Estonia that is accounted for by our control variables. Likewise, a decrease in the hazard ratio for the host population can be seen as evidence of some compositional differences between that population and Russians in Estonia.
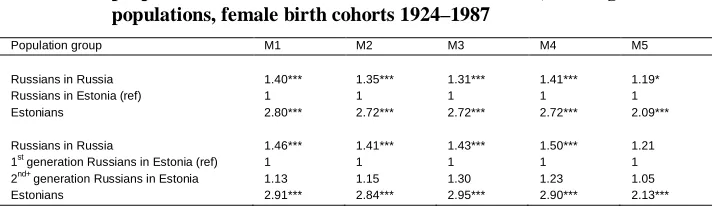
Table 4: Hazard ratios for transition to third birth (piecewise constant proportional hazards models). Russians in Estonia, sending and host populations, female birth cohorts 1924–1987
Population group M1 M2 M3 M4 M5
Russians in Russia Russians in Estonia (ref) Estonians
Russians in Russia
1st generation Russians in Estonia (ref) 2nd+generation Russians in Estonia Estonians
1.40*** 1 2.80***
1.46*** 1 1.13 2.91***
1.35*** 1 2.72***
1.41*** 1 1.15 2.84***
1.31*** 1 2.72***
1.43*** 1 1.30 2.95***
1.41*** 1 2.72***
1.50*** 1 1.23 2.90***
1.19* 1 2.09***
1.21 1 1.05 2.13***
Note: ***p<0.01; **p<0.05; * p<0.1.
Time at risk starts at second birth; censoring occurs at interview date or 20 years after second birth. Model 1: controlled for process time and birth cohort.
Model 2: M1 additionally controlled for age at first birth and partnership status. Model 3: M2 additionally controlled for birthplace and number of siblings. Model 4: M3 additionally controlled for education.
Model 5: M4 additionally controlled for migration history. Estimates for control variables are presented in the Appendix (Table A-3). Source: Estonian and Russian GGS, authors’ calculations.
A closer examination of Table 4 reveals that the bulk of the reduction in hazard ratios occurs after introducing the control for migration history. This observation comes as no surprise since the variable captures the most conspicuous feature of Russians in Estonia ‒ very high concentration in urban areas ‒ that distinguishes them from both the sending and host populations.15 Although urban‒rural differences have declined over time, the urban context continues to be associated with lower fertility in contemporary Europe, with regard to higher parities in particular (Hank 2002; Kulu, Boyle, and
15
Andersson 2009; Kulu 2013). This universal pattern of contextual fertility differentials is also reported for Estonia and Russia (Zakharov and Ivanova 1996; Katus, Puur, and Põldma 2002; Kulu 2005).
The distinction between migrant generations corroborates the finding reported above for second births. The model estimates do not reveal a statistically significant difference in third-birth risks between first-generation Russians who settled in Estonia during the postwar decades and their descendants who have been born in the host country.
6.4 Factors associated with convergence with host-country patterns
For second and third births, which exhibit a larger difference in parity progression between Russians in Estonia and the host population, we estimated some additional models in order to see whether a greater degree of integration is associated with convergence in childbearing patterns. Our additional models were based on the final models (M5) for second and third parity, to which we added three variables: mixed Russian-Estonian parentage, host-country language of instruction, and percentage of Estonians in the municipality of residence. The latter variable was time-varying, derived from the migration history of the respondents. In view of the correlation between our three integration variables, we opted to include them in the models one at a time. The models were estimated only for Russians in Estonia, as integration variables are not relevant to the sending and host populations.
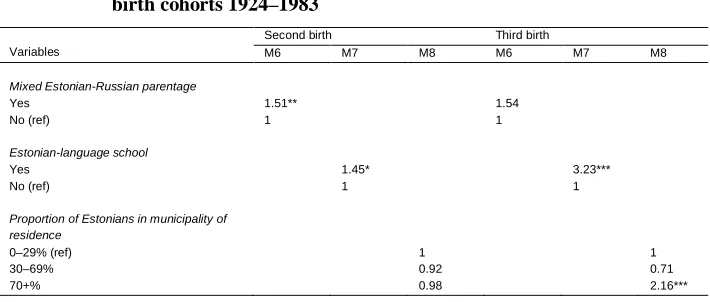
Table 5: Hazard ratios for transition to second and third birth (piecewise constant proportional hazards models). Russians in Estonia, female birth cohorts 1924–1983
Variables
Second birth Third birth
M6 M7 M8 M6 M7 M8
Mixed Estonian-Russian parentage Yes
No (ref)
Estonian-language school Yes
No (ref)
Proportion of Estonians in municipality of residence
0–29% (ref) 30–69% 70+%
1.51** 1
1.45* 1
1 0.92 0.98
1.54 1
3.23*** 1
1 0.71 2.16***
Note: ***p<0.01; **p<0.05; * p<0.1. Time at risk as explained in Tables 3 and 4.
Model 6: M5 (explained in Tables 3 and 4), additionally controlled for mixed parentage. Model 7: M5 (explained in Tables 3 and 4), additionally controlled for school language.
Model 8: M5 (explained in Tables 3 and 4), additionally controlled for population composition at municipality of residence. Source: Estonian and Russian GGS, authors’ calculations
Strengthening of the effect towards higher parity can also be observed for our third integration variable. While the composition of the local population makes virtually no difference in the hazard of second birth, third-birth risks are doubled for Russian women residing in municipalities where Estonians comprise more than 70% of the population.
7. Summary and discussion of the findings
Andreev and Darsky 1992), no study to date has compared childbearing patterns of migrants from Russia and their descendants born in the receiving countries. To the best of our knowledge, this is the first study that focuses specifically on fertility among Russians and their descendants who have settled in a member state of the European Union. Aside from focusing on an important but previously underexplored context and group of migrants, the contribution of this study to the literature arises from its use of life history data that extend to the country of origin, and its parity-specific approach, which provides us with a detailed account of childbearing behaviour. Finally, unlike much contemporary research on migrant fertility in Europe, this study deals with migrants moving between two low-fertility settings, with a somewhat higher fertility level at their destination.
The results supported our first hypothesis (H1) about the fertility patterns of Russians in Estonia. In line with the cultural maintenance (subculture) perspectives, the childbearing pattern of Russian migrants and their descendants bears considerable resemblance to that of their country of origin. This pattern combines a somewhat earlier entry into motherhood with lower progression rates to second and higher-order births, relative to the host population. A similar fertility pattern has also been reported for Russian women in Kyrgyzstan (Nedoluzhko and Andersson 2007), and for post-1989 migrants from the former Soviet Union to Israel (Okun and Kagya 2012). At the same time, we found moderate signs of departure from the patterns characteristic of the country of origin, and a shift towards the host-country patterns, which lends support to the adaptation perspective. This is exemplified by entry into motherhood and the transition to second births. For both transitions the model estimates reveal that Estonian Russians occupy an intermediate position, with hazard ratios falling between those of the sending and host populations. The variation in first-birth risks relates wholly to the timing of parenthood; for second births, adaptation has a bearing on the quantum of fertility as well.
We are inclined to attribute the dominance of subculture over adaptation at least in part to historical legacy and contextual features, such as the high spatial concentration of Russians into limited and overwhelmingly urban areas, and the persistent linguistic division in the educational system. The results obtained from models that include various integration variables confirm our third hypothesis (H3) that fuller integration into the host society is associated with the convergence of childbearing with the host-country patterns. More specifically, being born into a mixed Russian-Estonian family, being enrolled in an Estonian-language school, and living in areas where Estonians constitute a large majority of the population are associated with significant increases in the likelihood of second or third births, i.e., towards the levels characteristic of the host population. These findings can be seen as providing further support for the adaptation perspective, although adaptation processes have been proceeding slowly due to the issues discussed above. Incomplete acquisition of the host-country language seems to be the particular feature that distinguishes the descendants of Russian migrants to Estonia from ‘typical’ second-generation migrants in host societies in contemporary Europe.16
In accord with our final hypothesis (H4), the comparison of model estimates for different parities confirms that differences in childbearing behaviour between Russians in Estonia and the host population are concentrated in second- and third-order births. This finding arises from the tendency of Russians in Estonia to follow the fertility behaviour of their country of origin, which is different from the childbearing patterns of the host society (Katus 2000; Zakharov 2008; Puur and Klesment 2012). Judging from the results, selection and compositional differences have played a moderate role in shaping the fertility patterns of Russians in Estonia. Most importantly, a very high concentration in urban areas seems to have made a discernible contribution to reducing their higher-order fertility rates, relative to both the sending and host populations. However, one might view the influence of the integration variables reported in this study from a selection perspective. For instance, certain members of the minority group may be more amenable to integration, which could be manifested in a range of behaviours, from language acquisition to childbearing patterns that converge with those of the host population. However, investigation of the role of selection in integration processes is beyond the focus of this article.
The view that adherence to an ethnic subculture is the main factor accounting for lower second- and third-birth rates among Russians in Estonia, relative to the host population, may be contested on the grounds that the GGS data provided only limited
information on the socioeconomic circumstances of the respondents. We were only able to consider educational attainment, not the labour market and income histories of the respondents. Given the less advantageous economic position of Russians in Estonia, it is possible that economic uncertainty may have reduced their fertility rates relative to the host population. Support for this argument can be derived from a study of post-1989 immigrants from the former Soviet Union to Israel (Okun and Kagya 2012). The authors of this study identified economic uncertainty and hardship as the central factors accounting for lower transition rates to second and third births, relative to comparison groups in Israel.17 However, although some influence of economic factors is plausible, we doubt that this explanation would apply to Russians in Estonia. It is significant that the emergence of lower fertility among the latter, relative to Estonians, preceded the transition to a market economy by several decades (Bondarskaya 1977; 1994), which makes attributing the fertility differentials to economic uncertainty questionable.18 Arguments against overstating the role of economic factors are also supported by the similarity of the fertility patterns of Russians in Estonia to those of their country of origin, as shown in this study. In our search for factors that would explain the low transition rates to second and third births among Russians in Estonia, we subscribe to Scott and Stanfors (2011) who, in their study of the Swedish context, attributed the low second-birth risks among second-generation East Europeans to their lower fertility norms relative to the host population.
The main conclusions that can be drawn from this study are as follows. First, the cultural maintenance and adaptation perspectives developed in other settings can be successfully applied to childbearing patterns among migrant groups which completed a transition to low fertility a number of decades ago, and who have moved to a country with somewhat higher fertility relative to their country of origin. Second, our results cast some doubt on the notion that migrants can in time alleviate the consequences of low fertility in the receiving countries of Europe. The findings pertaining to Russians in Estonia suggest that in some circumstances migrants and their descendants may even contribute to reducing aggregate fertility levels in the host country. Judging from the literature, lower fertility among migrants moving from one European country to another is not exceptional, but has been reported in several settings in Western Europe (Toulemon 2004; Milewski 2010; González-Ferrer, Castro-Martin, and Kraus 2015; Kulu and Hannemann 2016). But so far the higher fertility of new arrivals from the
17 It is worth noting that Okun and Kagya (2012) have not incorporated measures of labour market uncertainty or income in their analysis. This implies that their explanation is not empirically grounded.
Middle East, Asia, and Africa has more than compensated for the lower fertility of intra-European migrants. However, the situation may change in the future, as the fertility transition advances in regions beyond Europe.19 Third, our results underscore the importance of comprehensive integration policies for Estonia. More specifically, the findings call into question the maintenance of a linguistically divided school system. In its present mode, the divided school system serves as a mechanism that reinforces pillarisation of the society. The literature has already drawn attention to the benefits of less selective school systems for educational and labour market outcomes (Crul 2013; Lindemann 2013): this study seems to extend the positive outcomes of more inclusive and less differentiated educational systems to the fertility domain.
Finally, this study is not without limitations. The main focus of the study was the quantum of fertility, which has left several potentially interesting aspects of childbearing behaviour unaddressed. A major contrast in fertility patterns between contemporary Estonia and Russia relates to the spread of nonmarital childbearing, plausibly reflecting the difference in time periods during which modern cohabitation became widely accepted in the two countries (Puur et al. 2012). Also, there is evidence pertaining to the variation between Estonia and Russia in the educational gradient of childbearing (Rieck 2006; Klesment and Puur 2010) that raises the question of which gradient prevails among migrants from Russia to Estonia. A further limitation of this study relates to the fact that the data used in the study does not extend beyond 2004– 2005. This means that the progress the descendants of Russians may have made in integrating into the host society may not be fully discernible in our results. For the same reason, it is not possible to investigate to what extent the latter group participated in the recovery of fertility rates that accelerated in Estonia after 2004. These are topics that should be addressed in future research.
8. Acknowledgements
The research leading to these results has received support from the ERA.Net RUS PLUS 2015 project Rus Fam, which compares Russian families living in different countries with the ethnic majority, and from the Estonian Ministry of Education and Science under research theme SF0130018s11. Allan Puur, Leen Rahnu, and Luule Sakkeus have also benefitted from participation in the European Union’s
References
Abbasi-Shavazi, M.J. and McDonald, P. (2000). Fertility and multiculturalism:
Immigrant fertility in Australia, 1977–1991. International Migration Review
34(1): 215–242.doi:10.2307/2676018.
Abbasi-Shavazi, M.J. and McDonald, P. (2002). A comparison of fertility patterns of
European immigrants in Australia with those in the countries of origin. Genus
58(1): 53–76.
Abuladze, L., Rijken, A., Rahnu, L., and Van Wissen, L. (2013). Migration effects of
fertility. The case of Russian migrants in Estonia. Paper presented at IUSSP XXVII International Population Conference, Busan, South Korea, August 26–31 2013.
Adsera, A. and Chiswick, B.R. (2007). Are there gender and country of origin differences in immigrant labor market outcomes across European destinations?
Journal of Population Economics 20(3): 495–526.
doi:10.1007/s00148-006-0082-y.
Alba, R. (2005). Bright vs. blurred boundaries: Second-generation assimilation and
exclusion in France, Germany, and the United States.Ethnic and Racial Studies
28(1): 20–49.doi:10.1080/0141987042000280003.
Algan, Y., Dustmann, C., Glitz, A., and Manning, A. (2010). The economic situation of first and second-generation immigrants in France, Germany, and the United
Kingdom.Economic Journal 120(542): F4–F30.doi:10.1111/j.1468-0297.2009.
02338.x.
Andersson, G. (2004). Childbearing after migration: Fertility patterns of foreign-born
women in Sweden.International Migration Review 38(2): 747–774.doi:10.111
1/j.1747-7379.2004.tb00216.x.
Andersson, G. and Persson, L. (2015). Childbearing among the descendant of immigrants in Sweden. Stockholm: Stockholm University (FamiliesAnd Societies working paper 39–2015: 42–66).
Andersson, G. and Scott, K. (2007). Childbearing dynamics of couples in a universalistic welfare state: The role of labor-market status, country of origin,
and gender. Demographic Research 17(30): 897–938. doi:10.4054/DemRes.
2007.17.30.
USSR in the 21st century’, Amsterdam, The Netherlands, September 29 – October 2, 1992.
Balbo, N., Billari, F.C., and Mills, M. (2013). Fertility in advanced societies: A review
of research. European Journal of Population 29(1): 1–38.
doi:10.1007/s10680-012-9277-y.
Barber, J.S. (2001). The intergenerational transmission of age at first birth among
married and unmarried men and women. Social Science Research 30(2): 219–
247.doi:10.1006/ssre.2000.0697.
Bean, F.D., Swicegood, C.G., and Berg, R. (2000). Mexican-origin fertility: New patterns and interpretations.Social Science Quarterly81(1): 404–420.
Becker, G. (1981).A treatise on the family. Cambridge: Harvard University Press.
Billingsley, S., Puur, A., and Sakkeus, L. (2014). Jobs, careers, and becoming a parent under state socialist and market conditions: Evidence from Estonia 1971–2006.
Demographic Research 30(64): 1733–1768.doi:10.4054/DemRes.2014.30.64.
Bisin, A., Patacchini, E., Verdier, T., and Zenou, Y. (2011). Ethnic identity and
labor-market outcomes of immigrants in Europe. Economic Policy 26(65): 57–92.
doi:10.1111/j.1468-0327.2010.00258.x.
Bondarskaya, G.A. (1977). Rozhdaiemostj v SSSR (Etnodemograficheskij aspekt)
[Fertility in the USSR (Ethnodemographic aspect)]. Moscow: Statistika.
Bondarskaya, G.A. (1994). Ethnic-territorial differences in marital fertility: A 1985
survey. In: Lutz, W., Scherbov. S., and Volkov, A. (eds.). Demographic trends
and patterns in the Soviet Union before 1991. London-New York: Routledge: 71–87.
Bondarskaya, G.A. and Darsky L.E. (1988) Etnicheskaya differentsiatsiya rozhdaemosti v SSSR [Ethnic differences of the fertility in the USSR]. Vestnik Statistiki 12: 16–22.
Brewster, K.L. (1994). Race differences in sexual activity among adolescent women:
The role of neighborhood characteristics. American Sociological Review 59(1):
408–424.doi:10.2307/2095941.
Castles, S., De Haas, H., and Miller, M.J. (2014).The age of migration: International population movements in the modern world. Basingstoke: Palgrave Macmillan.
Coale A.J., Anderson, B.A., and Härm, E. (1979).Human fertility in Russia since the nineteenth century. Princeton: Princeton University Press.
Coleman, D.A. (1994). Trends in fertility and intermarriage among immigrant
populations in Western-Europe as measure of integration. Journal of Biosocial
Science26(1): 107–136.doi:10.1017/S0021932000021106.
Coleman, D. (2006). Immigration and ethnic change in low-fertility countries: A third
demographic transition. Population and Development Review 32(3): 401–446.
doi:10.1111/j.1728-4457.2006.00131.x.
Coleman, D. (2009). Migration and its consequencies in the 21st century Europe. In: Coleman, D. and Ediev, D. (eds.). Impact of migration on demographic change
and composition in Europe.Vienna Yearbook of Population Research 7 (Special
issue on impact of migration on demographic change and composition in Europe): 1–18.
Coleman, D.A. and Dubuc, S. (2010). The fertility of ethnic minorities in the UK,
1960s–2006. Population Studies 64(1): 19–41. doi:10.1080/00324720903391
201.
Crul, M. (2013). Snakes and ladders in educational systems: Access to higher education
for second-generation Turks in Europe.Journal of Ethnic and Migration Studies
39(9): 1383–1401.doi:10.1080/1369183X.2013.815388.
Cygan-Rehm, K. (2011). Between here and there: Immigrant fertility patterns in Germany. Bavarian Graduate Program in Economics (BGPE Discussion Paper 109).
Darsky L.E. and Andreev E.M. (1991). Vosproizvodstvo naseleniya otdel’nykh natsional’nostey v SSSR [Demographic reproduction of the selected ethnoses in the USSR].Vestnik Statistiki 6: 4–10.
Dubuc, S. (2012). Immigration to the UK from high-fertility countries:
Intergenerational adaptation and fertility convergence. Population and
Development Review 38(2): 353–368.doi:10.1111/j.1728-4457.2012.00496.x.
ESA (2016). Statistical database [electronic resource]. Tallinn: Statistics Estonia.
http://pub.stat.ee/px-web.2001/dialog/statfile2.asp.
Eurostat (2016). Statistical database [electronic resource]. Luxembourg: European
Commission. http://ec.europa.eu/eurostat/data/browse-statistics-by-theme.
Fischer, N.A. and Marcum, J.P. (1984). Ethnic integration, socioeconomic status, and
Ford, K. (1990). Duration of residence in the United States and the fertility of U.S.
immigrants. International Migration Review24(1): 34–68. doi:10.2307/25466
71.
Forste, R. and Tienda, M. (1996). What’s behind racial and ethnic fertility differentials?
Population and Development Review 22(1): 109–133.doi:10.2307/2808008.
Frank, R. and Heuveline, P. (2005). A crossover in Mexican and Mexican-American
fertility rates: Evidence and explanations for an emerging paradox.Demographic
Research12(4): 77–104.doi:10.4054/DemRes.2005.12.4.
Frejka T. and Zakharov S. (2012). Comprehensive analyses of fertility trends in the Russian Federation during the past half century. Rostock: Max Planck Institute for Demographic Research (MPIDR working paper WP-2012-027).
Frejka, T., Gietel-Basten, S., Abolina, L., Abuladze, L., Aksyonova, S., Akrap, A.,
Antipova, E., Bobic, M., Čipin; I., Fakeyeva, L., Foldes, I., Jasilioniene, A., Kostova, D., Kotowska, I., Krimer, B., Von der Lippe, E., Kurylo, I., Maslasuskaite, A., Mikolai, J., Muresan, C., Petar, V., Potancokova, M., Pronko, T., Puur, A., Rasevic, M., Rybinska, A., Sakkeus, L., Sobotka, T., Sprocha, B., Staddon, R., Stankuniene, V., Šťastná, A., Strmota, M., Stropnik, N., Tymicki, K., Vishnevsky, A., Zakharov, S., Zeman, K., and Zvidrins, P. (2016). Fertility
and family policies in Central and Eastern Europe after 1990. Comparative
Population Studies41(1): 1–55.
Garssen, J. and Nicolaas, H. (2008). Fertility of Turkish and Moroccan women in the
Netherlands: Adjustment to native level within one generation. Demographic
Research19(33): 1249–1280.doi:10.4054/DemRes.2008.19.33.
Goldscheider, C. and Uhlenberg, P.R. (1969). Minority group status and fertility.
American Journal of Sociology 74(4): 361–372.doi:10.1086/224662.
Goldstein, S. and Goldstein, A. (1984). Inter-relations between migration and fertility –
their significance for urbanization in Malaysia. Habitat International 8(1):
93−103.doi:10.1016/0197-3975(84)90030-4.
González-Ferrer, A., Castro-Martin, T., and Kraus, E. (2015). Childbearing among women of immigrant and non-immigrant origin in Spain. Stockholm: Stockholm University (FamiliesAndSocieties working paper 39-2015: 128–149).
Haller W.J., Portes, A., and Lynch, S. (2011). Dreams fulfilled, dreams shattered: Determinants of segmented assimilation in the immigrant second generation.
Hank, K. (2002). Regional social contexts and individual fertility decisions: A
multilevel analysis of first and second births in Western Germany. European
Journal of Population 18(3): 281–299.doi:10.1023/A:1019765026537.
Hervitz, H.M. (1985). Selectivity, adaptation, or disruption? A comparison of alternative hypotheses on the effects of migration on fertility: The case of Brazil.
International Migration Review 19(2): 293–317.doi:10.2307/2545774.
Hill, L. and Johnson, H. (2004). Fertility changes among immigrants: Generations,
neighborhoods, and personal characteristics. Social Science Quarterly 85(3):
811–826.doi:10.1111/j.0038-4941.2004.00246.x.
Hirschman, C. (1983). America’s melting pot reconsidered.Annual Review of Sociology
9: 397–423.doi:10.1146/annurev.so.09.080183.002145.
Hotz, V.J., Klerman, J.A., and Willis, R.J. (1997). The economics of fertility in
developed countries. In: Rosenzweig. M.R. and Stark, O. (eds.). Handbook of
population and family economics. Amsterdam: Elsevier: 275‒347.
Independent Institute for Social Policy (2004). Generations and Gender Survey: Fieldwork in Russia. Technical report to the main study. Moscow: Independent Institute for Social Policy.
Jaffe, A.K. and Cullen, R.M. (1975). Fertility of the Puerto-Rican origin population:
Mainland United States and Puerto Rico 1970. International Migration Review
9(2): 193–209.doi:10.2307/3002749.
Jasilioniene, A., Stankuniene, V., and Jasilionis, D. (2014). Census-linked study on
ethnic fertility differentials in Lithuania. Studies of Transition States and
Societies 6(2): 57–67.
Kahk, J. and Tarvel, E. (1997).An economic history of the Baltic countries. Stockholm: Almquist and Wiksell International.
Kahn, J.R. (1988). Immigrant selectivity and fertility adaptation in the United States.
Social Forces67(1): 108–128.doi:10.2307/2579102.
Katus, K. (1990). Demographic trends in Estonia throughout the centuries.Yearbook of
Population Research in Finland 28: 50–66.
Katus, K. (1994). Fertility transition in Estonia, Latvia and Lithuania. In: Lutz, W.,
Scherbov, S., and Volkov, A. (eds.). Demographic trends and patterns in the
Katus, K. (2000). General patterns of post-transitional fertility in Estonia.Trames 4(3): 213–230.
Katus, K., Puur, A., and Põldma, A. (2002). Eesti põlvkondlik rahvastikuareng [Cohort population development in Estonia]. Tallinn: Estonian Interuniversity Population Research Centre (Series D, 2).
Katus, K., Puur, A., and Põldma, A. (2008). Estonian family and fertility survey. Second round. Standard tabulations. Tallinn: Estonian Interuniversity Population Research Centre (Series C, 26).
Katus, K., Puur, A., and Sakkeus, L. (1997). Development of national minorities:
Republic of Estonia until 1944.Trames 1(3): 221–246.
Katus, K., Puur, A., and Sakkeus, L. (2000a). The demographic characteristics of national minorities in Estonia. In: Haug, W., Compton, P., and Courbage, Y.
(eds.). The demographic characteristics of national minorities in certain
European states, 2. Strasbourg: Council of Europe Publishing: 29–92.
Katus, K., Puur, A., and Sakkeus, L. (2000b).Fertility and family surveys in countries of the ECE region. Standard country report. Estonia. New York and Geneva: United Nations.
Katus, K., Puur, A., and Sakkeus, L. (2002). Immigrant population in Estonia. In: Haug,
W., Compton, P., and Courbage, Y. (eds.). The demographic characteristics of
immigrant population in Europe. Strasbourg: Council of Europe Publishing: 131–192.
Katus, K., Puur, A., and Sakkeus L. (2008). Family formation in the Baltic countries: A transformation in the legacy of state socialism. Journal of Baltic Studies 39(2):
123−156.doi:10.1080/01629770802031218.
Khoo, S.-E., McDonald, P., Giorgas, D., and Birrell, B. (2002). Second generation
Australians. Canberra: Department of Immigration and Multicultural and Indigenous Affairs, Australian Centre for Population Research.
Klesment, M. and Puur, A. (2010). Effects of education on second births before and
after societal transition: Evidence from the Estonian GGS. Demographic
Research 22(28): 891‒932.doi:10.4054/DemRes.2010.22.28.
Klesment, M., Puur, A., Rahnu, L., and Sakkeus, L. (2014). Varying association between education and second births in Europe: Comparative analysis based on
the EU-SILC data. Demographic Research 31(27): 813–860. doi:10.4054/
DemRes.2014.31.27.
Kolk, M. (2014). Multigenerational transmission of family size in contemporary
Sweden. Population Studies 68(1): 111–129. doi:10.1080/00324728.2013.
819112.
Krapf, S. and Wolf, K. (2015). Persisting differences or adaptation to German fertility patterns? First and second birth behavior of the 1.5 and second generation
Turkish migrants in Germany. Kölner Zeitschrift für Soziologie und
Sozialpsychologie 67(Suppl): 137–164.doi:10.1007/s11577-015-0331-8.
Kulu, H. (2005). Migration and fertility: Competing hypotheses re-examined.European
Journal of Population21(1): 51–87.doi:10.1007/s10680-005-3581-8.
Kulu, H. (2013). Why do fertility levels vary between urban and rural areas?Regional
Studies 47(6): 895–912.doi:10.1080/00343404.2011.581276.
Kulu, H., Boyle, P.J., and Andersson, G. (2009).High fertility in city suburbs: Evidence
from four Northern European countries. Demographic Research 21(31): 915–
944.doi:10.4054/DemRes.2009.21.31.
Kulu, H. and González-Ferrer, A. (2014). Family dynamics among immigrants and their
descendants in Europe: Current research and opportunities.European Journal of
Population 30(4): 411–435.doi:10.1007/s10680-014-9322-0.
Kulu, H. and Hannemann, T. (2016). Why does fertility remain high among certain
UK-born ethnic minority women? Demographic Research 35(49): 1441–1488.
doi:10.4054/DemRes.2016.35.49.
Kulu, H. and Milewski, N. (2007). Family change and migration in the life course: An
introduction. Demographic Research 17(19): 567–590. doi:10.4054/DemRes.
2007.17.19.
Landale, N.S. and Hauan, S.M. (1996). Migration and premarital childbearing among
Puerto Rican women.Demography 33(4): 429–442.doi:10.2307/2061778.
Lievens, J. (1999). Family-formation migration from Turkey and Morocco to Belgium:
The demand for marriage partners from the countries of origin. International
Lindemann, K. (2013). Structural integration of young Russian-speakers in post-Soviet contexts: Educational attainment and the transition to the labour market. [PhD thesis]. Tallinn: Tallinn University (Dissertations in Social Sciences 68).
Lindstrom, D. and Saucedo, G.S. (2002). The short- and long-term effects of US
migration experience on Mexican women’s fertility.Social Forces 80(4): 1341–
1368.doi:10.1353/sof.2002.0030.
Lindstrom, D. and Saucedo, G.S. (2007). The interrelationship of fertility, family
maintenance and Mexico-US migration. Demographic Research 17(28): 821–
858.doi:10.4054/DemRes.2007.17.28.
Luuk, M. (2009). Labour market risks of immigrants. In: Saar, E. and Põder, K. (eds.). Immigrant population in Estonia. Tallinn: Statistics Estonia: 92–111.
Macisco, J.J., Bouvier, L.F., and Weller, R.H. (1970). Effect of labour force participation on relation between migration status and fertility in San-Juan,
Puerto-Rico. Milbank Memorial Fund Quarterly 48(1): 51–70. doi:10.2307/
3349288.
Mägi, K., Leetmaa, K., Van Ham, M., and Tammaru, T. (2016). Types of spatial mobility and the ethnic context of destination neighbourhoods in Estonia.
Demographic Research 34(41): 1161–1192.doi:10.4054/DemRes.2016.34.41.
Mayer, J. and Riphahn, R.T. (2000). Fertility assimilation of immigrants: Evidence
from count data models. Journal of Population Economics 13(2): 241–261.
doi:10.1007/s001480050136.
Milewski, N. (2007). First child of immigrant workers and their descendants in West
Germany: Interrelation of events, disruption, or adaptation? Demographic
Research 17(29): 859–896.doi:10.4054/DemRes.2007.17.29.
Milewski, N. (2010). Immigrant fertility in West Germany: Is there a socialization effect in transitions to second and third births?European Journal of Population
26(3): 297–323.doi:10.1007/s10680-010-9211-0.
Milewski, N. (2011). Transition to a first birth among Turkish second-generation
migrants in Western Europe.Advances in Life Course Research 16(4): 178–189.
doi:10.1016/j.alcr.2011.09.002.
Murphy, M. and Knudsen, L.B. (2002). The intergenerational transmission of fertility in contemporary Denmark: The effects of number of siblings (full and half), birth
order, and whether male or female. Population Studies 56(3): 235–248.