Open Access
Research article
Basal jawed vertebrate phylogeny inferred from multiple nuclear
DNA-coded genes
Kanae Kikugawa
†1, Kazutaka Katoh
†1, Shigehiro Kuraku
1,2, Hiroshi Sakurai
3,
Osamu Ishida
3, Naoyuki Iwabe
1and Takashi Miyata*
1Address: 1Department of Biophysics, Graduate School of Science, Kyoto University, Kyoto 606-8502, Japan, 2Laboratory for Evolutionary Morphology, Center for Developmental Biology (CDB), RIKEN, Kobe 650-0047, Japan and 3Tokyo Sea Life Park, Tokyo 134-8587, Japan
Email: Kanae Kikugawa - [email protected]; Kazutaka Katoh - [email protected];
Shigehiro Kuraku - [email protected]; Hiroshi Sakurai - [email protected]; Osamu Ishida - [email protected]; Naoyuki Iwabe - [email protected]; Takashi Miyata* - [email protected]
* Corresponding author †Equal contributors
Abstract
Background: Phylogenetic analyses of jawed vertebrates based on mitochondrial sequences often result in confusing inferences which are obviously inconsistent with generally accepted trees. In particular, in a hypothesis by Rasmussen and Arnason based on mitochondrial trees, cartilaginous fishes have a terminal position in a paraphyletic cluster of bony fishes. No previous analysis based on nuclear DNA-coded genes could significantly reject the mitochondrial trees of jawed vertebrates.
Results: We have cloned and sequenced seven nuclear DNA-coded genes from 13 vertebrate species. These sequences, together with sequences available from databases including 13 jawed vertebrates from eight major groups (cartilaginous fishes, bichir, chondrosteans, gar, bowfin, teleost fishes, lungfishes and tetrapods) and an outgroup (a cyclostome and a lancelet), have been subjected to phylogenetic analyses based on the maximum likelihood method.
Conclusion: Cartilaginous fishes have been inferred to be basal to other jawed vertebrates, which is consistent with the generally accepted view. The minimum log-likelihood difference between the maximum likelihood tree and trees not supporting the basal position of cartilaginous fishes is 18.3 ± 13.1. The hypothesis by Rasmussen and Arnason has been significantly rejected with the minimum log-likelihood difference of 123 ± 23.3. Our tree has also shown that living holosteans, comprising bowfin and gar, form a monophyletic group which is the sister group to teleost fishes. This is consistent with a formerly prevalent view of vertebrate classification, although inconsistent with both of the current morphology-based and mitochondrial sequence-based trees. Furthermore, the bichir has been shown to be the basal ray-finned fish. Tetrapods and lungfish have formed a monophyletic cluster in the tree inferred from the concatenated alignment, being consistent with the currently prevalent view. It also remains possible that tetrapods are more closely related to ray-finned fishes than to lungfishes.
Published: 11 March 2004
BMC Biology 2004, 2:3
Received: 19 August 2003 Accepted: 11 March 2004
This article is available from: http://www.biomedcentral.com/1741-7007/2/3
Background
The evolutionary relationship among jawed vertebrates is currently a controversial issue. Cartilaginous fishes are tra-ditionally considered to be ancestral to other jawed verte-brates (Figure 1A). Arnason and colleagues challenged the traditional view, based on phylogenetic analyses of com-plete mitochondrial sequences from several vertebrates [1-3]. According to their mitochondrial tree (Figure 1B), cartilaginous fishes have a terminal position in the phyl-ogeny of bony fishes (coelacanth, lungfishes, bichirs, tele-ost fishes and other ray-finned fishes), implying that bony fishes are ancestral to cartilaginous fishes. Furthermore, the mitochondrial tree shows a basal split between tetrap-ods and other jawed vertebrates.
Phylogenetic analyses based on mitochondrial sequences, however, often result in misleading trees when distantly related vertebrates are compared [4-7]. Some efforts have been made by several groups to obtain the robust phylo-genetic trees of jawed vertebrates based on nuclear DNA-coded genes. In the LSU rRNA tree by Zardoya and Meyer [6], the basal position of cartilaginous fishes is not signif-icantly supported; the bootstrap probabilities are 72%, 68% and 74%, for the maximum parsimony (MP) method, the neighbor joining (NJ) method and the max-imum likelihood (ML) method, respectively. On the basis of presence or absence of insertions or deletions within conserved sequences [8], Venkatesh et al.[9] claimed to have found robust molecular evidence (molecular synapomorphy) against the mitochondrial tree [1-3]. However, their tree is basically an unrooted tree of major groups of jawed vertebrates as pointed out by Dimmick [10], because none of the molecular synapomorphies they found included an outgroup (cyclostomes or lancelets). Apart from the position of bichir, the tree by Venkatesh et al. is equivalent to that by Rasmussen et al., when com-pared as unrooted trees.
Martin [11] analyzed multiple nuclear DNA-coded genes and the hypothesis by Rasmussen et al. [1-3] could not be refuted. Hedges[12] analyzed 10 nuclear DNA-coded genes from two cyclostomes and three jawed vertebrates, and concluded the basal position of cartilaginous fishes in the jawed vertebrate tree. Takezaki et al. [13] confirmed this finding based on a comparison of 31 nuclear DNA-coded genes. Because only a single bony fish lineage rep-resented by teleost fishes is included in these analyses, it remains possible that other bony fishes (lungfishes or bichir) are more deeply branching than cartilaginous fishes are. If it is the case, one cannot refute the hypothesis by Rasmussen and Arnason [3] that bony fishes are ances-tral to cartilaginous fishes. The phylogenetic position of bichir is particularly important; bichir is often inferred to be the outgroup to all other jawed vertebrates in
mito-chondrial trees, when amphibian data is included in com-parison (data not shown).
The phylogenetic relationship amongst teleost fishes and two holosteans is also controversial. Living holosteans, comprising bowfin and gar, are possible sister groups of teleost fishes [14,15]. All of three possible topologies (Fig-ure 2A,2B,2C) were proposed by morphologists to date (see references cited in [15] and [16]). Partial mitochon-drial and LSU rRNA data, on the other hand, do not sup-port any of these morphology-based trees at a statistically significant level [17,18]. Venkatesh et al. [9] noted the possibility of an alternative tree (Figure 2D) based on a molecular synapomorphy. Inoue et al. [16] recently reported that this tree was supported by complete mito-chondrial sequences. Mitomito-chondrial sequences, however, may not be suitable for inferring phylogenetic relation-ships among such distantly related groups [6,19].
To test the mitochondrial trees at a statistically significant level, it is therefore necessary to perform phylogenetic analyses based on nuclear DNA-coded genes. There is, however, a possible error from paralogous comparisons when a nuclear DNA-coded gene tree is used for inferring the phylogenetic relationship of organisms. To avoid this, we selected basically single copy genes, such as enzymes in glycolysis, which are evolving at roughly constant rates over a wide range of animal taxa [20,21]. Since their evo-lutionary rates are generally low, no single gene amongst them has detailed phylogenetic information. Thus a large
Two hypotheses on jawed vertebrates Figure 1
Two hypotheses on jawed vertebrates. (A) Traditional view. (B) Mitochondrial tree proposed by Arnason's group [1-3].
Coelacanth Tetrapods Lungfishes Bichir
Cartilaginous fishes Ray-finned fishes Coelacanth Tetrapods Lungfishes
Bichir
Cartilaginous fishes Ray-finned fishes A
B
Bony fishes
amount of sequence is needed for a statistically solid inference.
We have cloned and sequenced seven nuclear DNA-coded genes comprising ~3,000 amino acid residues in total, from eleven jawed vertebrate species, two cyclostomes (lamprey and/or hagfish) and a lancelet. These amino acid sequences, together with those available from the DDBJ/EMBL/GenBank databases, were subjected to phyl-ogenetic analyses and statistical tests based on the ML method. We report here that the nuclear DNA-coded gene tree differs sharply from the mitochondrial tree on the two phylogenetic problems of jawed vertebrates; our tree sup-ports the deepest position of cartilaginous fishes in jawed-vertebrate phylogeny, and the monophyly of holosteans.
Results and discussion
Phylogenetic tree inferenceTeleost fishes have two TPI genes (TPI-A and TPI-B) [22];
A. baerii has two ALDa genes (AB111402 and AB111403); mammals have two PGK genes (M11968 and X05246 for
human, M15668 and M17299 for mouse); and the mouse has two G6PD genes (Z84471 and AF326207). Each of these four gene pairs is shown to have multiplied within the respective taxonomic group by preliminary phyloge-netic analyses. To avoid 'long branch attraction' (LBA) artifact [23], the slowly evolving counterpart for each of these gene pairs was selected for phylogenetic inference:
O. latipes ortholog of TPI-B, AB111402 for A. baerii ALDa, M11968 for human PGK, M15668 for mouse PGK and AF326207 for mouse G6PD. Cyclostomes have muscle and non-muscle types of aldolase (ALD) genes [24]. Although the relationship between these two cyclostome ALD genes and three ALD genes (a, b and c) from jawed vertebrates is not clearly resolved, each of the jawed-verte-brate ALD genes was inferred to be orthologous [25]. The muscle-type ALD gene of hagfish, the non-muscle-type ALD gene of hagfish and the non-muscle-type ALD gene of lamprey were used as outgroups for ALDa, ALDb and ALDc of jawed vertebrates, respectively.
For each of the seven proteins, the amino acid sequences from 15 vertebrate species listed in Materials and methods have been aligned, and phylogenetic tree analyses have been carried out for regions comprising 317 amino acid residues (aa) in ALDa, 316aa in ALDb, 317aa in ALDc, 463aa in G6PD, 940aa in GAG, 383aa in PGK and 206aa in TPI, for each of which unambiguous alignment is pos-sible. The total data set of 2,942aa was subjected to phyl-ogenetic analyses based on the GAMT program [26] as described in materials and methods.
We have selected the candidate topologies – a set of topol-ogies with log-likelihood values close to that of the ML tree – from seven protein data sets as described in Materi-als and Methods. The numbers of candidate topologies selected are 379 from the ALDa data set, 91 from the ALDb data set, 1,121 from the ALDc data set, 665 from the G6PD data set, 11 from the GAG data set, 652 from the PGK data set and 2,860 from the TPI data set, and 103 from the concatenated alignment. Excluding identical topologies, a total of 5,801 topologies were subjected to further analyses as the candidate topologies. For each can-didate topology, the likelihood value of totalml and that of concatenated alignment were computed.
Figure 3 shows the ML tree inferred from the concatenated alignment. This tree strongly supports the basal position of cartilaginous fishes and the monophyly of holosteans, although individual trees inferred from each of seven pro-teins did not give statistically significant results, probably because of limited phylogenetic information held in a sin-gle gene (data not shown). Tables 1 and 2 show the ML topology and some topologies with large likelihood val-ues inferred from concatenated alignment analysis and totalml analysis, respectively. Each table includes only
Four hypotheses of phylogenetic relationship among ray-finned fishes
Figure 2
Four hypotheses of phylogenetic relationship among ray-finned fishes. (A) Formerly accepted view. (B) Currently accepted view. (C) An alternative hypothesis by Olsen [42]. (D) Mitochondrial tree by Inoue et al. [16].
Telsost fishes Bowfin Gar Sturgeons
Neopterygii
Chondrostei B
Telsost fishes Gar
Bowfin Sturgeons
Neopterygii
Chondrostei C
Telsost fishes Gar
Bowfin Sturgeons D
Telsost fishes Gar
Bowfin Sturgeons
"Holostei"
Chondrostei
topologies with P-values larger than 5% calculated by the Kishino-Hasegawa (KH) test. Note that the ML tree in totalml analysis (topology b in Table 2) differs from that in concatenated alignment analysis (Figure 3 and topol-ogy a in Table 1).
Statistical tests
Topologies a and b in Tables 1 and 2 differ considerably from other topologies in their bootstrap probabilities and
P-values. These two topologies have approximately equal likelihood values in each of the totalml and concatenated alignment analyses, although the ML tree in concatenated alignment analysis is the second best tree in totalml anal-ysis, and vice versa.
In addition to the bootstrap probability and the KH test, a test based on Bayesian posterior probability (BPP) has been carried out. The resulting BPP values are self-contra-dictory; topology a, which was the best topology in con-catenated alignment analysis (Table 1), is significantly rejected in totalml analysis (Table 2; the BPP value was 0.005). Thus the BPP test might be too liberal, as already pointed out [27,28]. The approximately unbiased (AU) test has also been carried out for reference.
Focusing on some phylogenetic problems, the support values for each competing hypothesis were computed based on the intact bootstrap probability (BP) analysis (see Materials and Methods), the TREE-PUZZLE (TP) pro-gram [29] and the MRBAYES[30] propro-gram (Table 3). In addition, the RELL BP value, the BPP value and the P -val-ues by the KH test and the AU test, which are based on concatenated alignment analysis described above, are also shown. The intact BP value is largely accordant to the RELL BP value, whereas low support values are observed in the TP method. This may be an artifact derived from the limited topology searches in the TP method, because the same result as shown in Table 1 was obtained, when the candidate topologies described above were subjected to the TREE-PUZZLE program with the 'user defined trees' option.
Cartilaginous fishes have a basal position among jawed vertebrates
Cartilaginous fishes are thought to be ancestral to other jawed vertebrates in the traditional view (Figure 1A). In contrast, Rasmussen and Arnason [1,2] and Arnason et al. [3] pointed out another possibility that bony fishes are ancestral to cartilaginous fishes (Figure 1B). The present results strongly support the traditional view as shown in Figure 3 and Table 3. The bootstrap probabilities of the
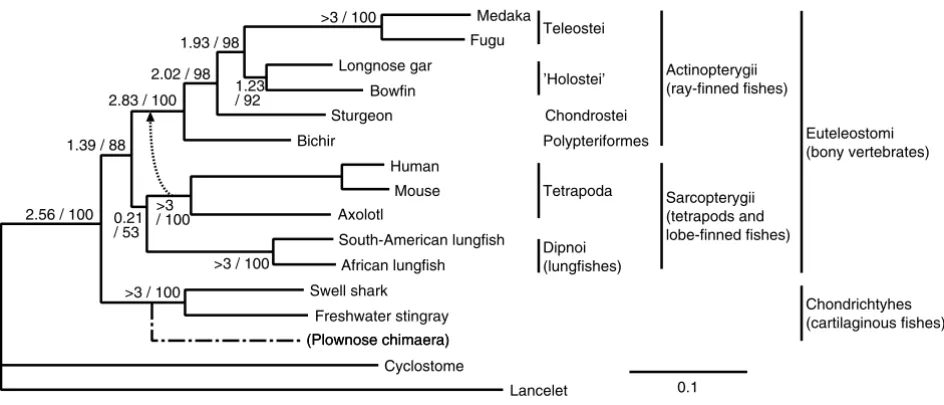
The maximum likelihood tree inferred from the concatenated amino acid sequences (2,942 residues) of seven proteins Figure 3
The maximum likelihood tree inferred from the concatenated amino acid sequences (2,942 residues) of seven proteins. Relia-bility index [26] and the bootstrap probaRelia-bility for each branch are indicated before and after a slant, respectively. This tree cor-responds to topology a in Tables 1 and 2. Topology b in Tables 1 and 2 is indicated by a dotted arrow. A dash-dotted line indicates the position of plownose chimaera inferred from six proteins. Branch lengths are proportional to accumulated amino acid substitutions.
(Plownose chimaera) >3
/ 100
>3 / 100 0.21
/ 53
>3 / 100
1.23 / 92 1.93 / 98
2.02 / 98
2.83 / 100
1.39 / 88
>3 / 100 2.56 / 100
Human Mouse Axolotl
South-American lungfish
African lungfish
Medaka
Longnose gar
Bowfin Sturgeon
Bichir
Swell shark
Freshwater stingray
Cyclostome
Lancelet Fugu
’Holostei’ Actinopterygii (ray-finned fishes)
Euteleostomi (bony vertebrates) Chondrostei
Teleostei
Sarcopterygii (tetrapods and lobe-finned fishes) Tetrapoda
Dipnoi (lungfishes)
Chondrichtyhes (cartilaginous fishes) Polypteriformes
(Plownose chimaera)
topologies having a basal position of cartilaginous fishes totaled 88.2% and 87.8% in concatenated alignment analysis and totalml analysis, respectively. The minimum log-likelihood difference between the ML tree and trees not supporting a basal split between cartilaginous fishes and remaining jawed vertebrates was 18.3 ± 13.1 (P-value = 0.09) and 15.3 ± 12.7 (P-value = 0.12), in concatenated alignment analysis and totalml analysis, respectively. The minimum log-likelihood difference between the ML tree and that supporting the bony fish origin of cartilaginous fishes was 123 ± 23.3 value < 0.01) and 137 ± 29.6 (P-value < 0.01) in concatenated alignment analysis and totalml analysis, respectively, providing strong evidence against the hypothesis by Arnason's group [1-3]. When the lancelet (a distant outgroup) sequences are excluded from the analysis, the minimum log-likelihood difference between the ML tree and trees that support their hypothe-sis was 122 ± 25.9, still being statistically significant.
According to the phylogenetic analysis based on mito-chondrial sequences, however, all topologies consistent with the present analysis are significantly rejected (P-value < 0.01). This controversial result may be due to the incom-pleteness of phylogenetic information retained in the mitochondrial sequences; the amino acid composition of mitochondrial DNA-coded proteins is highly biased to hydrophobic residues and thus multiple and reverse sub-stitutions may occurs very frequently [4]. In addition, the evolutionary rates of mitochondrial sequences often differ greatly for different lineages; the mitochondrial sequences of most tetrapods evolve more rapidly than those of fishes
[31,32]. These evolutionary features characteristic of mitochondrial sequences might result in the LBA artifact [23].
Did tetrapods originate from lobe-finned fishes?
Several molecular phylogenetic analyses were carried out to clarify the phylogenetic relationship among tetrapods, coelacanth and lungfishes, using ray-finned fishes [33-36] and/or cartilaginous fishes [5,9,37] as an outgroup. The validity of these two rootings needs to be confirmed with molecular evidence [2,5]. Although no coelacanth sequence is included, the present analysis provides a con-firmation for the cartilaginous fish rooting. Ray-finned fishes, however, cannot be used as an outgroup, because it remains possible that tetrapods are more closely related to ray-finned fishes than to lobe-finned fishes (topology b in Tables 1 and 2).
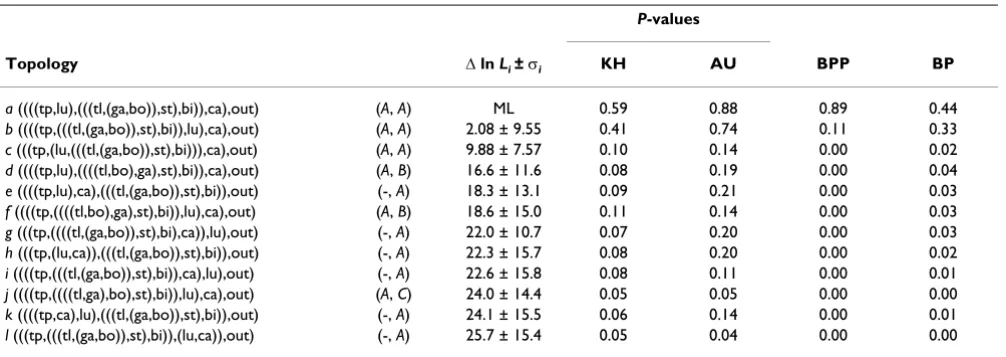
Since bichir, the basal ray-finned fishes (see below), have a pair of lungs and fleshy pectoral fins [38], the common ancestor of bony fishes are likely to be somewhat like lobe-finned fishes. Thus it remains possible that tetrapods originated from such ancestral ray-finned fishes or from the common ancestor of ray-finned fishes and lobe-finned fishes. Recently reported fossil records suggest that the divergence of lungfish and tetrapods occurred at least as early as 417-412 Mya [39,40]. According to Kumar and Hedges [41] and Hedges [12], the divergence of ray-finned fishes and lobe-finned fishes was estimated to have occured at 450-400 Mya, which is simultaneous with or immediately before the divergence of lungfish and Table 1: Log-likelihood differences based on the concatenated alignment
P-values
Topology ∆ ln Li ± σi KH AU BPP BP
a ((((tp,lu),(((tl,(ga,bo)),st),bi)),ca),out) (A, A) ML 0.59 0.88 0.89 0.44
b ((((tp,(((tl,(ga,bo)),st),bi)),lu),ca),out) (A, A) 2.08 ± 9.55 0.41 0.74 0.11 0.33 c (((tp,(lu,(((tl,(ga,bo)),st),bi))),ca),out) (A, A) 9.88 ± 7.57 0.10 0.14 0.00 0.02 d ((((tp,lu),((((tl,bo),ga),st),bi)),ca),out) (A, B) 16.6 ± 11.6 0.08 0.19 0.00 0.04 e ((((tp,lu),ca),(((tl,(ga,bo)),st),bi)),out) (-, A) 18.3 ± 13.1 0.09 0.21 0.00 0.03 f ((((tp,((((tl,bo),ga),st),bi)),lu),ca),out) (A, B) 18.6 ± 15.0 0.11 0.14 0.00 0.03 g (((tp,((((tl,(ga,bo)),st),bi),ca)),lu),out) (-, A) 22.0 ± 10.7 0.07 0.20 0.00 0.03 h (((tp,(lu,ca)),(((tl,(ga,bo)),st),bi)),out) (-, A) 22.3 ± 15.7 0.08 0.20 0.00 0.02 i ((((tp,(((tl,(ga,bo)),st),bi)),ca),lu),out) (-, A) 22.6 ± 15.8 0.08 0.11 0.00 0.01 j ((((tp,((((tl,ga),bo),st),bi)),lu),ca),out) (A, C) 24.0 ± 14.4 0.05 0.05 0.00 0.00 k ((((tp,ca),lu),(((tl,(ga,bo)),st),bi)),out) (-, A) 24.1 ± 15.5 0.06 0.14 0.00 0.01 l (((tp,(((tl,(ga,bo)),st),bi)),(lu,ca)),out) (-, A) 25.7 ± 15.4 0.05 0.04 0.00 0.00
Topologies that are not significantly rejected (P-value > 0.05) by the Kishino-Hasegawa (KH) test are listed. P-values by the approximately unbiased (AU) test, the Bayesian posterior probability (BPP), and the bootstrap probability (BP) are also shown for each topology. Abbreviations for species names are: tp, tetrapods; lu, lunfishes; tl, teleost fishes; bo, bowfin; ga, gar; st, sturgeon; bi, bichir; ca, cartilaginous fishes; out, outgroup.
tetrapods. This is consistent with the present study sug-gesting the almost simultaneous divergence of tetrapods, lungfishes and ray-finned fishes.
Living holosteans form a natural group
The phylogenetic relationship among teleost fishes and holosteans comprising bowfin and gar is controversial [15]. Four different tree topologies (Figure 2A,2B,2C,2D) have been proposed to date from morphological and molecular data. According to a formerly accepted view, living ray-finned fishes are divided into three major groups (Figure 2A): Chondrostei (chondrosteans includ-ing sturgeons and paddlefishes), 'Holostei' (holosteans comprising bowfin and gar), and Teleostei (teleost fishes consisting all other living ray-finned fishes). 'Holostei' is, however, a term that has fallen into disuse in formal clas-sifications. Instead, in the currently accepted view, holo-steans are considered to be paraphyletic; bowfin is thought to be more closely related to teleost fishes than gar is [14,38], as shown in Figure 2B, and therefore ray-finned fishes are classified into two monophyletic groups: Chondrostei and Neopterygii (holosteans and teleost fishes). Another possibility that gar is closely related to tel-eost fishes (Figure 2C) was also proposed [42]. Further-more, mitochondrial sequences suggest a distinct tree topology (Figure 2D), in which holosteans and chondro-steans form a monophyletic group [16].
In the present analysis, holosteans are inferred to form a monophyletic group that is the sister group to teleost fishes, as shown in Figure 3 and Table 3. The bootstrap probabilities for the holostean clade are 92.2% and 83.8% in concatenated alignment analysis and totalml analysis, respectively. The topologies not supporting the holostean
clade are relatively small in P-values (≤ 0.12), as shown in Tables 1 and 2. This result is rather consistent with a for-merly accepted view of vertebrate classification, but is inconsistent with the currently accepted view. The mito-chondrial tree shown in Figure 2D was significantly rejected by the KH test, if its likelihood value was calcu-lated using nuclear DNA-coded genes; its log-likelihood difference from the ML tree was 34.9 ± 18.0 (P-value = 0.03) and 42.3 ± 20.8 (P-value = 0.02) in concatenated alignment analysis and totalml analysis, respectively.
We also analyzed a mitochondrial data set and confirmed the monophyly of holosteans and chondrosteans. In con-trast to the high support value (100%) by the MRBAYES program for this relationship, however, the RELL BP value was only 71%. The likelihood difference between topolo-gies A and D of Figure 2 was 11.9 ± 13.3 (P-value = 0.18), which is not significant, as Inoue et al. [16] noted. Consid-ering the Bayesian inference often results in erroneously high support values [28,43], the inconsistency between the present inference and that based on mitochondrial sequences might be caused by the artifact of the Bayesian inference.
Bichir is the basal ray-finned fish
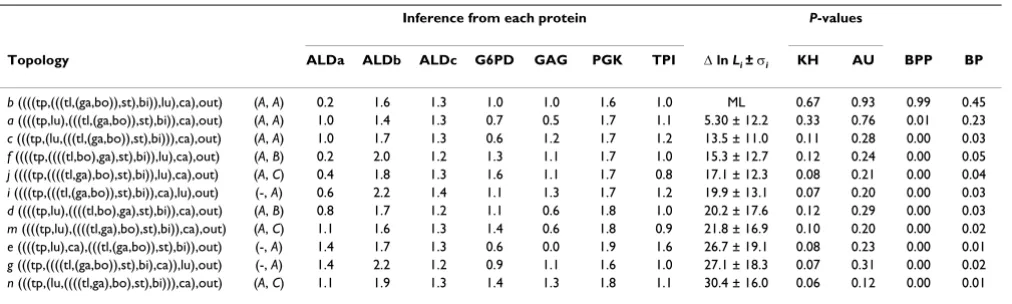
The phylogenetic position of bichir has long been contro-versial as well, as it shares many characters with both lobe-finned fishes and ray-lobe-finned fishes [9,44]. Most morphol-ogists currently place bichir to a basal position in ray-finned fishes [38,45], although it remains possible that bichir and chondrosteans form a monophyletic group [14]. Recently, Venkatesh et al. [9,46] found one molecu-lar synapomorphy indicating that bichir is the basal ray-finned fish, under the assumption that cartilaginous fishes Table 2: Log-likelihood differences based on totalml analysis
Inference from each protein P-values
Topology ALDa ALDb ALDc G6PD GAG PGK TPI ∆ ln Li ± σi KH AU BPP BP
b ((((tp,(((tl,(ga,bo)),st),bi)),lu),ca),out) (A, A) 0.2 1.6 1.3 1.0 1.0 1.6 1.0 ML 0.67 0.93 0.99 0.45
a ((((tp,lu),(((tl,(ga,bo)),st),bi)),ca),out) (A, A) 1.0 1.4 1.3 0.7 0.5 1.7 1.1 5.30 ± 12.2 0.33 0.76 0.01 0.23
c (((tp,(lu,(((tl,(ga,bo)),st),bi))),ca),out) (A, A) 1.0 1.7 1.3 0.6 1.2 1.7 1.2 13.5 ± 11.0 0.11 0.28 0.00 0.03
f ((((tp,((((tl,bo),ga),st),bi)),lu),ca),out) (A, B) 0.2 2.0 1.2 1.3 1.1 1.7 1.0 15.3 ± 12.7 0.12 0.24 0.00 0.05
j ((((tp,((((tl,ga),bo),st),bi)),lu),ca),out) (A, C) 0.4 1.8 1.3 1.6 1.1 1.7 0.8 17.1 ± 12.3 0.08 0.21 0.00 0.04
i ((((tp,(((tl,(ga,bo)),st),bi)),ca),lu),out) (-, A) 0.6 2.2 1.4 1.1 1.3 1.7 1.2 19.9 ± 13.1 0.07 0.20 0.00 0.03
d ((((tp,lu),((((tl,bo),ga),st),bi)),ca),out) (A, B) 0.8 1.7 1.2 1.1 0.6 1.8 1.0 20.2 ± 17.6 0.12 0.29 0.00 0.03
m ((((tp,lu),((((tl,ga),bo),st),bi)),ca),out) (A, C) 1.1 1.6 1.3 1.4 0.6 1.8 0.9 21.8 ± 16.9 0.10 0.20 0.00 0.02
e ((((tp,lu),ca),(((tl,(ga,bo)),st),bi)),out) (-, A) 1.4 1.7 1.3 0.6 0.0 1.9 1.6 26.7 ± 19.1 0.08 0.23 0.00 0.01
g (((tp,((((tl,(ga,bo)),st),bi),ca)),lu),out) (-, A) 1.4 2.2 1.2 0.9 1.1 1.6 1.0 27.1 ± 18.3 0.07 0.31 0.00 0.02
n (((tp,(lu,((((tl,ga),bo),st),bi))),ca),out) (A, C) 1.1 1.9 1.3 1.4 1.3 1.8 1.1 30.4 ± 16.0 0.06 0.12 0.00 0.01
are basal in the jawed-vertebrate tree. Our result strongly confirms the result from molecular synapomorphies: bichir is placed at the deepest position in ray-finned fishes, and the bootstrap probabilities are 98.1% and 95.1% in concatenated alignment analysis and in totalml analysis, respectively, as shown in Figure 3 and Table 3. The alternative hypothesis that bichir and chondrosteans form a monophyletic group was not supported; its log-likelihood difference from the ML tree is 37.4 ± 18.5 (P -value = 0.02) and 33.3 ± 19.5 (P-value = 0.04) in concate-nated alignment analysis and totalml analysis, respectively.
Chimaeras and other cartilaginous fishes form a monophyletic group
Some paleontologists have pointed out the possibility that chimaeras were derived from placoderms independ-ently from other cartilaginous fishes (eg, [38]). To test this possibility, we have isolated the genes listed in Materials and methods, except for ALDb, from a plownose chi-maera, Callorhinchus callorhynchus, and have inferred its phylogenetic position based on the concatenated align-ment of 2,431 amino acid residues. The resulting tree sig-nificantly supported the monophyly of cartilaginous fishes including chimaeras (as shown by dash-dotted line in Figure 3) with the RELL bootstrap probability of 100%. Mitochondrial data also support this relationship [3].
Conclusions
Molecular phylogenetic analyses of jawed vertebrates based on mitochondrial sequences often result in confus-ing inferences which are obviously inconsistent with
gen-erally accepted trees. To obtain a robust tree of jawed vertebrates, we have cloned and sequenced seven nuclear DNA-coded genes from thirteen vertebrate species and have carried out phylogenetic analyses including thirteen jawed vertebrates from eight major groups and an out-group (a cyclostome and a lancelet) based on the maxi-mum likelihood method. We have shown that (i) cartilaginous fishes are basal to other jawed vertebrates. This is consistent with generally accepted view, but is inconsistent with mitochondrial trees. (ii) Living holosteans, comprising bowfin and gar, form a mono-phyletic group which is the sister group to teleost fishes. This is consistent with a formerly prevalent view of verte-brate classification, but inconsistent with both of the cur-rent morphology-based and mitochondrial sequence-based trees. (iii) The bichir is the basal ray-finned fish. (iv) Tetrapods and lungfish form a monophyletic cluster in the tree inferred from the concatenated alignment, being consistent with currently accepted view. It remains also possible that tetrapods are more closely related to ray-finned fishes than to lungfishes.
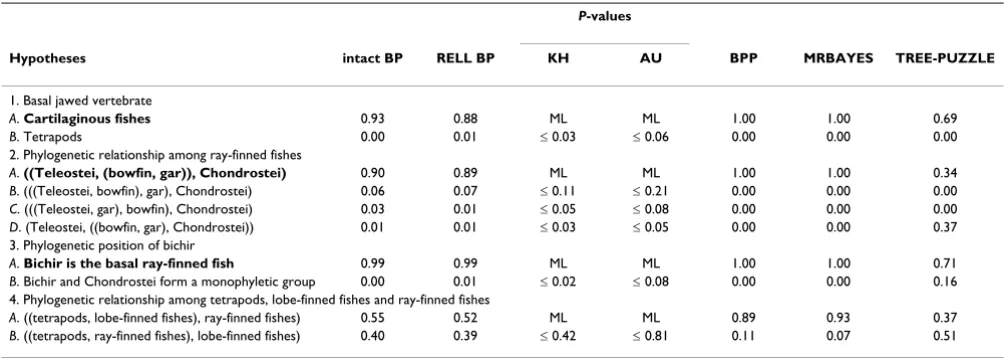
The present results are statistically solid and highly con-sistent with traditional views based on morphological and paleontological evidence. Comparing with trees inferred from mitochondrial sequences, which often provide obvi-ously bizarre phylogeny, these nuclear DNA-coded genes probably have more accurate phylogenetic information. More intensive taxonomic sampling, particularly inclu-sion of coelacanth, would provide more solid inference for the origin of tetrapods and other phylogenetic prob-lems currently discussed mainly based on mitochondrial Table 3: Tests of significance for conflicting phylogenetic hypotheses
P-values
Hypotheses intact BP RELL BP KH AU BPP MRBAYES TREE-PUZZLE
1. Basal jawed vertebrate
A. Cartilaginous fishes 0.93 0.88 ML ML 1.00 1.00 0.69
B. Tetrapods 0.00 0.01 ≤ 0.03 ≤ 0.06 0.00 0.00 0.00
2. Phylogenetic relationship among ray-finned fishes
A. ((Teleostei, (bowfin, gar)), Chondrostei) 0.90 0.89 ML ML 1.00 1.00 0.34
B. (((Teleostei, bowfin), gar), Chondrostei) 0.06 0.07 ≤ 0.11 ≤ 0.21 0.00 0.00 0.00
C. (((Teleostei, gar), bowfin), Chondrostei) 0.03 0.01 ≤ 0.05 ≤ 0.08 0.00 0.00 0.00
D. (Teleostei, ((bowfin, gar), Chondrostei)) 0.01 0.01 ≤ 0.03 ≤ 0.05 0.00 0.00 0.37
3. Phylogenetic position of bichir
A. Bichir is the basal ray-finned fish 0.99 0.99 ML ML 1.00 1.00 0.71
B. Bichir and Chondrostei form a monophyletic group 0.00 0.01 ≤ 0.02 ≤ 0.08 0.00 0.00 0.16
4. Phylogenetic relationship among tetrapods, lobe-finned fishes and ray-finned fishes
A. ((tetrapods, lobe-finned fishes), ray-finned fishes) 0.55 0.52 ML ML 0.89 0.93 0.37
B. ((tetrapods, ray-finned fishes), lobe-finned fishes) 0.40 0.39 ≤ 0.42 ≤ 0.81 0.11 0.07 0.51
sequences. An extended analysis including coelacanth sequences is in progress.
Materials and methods
Isolation and sequencing of cDNAsWe have carried out a phylogenetic analysis of jawed ver-tebrates based on seven nuclear DNA-coded genes from six ray-finned fishes, three tetrapods, two lobe-finned fishes, three cartilaginous fishes and an outgroup (a cyclostome and a lancelet). For plownose chimaera, only six gene sequences excluding ALDb sequence were availa-ble for analysis. The names and abbreviations of proteins used in the present analysis are as follows: ALDa, ALDb and ALDc, fructose-bisphosphate aldolase A, B and C, respectively; G6PD, glucose-6-phosphate 1-dehydroge-nase; GAG, a trifunctional protein with glycinamide ribo-nucleotide synthetase (GARS)-aminoimidazole ribonucleotide synthetase (AIRS)-glycinamide ribonucle-otide formyltransferase (GART); PGK, phosphoglycerate kinase; TPI, triosephosphate isomerase.
Species and tissues used for RNA extraction are as follows:
Ambystoma mexicanum, axolotl (gill and tail); Lepidosiren paradoxa, South American lungfish (brain, liver, heart and muscle); Protopterus annectens, African lungfish (pectoral fin); Oryzias latipes, Japanese medaka (liver); Lepisosteus osseus, longnose gar (brain, liver and muscle); Amia calva, bowfin (caudal fin); Acipenser baerii, Siberian sturgeon (brain and liver); Polypterus ornatipinnis, bichir (brain, liver and muscle); Cephaloscyllium umbratile, swell shark (brain, liver and muscle); Potamotrygon motoro, freshwater stingray (brain and liver); Callorhinchus callorhynchus, plownose chimaera (embryo); Lethenteron reissneri, lam-prey (larva); Eptatretus burgeri, inshore hagfish (liver);
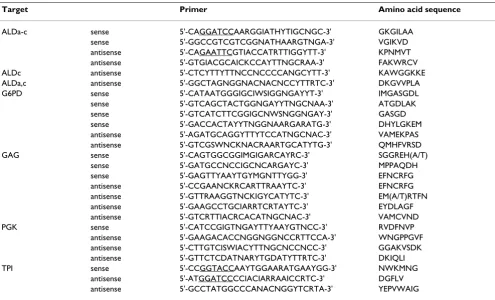
Branchiostoma belcheri, lancelet (whole body). Total RNAs were extracted using TRIZOL Reagent (GIBCO BRL). These total RNAs were reverse-transcribed to cDNAs using oligo(dT) primer with reverse transcriptase (SuperScript II, GIBCO BRL) and were used as templates for PCR amplification with Expand High-Fidelity PCR System (Roche Diagnostics). The sense and antisense degenerate primers of the seven proteins were designed from con-Table 4: Degenerate primers used for the cloning of cDNAs
Target Primer Amino acid sequence
ALDa-c sense 5'-CAGGATCCAARGGIATHYTIGCNGC-3' GKGILAA
sense 5'-GGCCGTCGTCGGNATHAARGTNGA-3' VGIKVD
antisense 5'-CAGAATTCGTIACCATRTTIGGYTT-3' KPNMVT
antisense 5'-GTGIACGCAICKCCAYTTNGCRAA-3' FAKWRCV
ALDc antisense 5'-CTCYTTYTTNCCNCCCCANGCYTT-3' KAWGGKKE
ALDa,c antisense 5'-GGCTAGNGGNACNACNCCYTTRTC-3' DKGVVPLA
G6PD sense 5'-CATAATGGGIGCIWSIGGNGAYYT-3' IMGASGDL
sense 5'-GTCAGCTACTGGNGAYYTNGCNAA-3' ATGDLAK
sense 5'-GTCATCTTCGGIGCNWSNGGNGAY-3' GASGD
sense 5'-GACCACTAYYTNGGNAARGARATG-3' DHYLGKEM
antisense 5'-AGATGCAGGYTTYTCCATNGCNAC-3' VAMEKPAS
antisense 5'-GTCGSWNCKNACRAARTGCATYTG-3' QMHFVRSD
GAG sense 5'-CAGTGGCGGIMGIGARCAYRC-3' SGGREH(A/T)
sense 5'-GATGCCNCCIGCNCARGAYC-3' MPPAQDH
sense 5'-GAGTTYAAYTGYMGNTTYGG-3' EFNCRFG
antisense 5'-CCGAANCKRCARTTRAAYTC-3' EFNCRFG
antisense 5'-GTTRAAGGTNCKIGYCATYTC-3' EM(A/T)RTFN
antisense 5'-GAAGCCTGCIARRTCRTAYTC-3' EYDLAGF
antisense 5'-GTCRTTIACRCACATNGCNAC-3' VAMCVND
PGK sense 5'-CATCCGIGTNGAYTTYAAYGTNCC-3' RVDFNVP
antisense 5'-GAAGACACCNGGNGGNCCRTTCCA-3' WNGPPGVF
antisense 5'-CTTGTCISWIACYTTNGCNCCNCC-3' GGAKVSDK
antisense 5'-GTTCTCDATNARYTGDATYTTRTC-3' DKIQLI
TPI sense 5'-CCGGTACCAAYTGGAARATGAAYGG-3' NWKMNG
antisense 5'-ATGGATCCCCIACIARRAAICCRTC-3' DGFLV
antisense 5'-GCCTATGGCCCANACNGGYTCRTA-3' YEPVWAIG
served amino acid residues of each gene as shown in Table 4. PCR amplification was carried out under annealing condition of 43–50°C with the sense and antisense prim-ers. Nested PCR with a proper set of sense and antisense primers was carried out with primary PCR product, when needed.
The PCR products were separated in 1.5% agarose gel con-taining ethidium bromide. Products of expected size were isolated as gel slices, purified using DNA purification kit (TOYOBO), and cloned into pT7Blue vector (Novagen). Then, Escherichia coli strain DH5α (TOYOBO) was trans-formed with a ligated vector. More than three independ-ent clones were isolated for each gene and sequenced by dideoxy chain termination method using BigDye Termi-nator Cycle Sequencing Ready Kit (Applied Biosystems) and ABI PRISM 377 and 3100 DNA sequencers (Applied Biosystems).
The 3' ends of cDNAs were amplified using 3'RACE Sys-tem for Rapid Amplification of cDNA Ends (GIBCO BRL). The amplified fragments were purified, subcloned and sequenced in the same way as above.
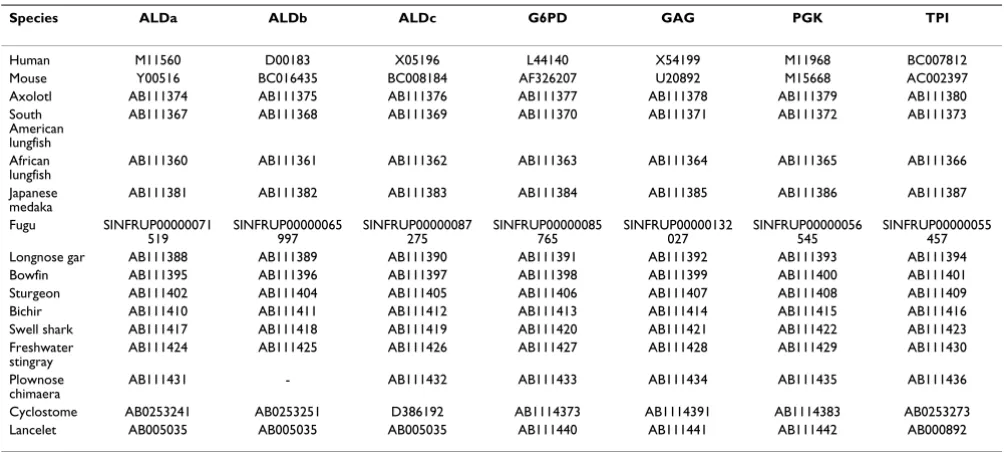
Sequence data
The following sequence data was taken from the DDBJ/ EMBL/GenBank database: the seven gene sequences from human, mouse and Takifugu rubripes (fugu); ALD gene sequences from Eptatretus burgeri (inshore hagfish), Lethenteron japonicum (Japanese lamprey) and B. belcheri; TPI gene sequences from L. reissneri and B. belcheri. The DDBJ/EMBL/GenBank accession number of each sequence data is shown in Table 5.
Phylogenetic tree inference
Multiple alignments of amino acid sequences were carried out by MAFFT[47], a multiple sequence alignment pro-gram recently developed by us, and manually inspected on the XCED sequence alignment editor.
Using the cyclostome and lancelet sequences as an out-group, phylogenetic analyses have been carried out by GAMT[26], a genetic algorithm-based ML method, with the JTT-F model [48,49]. Heterogeneity of evolutionary rates among sites was modeled by a discrete Γ distribution [50] with the optimized shape parameter α for each protein. A limited number of candidate tree topologies were generated by the following procedure and subjected Table 5: Sequence data used for the present analysis
Species ALDa ALDb ALDc G6PD GAG PGK TPI
Human M11560 D00183 X05196 L44140 X54199 M11968 BC007812
Mouse Y00516 BC016435 BC008184 AF326207 U20892 M15668 AC002397
Axolotl AB111374 AB111375 AB111376 AB111377 AB111378 AB111379 AB111380
South American lungfish
AB111367 AB111368 AB111369 AB111370 AB111371 AB111372 AB111373
African
lungfish AB111360 AB111361 AB111362 AB111363 AB111364 AB111365 AB111366
Japanese
medaka AB111381 AB111382 AB111383 AB111384 AB111385 AB111386 AB111387
Fugu SINFRUP00000071
519 SINFRUP00000065997 SINFRUP00000087275 SINFRUP00000085765 SINFRUP00000132027 SINFRUP00000056545 SINFRUP00000055457
Longnose gar AB111388 AB111389 AB111390 AB111391 AB111392 AB111393 AB111394
Bowfin AB111395 AB111396 AB111397 AB111398 AB111399 AB111400 AB111401
Sturgeon AB111402 AB111404 AB111405 AB111406 AB111407 AB111408 AB111409
Bichir AB111410 AB111411 AB111412 AB111413 AB111414 AB111415 AB111416
Swell shark AB111417 AB111418 AB111419 AB111420 AB111421 AB111422 AB111423
Freshwater stingray
AB111424 AB111425 AB111426 AB111427 AB111428 AB111429 AB111430
Plownose chimaera
AB111431 - AB111432 AB111433 AB111434 AB111435 AB111436
Cyclostome AB0253241 AB0253251 D386192 AB1114373 AB1114391 AB1114383 AB0253273
Lancelet AB005035 AB005035 AB005035 AB111440 AB111441 AB111442 AB000892
DDBJ/EMBL/GenBank accession numbers of sequences used in the present analysis are shown, except for fugu sequences, for which Ensembl transcript IDs are shown. Abbreviation for each protein name: ALDa, fructose-bisphosphate aldolase A; ALDb, fructose-bisphosphate aldolase B; ALDc, fructose-bisphosphate aldolase C; G6PD, glucose-6-phosphate 1-dehydrogenase; GAG, a trifunctional protein with glycinamide
to the comparison of likelihood values and statistical tests.
For alignment constructed from each of the seven protein sequences and that of the concatenated sequences, the GAMT program [26] was applied. GAMT is a method for searching for the ML tree based on the genetic algorithm (GA), outputting the best tree as well as multiple alternative trees each of which has a likelihood value close to the best one. The outline of the procedure is as follows: (i) The initial population of tree topologies is generated by applying the NJ method [51] to alignments generated by the bootstrap resampling. (ii) The fitness value for the best tree in the population is set to a constant value Nw, that for the second best one is set to Nw-1, and so on. (iii) A new tree i is generated by applying either of two opera-tors (mutation or crossover) to trees picked up from the current population according to their fitness values. (iv) If there is a tree j with ∆ lnLj/σj > ∆lnLi/σi in the current pop-ulation, tree i replaces tree j, where ∆ lnLi(= lnLbest-lnLi) is the log-likelihood difference between tree i and the best tree in the current population, and σi is the standard devi-ation of ∆ lnLi. (v) The procedure from steps (ii-iv) is repeated Ne times. Parameters used in the present analysis are as follows: Nw = 100 and Ne = 10,000.
This procedure was repeated for the seven different pro-teins and the concatenated alignment. The resulting topologies with ∆ lnLi < σi from each of the seven proteins were selected as candidate ones. Additional topologies with σi ≤∆ lnLi < 3 σi were also selected from the concate-nated alignment. For the all candidate topologies selected, the log-likelihood values were computed from the seven protein sequence data sets, and totaled following the pro-cedure of Kishino et al. [52] using the TOTALML program from the MOLPHY package [48]. This procedure is hereaf-ter referred to as 'totalml' analysis. Another type of log-likelihood value was computed from the concatenated alignment for each candidate topology. This procedure is hereafter referred to as 'concatenated alignment' analysis.
Statistical tests
The following known statistical tests (i-vii) were carried out in the present analysis. (i) Kishino-Hasegawa (KH) test and (ii) approximately unbiased (AU) test were car-ried out using the CONSEL package [53]. (iii) Bayesian posterior probability (BPP) value of each of the candidate topologies was also computed using the CONSEL package [53]. (iv) Bootstrap probability value for a hypothesis was computed by applying the RELL (resampling of estimated log-likelihoods) approximation [52] to the candidate topologies and then totaling the bootstrap probabilities of the candidates supporting the hypothesis. This value is referred to as RELL BP value or simply BP value. (v) The MRBAYES program [30] was applied to the concatenate
alignment. Default settings were used except for aamodel = jones, rates = gamma, ngen = 200,000 and burnin = 100. (vi) The TREE-PUZZLE program [29] was applied to the concatenate alignment. (vii) Intact bootstrap probability was also computed for the concatenated alignment. The calculation procedure is simple, but time-consuming; the ML tree was inferred by the GAMT program independ-ently for each of the 100 alignments generated by boot-strap resampling, and the number of the ML trees supporting the hypothesis was counted. This value is referred to as intact BP value. The first four methods (i-iv), which are for testing given candidate topologies, were applied to both totalml and concatenated alignment anal-yses, whereas the last three methods (v-vii), each of which is for inferring a phylogenetic tree, were applied to the concatenated alignment without setting any candidate topologies.
Authors' contributions
K Kikugawa carried out the labwork and phylogenetic analysis. K Katoh carried out phylogenetic analysis and wrote the manuscript. S Kuraku and N Iwabe developed laboratory protocols, provided a part of sequence data, and supervised the labwork and phylogenetic analysis. H Sakurai and O Ishida carried out collection and prepara-tion of plownose chimaera embryos. T Miyata designed the study and edited the manuscript.
List of abbreviations
ALDa, bisphosphate aldolase A; ALDb, fructose-bisphosphate aldolase B; ALDc, fructose-fructose-bisphosphate aldolase C; G6PD, glucose-6-phosphate 1-dehydrogenase; GAG, a trifunctional protein with glycinamide ribonucle-otide synthetase (GARS)-aminoimidazole ribonucleribonucle-otide synthetase (AIRS)-glycinamide ribonucleotide formyl-transferase (GART); PGK, phosphoglycerate kinase; TPI, triosephosphate isomerase; LSU rRNA, large-subunit ribosomal RNA.
Acknowledgements
We thank Dr K Kuma for discussion, and Ms K Shibamoto for technical assistance. This work was supported in part by Grants-in-Aid for Creative Scientific Research and COE Research from the Ministry of Education, Cul-ture, Sports, Science and Technology of Japan.
References
1. Rasmussen AS, Arnason U: Phylogenetic studies of complete mitochondrial molecules place cartilaginous fishes within the tree of bony fishes.J Mol Evol 1999, 48:118-123.
2. Rasmussen AS, Arnason U: Molecular studies suggest that carti-laginous fishes have a terminal position in the piscine tree.
Proc Natl Acad Sci USA 1999, 96:2177-2182.
3. Arnason U, Gullberg A, Janke A: Molecular phylogenetics of gna-thostomous (jawed) fishes: old bones, new cartilage. Zool Scripta 2001, 30:249-249.
4. Naylor GJP, Brown WM: Structural biology and phylogenetic estimation.Nature 1997, 388:527-528.
rooting contradictions to living bony vertebrates.Mol Biol Evol
1998, 15:1637-1646.
6. Zardoya R, Meyer A: Vertebrate phylogeny: limits of inference of mitochondrial genome and nuclear rDNA sequence data due to an adverse phylogenetic signal/noise ratio. In Major Events in Early Vertebrate Evolution Edited by: Ahlberg PE. London: Taylor & Francis; 2001:135-155.
7. Cotton JA, Page RD: Going nuclear: gene family evolution and vertebrate phylogeny reconciled.Proc R Soc Lond B Biol Sci 2002,
269:1555-1561.
8. Rivera MC, Lake JA: Evidence that eukaryotes and eocyte prokaryotes are immediate relatives.Science 1992, 257:74-76. 9. Venkatesh B, Erdmann MV, Brenner S: Molecular
synapomor-phies resolve evolutionary relationships of extant jawed vertebrates.Proc Natl Acad Sci USA 2001, 98:11382-11387. 10. Dimmick WW: Spliceosomal introns and fish phylogeny: a
crit-ical reanalysis.Copeia 2001, 2001:536-541.
11. Martin A: The phylogenetic placement of chondrichthyes: inferences from analysis of multiple genes and implications for comparative studies.Genetica 2001, 111:349-357.
12. Hedges SB: Molecular evidence for the early history of living vertebrates. In Major Events in Early Vertebrate Evolution Edited by:
Ahlberg PE. London: Taylor & Francis; 2001:119-134.
13. Takezaki N, Figueroa F, Zaleska-Rutczynska Z, Klein J: Molecular phylogeny of early vertebrates: monophyly of the agnathans as revealed by sequences of 35 genes. Mol Biol Evol 2003,
20:287-292.
14. Nelson JS: Fish of the World 3rd edition. New York: John Wiley & Sons, Inc.; 1994.
15. Arratia G: The sister-group of teleostei: consensus and disagreements.J Vertebr Paleontol 2001, 21:767-773.
16. Inoue JG, Miya M, Tsukamoto K, Nishida M: Basal actinopterygian relationships: a mitogenomic perspective on the phylogeny of the 'ancient fish'.Mol Phylogenet Evol 2003, 26:110-120. 17. Normark BB, McCune AR, Harrison RG: Phylogenetic
relation-ships of neopterygian fishes, inferred from mitochondrial sequences.Mol Biol Evol 1991, 8:819-834.
18. Lê HL, Lecointre G, Perasso R: A 28s rRNA-based phylogeny of the gnathostomes: first steps in the analysis of conflict and congruence with morphologically based cladograms.Mol Phy-logenet Evol 1993, 2:31-51.
19. Takezaki N, Gojobori T: Correct and incorrect vertebrate phy-logenies obtained by the entire mitochondrial sequences.Mol Biol Evol 1999, 16:590-601.
20. Iwabe N, Kuma K, Nikoh N, Miyata T: Molecular clock for dating of divergence between animal phyla. Jpn J Genet 1995,
70:687-692.
21. Nikoh N, Iwabe N, Kuma K, Ohno M, Sugiyama T, Watanabe Y, Yasui K, Shi-cui Z, Hori K, Shimura Y, Miyata T: An estimate of diver-gence time of parazoa and eumetazoa and that of cephalo-chordata and vertebrata by aldolase and triose phosphate isomerase clocks.J Mol Evol 1997, 45:97-106.
22. Merritt TJ, Quattro JM: Evidence for a period of directional selection following gene duplication in a neurally expressed locus of triosephosphate isomerase. Genetics 2001,
159:689-697.
23. Felsenstein J: Cases in which parsimony and compatibility methods will be positively misleading. Syst Zool 1978,
27:401-410.
24. Zhang R, Yatsuki H, Kusakabe T, Iwabe N, Miyata T, Imai T, Yoshida M, Hori K: Structures of cDNAs encoding the muscle-type and non-muscle-type isozymes of lamprey fructose bisphos-phate aldolases and the evolution of aldolase genes.J Biochem (Tokyo) 1995, 117:545-553.
25. Kuraku S, Hoshiyama D, Katoh K, Suga H, Miyata T: Monophyly of lampreys and hagfishes supported by nuclear-coded genes.J Mol Evol 1999, 49:729-735.
26. Katoh K, Kuma K, Miyata T: Genetic algorithm-based maxi-mum-likelihood analysis for molecular phylogeny.J Mol Evol
2001, 53:477-484.
27. Buckley T: Model misspecification and probabilistic tests of topology: evidence from empirical data sets.Syst Biol 2001,
51:509-523.
28. Suzuki Y, Glazko GV, Nei M: Overcredibility of molecular phyl-ogenies obtained by bayesian phylogenetics.Proc Natl Acad Sci USA 2002, 99:16138-16143.
29. Strimmer K, von Haeseler A: Quartet puzzling: a quartet maxi-mum-likelihood method for reconstructing tree topologies.
Mol Biol Evol 1996, 13:964-969.
30. Huelsenbeck JP, Ronquist F: MrBayes: Bayesian inference of phy-logenetic trees.Bioinformatics 2001, 17:754-755.
31. Thomas WK, Beckenbach AT: Variation in salmonid mitochon-drial: evolutionary constraints and mechanisms of substitution.J Mol Evol 1989, 29:233-245.
32. Adachi J, Cao Y, Hasegawa M: Tempo and mode of mitochon-drial evolution in vertebrates at the amino acid sequence level: rapid evolution in warm-blooded vertebrates.J Mol Evol
1993, 36:270-281.
33. Meyer A, Wilson AC: Origin of tetrapods inferred from their mitochondrial affiliation to lungfish.J Mol Evol 1990, 31:359-364. 34. Gorr T, Kleinschmidt T, Fricke H: Close tetrapod relationships of the coelacanth latimeria indicated by haemoglobin sequences.Nature 1991, 351:394-397.
35. Zardoya R, Cao Y, Hasegawa M, Meyer A: Searching for the clos-est living relative(s) of tetrapods through evolutionary anal-yses of mitochondrial and nuclear data. Mol Biol Evol 1998,
15:506-517.
36. Zardoya R, Meyer A: Evolutionary relationships of the coela-canth, lungfishes, and tetrapods based on the 28s ribosomal gene.Proc Natl Acad Sci USA 1996, 93:5449-5454.
37. Tohyama Y, Ichimiya T, Kasama-Yoshida H, Cao Y, Hasegawa M, Kojima H, Tamai Y, Kurihara T: Phylogenetic relation of lungfish indicated by the amino acid sequence of myelin dm20.Mol Brain Res 2000, 80:256-259.
38. Romer AS, Persons TS: The Vertebrate Body 6th edition. New York: WB Saunders Co; 1986.
39. Zhu M, Yu X, Ahlberg PE: A primitive sarcopterygian fish with an eyestalk.Nature 2001, 410:81-84.
40. Zhu M, Yu X: A primitive fish close to the common ancestor of tetrapods and lungfish.Nature 2002, 418:767-770.
41. Kumar S, Hedges SB: A molecular timescale for vertebrate evolution.Nature 1998, 392:917-920.
42. Olsen PE: The skull and pectoral girdle of the parasemionotid fish watsonulus eugnathoides from the early triassic sakamena group of madagascar, with comments on the relationships of the holostean fishes.J Vertebr Paleontol 1984, 4:481-499. 43. Waddell PJ, Kishino H, Ota R: Very fast algorithms for
evaluat-ing the stability of ML and Bayesian phylogenetic trees from sequence data.Ser Workshop Genome Inform 2002, 13:82-92. 44. Janvier P: Early VertebratesOxford: Clarendon Press; 1996.
45. Grande L, Bemis WE: Interrelationships of Acipenseriformes, with comments on "Chondrostei". In Interrelationships of Fishes
Edited by: Stiassny MLJ, Parenti LR, Johnson GD. San Diego: Academic Press; 1996:85-115.
46. Venkatesh B, Ning Y, Brenner S: Late changes in spliceosomal introns define clades in vertebrate evolution.Proc Natl Acad Sci USA 1999, 96:10267-10271.
47. Katoh K, Misawa K, Kuma K, Miyata T: MAFFT: a novel method for rapid multiple sequence alignment based on fast fourier transform.Nucleic Acids Res 2002, 30:3059-3066.
48. Adachi J, Hasegawa M: MOLPHY version 2.3: Programs for molecular phylogenetics based on maximum likelihood. In
Computer Science MonographsVolume 28. Tokyo: Inst Stat Math; 1996. 49. Jones DT, Taylor WR, Thornton JM: The rapid generation of mutation data matrices from protein sequences.Comput Appl Biosci 1992, 8:275-282.
50. Yang Z: Maximum likelihood phylogenetic estimation from sequences with variable rates over sites: approximate methods.J Mol Evol 1994, 39:306-314.
51. Saitou N, Nei M: The neighbor-joining method: a new method for reconstructing phylogenetic trees. Mol Biol Evol 1987,
4:406-425.
52. Kishino H, Miyata T, Hasegawa M: Maximum likelihood inference of protein phylogeny, and the origin of chloroplasts.J Mol Evol
1990, 31:151-160.
53. Shimodaira H, Hasegawa M: CONSEL: for assessing the confi-dence of phylogenetic tree selection. Bioinformatics 2001,
17:1246-1247.
54. Stock DW, Whitt GS: Evidence from 18s ribosomal sequences that lampreys and hagfishes form a natural group.Science