University of New Orleans University of New Orleans
ScholarWorks@UNO
ScholarWorks@UNO
University of New Orleans Theses and
Dissertations Dissertations and Theses
Summer 8-13-2014
Determining Kinetics for Simulated Sunlight-Exposed Oil
Determining Kinetics for Simulated Sunlight-Exposed Oil
Compounds
Compounds
Dustin D. Kountz
University of New Orleans, [email protected]
Follow this and additional works at: https://scholarworks.uno.edu/td
Part of the Analytical Chemistry Commons
Recommended Citation Recommended Citation
Kountz, Dustin D., "Determining Kinetics for Simulated Sunlight-Exposed Oil Compounds" (2014). University of New Orleans Theses and Dissertations. 1879.
https://scholarworks.uno.edu/td/1879
This Thesis is protected by copyright and/or related rights. It has been brought to you by ScholarWorks@UNO with permission from the rights-holder(s). You are free to use this Thesis in any way that is permitted by the copyright and related rights legislation that applies to your use. For other uses you need to obtain permission from the rights-holder(s) directly, unless additional rights are indicated by a Creative Commons license in the record and/or on the work itself.
Determining Kinetics for Simulated Sunlight-Exposed Oil Compounds
A Thesis
Submitted to the Graduate Faculty of the University of New Orleans in partial fulfillment of the requirements for the degree of
Masters of Science in
Chemistry
by
Dustin D Kountz
ii
iii
Dedication
iv
Acknowledgements
v
Table of Contents
List of Figures ... vi
List of Tables ... vii
Abstract ... viii
Chapter 1 ...1
Oil Spill Disasters and Impact ...1
Crude Oil Components and the Weathering Process ...6
PAHs and the Environment ...11
Detection of PAHs ...13
Chapter 2 ...21
Kinetics of Photochemical Behavior of Single and Binary PAH Mixtures in Simulated Oil Matrices: Implications for Environmental Photochemistry ...21
Introduction ...21
Materials and Methods ...23
Instrumentation ...23
Sample Preparation ...24
Results and Discussion ...25
Conclusion ...40
Chapter 3 ...41
Future Work ...41
References ...44
vi
List of Figures
1.1. Processes in the fate of weathered oil ...9
1.2. Common PAHs and structures ...11
1.3. Instrumental design for a single-beam UV-Vis photometer ...15
1.4. Jablonski Diagram ...16
1.5. Schematic of a typical HPLC ...18
1.6. Schematic of a GC-MS/GC-FID ...20
2.1 Zero order kinetic model for degradation of phenanthrene ...26
2.2. Second order kinetic model for degradation of anthracene ...27
2.3. Zero order kinetic model for degradation of anthracene (phenanthrene) ...28
2.4. First order kinetic model for degradation of anthracene (pyrene) ...29
2.5. Degradation comparison of anthracene ...29
2.6. First order kinetic model for degradation of pyrene ...30
2.7. First order kinetic model for degradation of pyrene (phenanthrene) ...31
2.8. First order kinetic model for degradation of pyrene (anthracene) ...31
2.9. Degradation comparison of pyrene ...32
2.10. First order kinetic model for degradation of tetracene...33
2.11. Degradation comparison of tetracene ...33
2.12. First order kinetic model for degradation of perylene ...34
2.13. First order kinetic model for degradation of perylene (phenanthrene) ...35
2.14. Degradation comparison of perylene ...35
2.15. First order kinetic model for degradation of chrysene ...36
2.16. First order kinetic model for degradation of chrysene (phenanthrene)...37
vii
List of Tables
1.1. Origin and SARA distribution for three different crude oils ...7 2.1. Excitation and emission wavelengths for individual and binary mixtures of PAHs and
viii
Abstract
Understanding of the fate of oil in the environment is of utmost importance; however, accurate, predictive models are still in very early stages. To aid in the development of these models, photodegradation of selected polycyclic aromatic hydrocarbons (PAHs) in an n-alkane hydrocarbon matrix was followed for individual PAHs and mixtures of PAHs similar to that found in the Deepwater Horizon spill. Tetracene in tetradecane photodegraded quickest of all observed PAHs, with a loss of 99% after only one hour of irradiation. Binary mixtures of PAHs showed different degradation amounts, including changes in PAH kinetics. These results suggest that the formation of dimers or aggregates as well as photosensitization reaction is important in the degradation of PAHs in oil. Kinetics of PAH photodegradation and PAH sensitized
photodegradation will be presented. This information will provide a better understanding of the fate of oil in environmental systems.
1
Chapter 1
Oil Spills, Components, and Detection Methods
Oil Spill Disasters and Impact
In the twenty-first century, the United States averages using 19.5 million barrels of petroleum per day, which equates to three gallons per person. (Deffeyes, 2001) Matt Kelso of Fractracker estimates that there are over 1.1 million active oil and gas wells in the US. (Kelso, 2014) According to Information Handling Services Inc. (IHS), the number of offshore oil rigs last year totaled 781. (IHS, 2014) The primary means of moving this crude oil to consumer markets is via America’s 170,000 miles of petroleum transmission pipelines. (API, 2014) What does all this data mean? At any given moment, our forests, our oceans, our ecosystems, and our environment can be potentially devastated by an oil spill disaster.
2
Kalke et al suggested that this loss of oxygenated layer could reduce subsurface benthic production and alter processes such as nutrient regeneration. (Kalke et al., 1982) Hall et al concluded that three sea turtles found dead after the Ixtoc I oil spill had petroleum hydrocarbons in all tissues examined and that the level of exposure was chronic. According to the study, the sea turtles may have consumed 50,000 ppm or more of oil. (Hall et al., 1983)
At 12:04 am on March 24, 1989, the Exxon Valdez, after being redirected from the normal traffic lanes of the Prince William Sound, came to rest facing roughly southwest, perched across a pinnacle on Bligh Reef. Eight of the eleven tanks of the Valdez were punctured, spilling 5.8 million gallons of oil throughout the next three hours. The response capabilities of the
Alyeska Pipeline Service Company were slow and ultimately inadequate. The Exxon
3
(Kelso and Kendziorek, 1991) Pritchard et al documented the use of bioremediation as a
supplemental cleanup technology in the Valdez oil spill. Their study presented the effectiveness of an oleophilic fertilizer on oil degradation in conjunction with indigenous microflora on the beaches of the Prince William Sound. The fertilizer enhanced biodegradation of the oil by 2-fold relative to the untreated controls. The fertilizer was also verified as a useful nutrient source; however, the contribution of the fertilizer towards enhancing biodegradation was poorly understood. (Pritchard et al., 1992)
As with the Ixtoc I oil spill, the negative impact on the surrounding ecosystem of the Exxon Valdez was apparent. Oncorhynchus gorbuscha (pink salmon) embryos from the Prince William Sound were studied from 1989 to 1992 by Bue et al. Pink salmon embryo mortality was elevated in oil-affected streams during the fall of each year. Increased embryo mortality was detected in the lower intertidal zones in 1989, at the highest intertidal zone in 1990, and in all intertidal zones (as well as upstream of oil contamination) in 1991. (Bue et al., 1996) Sellin et al developed a quantitative risk model for polycyclic aromatic hydrocarbon photoinduced toxicity in Pacific herring following the Exxon Valdez oil spill utilizing the median lethal times (LT50) from whole-body phototoxic PAH concentrations. Considering a worst case scenario of UVA and PAH conditions, herring found at a minimum depth of 0-2 m would be most susceptible to toxic conditions; however, a post hoc assessment determined that less than 1% of the herring population would have been present at that depth during the oil spill in 1989. (Sellin Jeffries et al., 2013)
4
million US gal) had been discharged into the Gulf of Mexico. Not only was this the largest marine oil spill in US history, but it was also considered the largest accidental marine oil spill in the history of the petroleum industry. Jyllian Kemsley’s “After Disaster” article presents that less than 20% of the oil was recovered directly from the wellhead or by skimming the gulf surface, while approximately 5% was burned. The remaining 75%, neither burned nor recovered, wound up dissolved in the water column, evaporated into the air, stuck to the
coastline, or settled on the seafloor. Although federal waters reopened for fishing within a year, effects on the Gulf ecosystem were far from over. Oil remains were found in sediment samples, harming insects in shallow marsh water along with potentially causing long-term health
consequences for fish and plant life. (Kemsley, 2013)
5
Some research presented promising results for the biological impact of the Deepwater spill. Seafood samples from the fishing ground closure areas of the Mississippi Gulf Coast were collected and analyzed for twenty-five 2- to 6-ring PAHs, about one month after the first day of the oil spill. Overall, the levels of PAHs in all the tested seafood samples collected within a one-year period after the incident were far below the public health Levels of Concern (LOC)
established jointly by NOAA/FDA/Gulf Coast states under the protocol to reopen state and federal waters. (Xia et al., 2012) Fitzgerald and Gohlke suggested that there was only a minimal risk to public health from seafood collected from selected areas of the Gulf of Mexico after the oil spill. (Fitzgerald and Gohlke, 2014)
Other studies, however, depicted a more negative outlook. Paul et al looked at the toxicity and mutagenicity of Gulf of Mexico waters during and after the Deepwater Horizon oil spill. Through Microtox and Microscreen assays, their findings suggested that organisms in contact with these waters might experience DNA damage that could lead to mutation and heritable alterations to the community pangenome. (Paul et al., 2013) Wise et al found
6
dolphin populations. (Schwacke et al., 2013) According to the National Wildlife Federation (NWF), almost 40% of birds collected from the area surrounding the Deepwater Horizon spill showed visible signs of oiling. Spilled oil caused birds’ feathers to mat and separate, eventually leading to a loss of buoyancy and the ability to regulate body temperature. Many of the collected birds displayed skin and eye lesions where oil came into contact. (NWF, 2014)
These three previously described disasters all led to one common outcome: In order to fully understand the ramifications of an oil spill on the ecosystem, the fate of oil must be studied through its degradation mechanisms and kinetics. Understanding that this process of studying the impact of oil, dispersed oil, and the combination of both on the ecosystem of the Gulf of Mexico would be costly and time-consuming, BP committed $500 million over a 10-year period to create a research program at institutions primarily in the US Gulf Coast states. The objectives of this Gulf of Mexico Research Initiative (GoMRI) were as follows: “1. To investigate the impacts of the oil, dispersed oil, and dispersant on the ecosystems of the Gulf of Mexico and affected coastal states in a broad context of improving fundamental understanding of the dynamics of such events and the associated environmental stresses and public health implications; 2. To fund research into improved spill mitigation, oil and gas detection,
characterization and remediation technologies; and 3. To improve society’s ability to understand, respond to, and mitigate the impacts of petroleum pollution and related stressors of the marine and coastal ecosystems, with an emphasis on conditions found in the Gulf of Mexico.” (GoMRI, 2013) The study described in this thesis was funded by the Gulf of Mexico Research Initiative.
Crude Oil Components and the Weathering Process
7
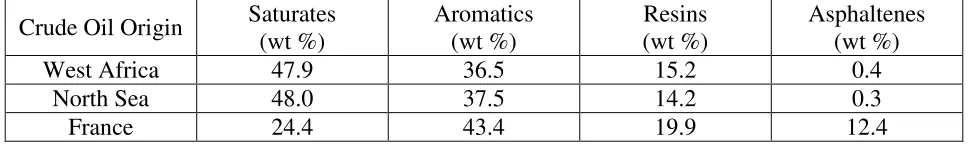
analysis method, which divides crude oil components according to their polarizability and polarity. The saturate, or S, fraction consists of nonpolar material including linear, branched, and cyclic saturated hydrocarbons. These are commonly referred to as n-paraffins, isoparaffins, and cycloparaffins (cycloalkanes). The aromatics fraction (A) consist of monocyclic (benzene), dicyclic (naphthalene), or polycyclic aromatic hydrocarbons (PAHs), which are multi-ring aromatic molecules. Resins (R) and asphaltenes (A) both contain polar substituents; however, resins are miscible with heptane or pentane, while asphaltenes are insoluble in an excess of heptane or pentane (but readily dissolve in toluene). Both resins (smaller compounds such as thiols) and asphaltenes are normally present at low concentrations in crude oil, and the chemical compositions vary between different oils. (Fan et al.) (Fuhr et al., 2005) Aske et al determined the SARA distribution for 18 crude oils from areas of West Africa, the North Sea, and France. (Aske et al., 2001) Table 1.1 shows the SARA weight percentage (wt %) of one individual crude oil from each area sampled.
Table 1.1. Origin and SARA distribution for three different crude oils. (Aske et al., 2001)
Crude Oil Origin Saturates (wt %)
Aromatics (wt %)
Resins (wt %)
Asphaltenes (wt %)
West Africa 47.9 36.5 15.2 0.4
North Sea 48.0 37.5 14.2 0.3
France 24.4 43.4 19.9 12.4
8
9
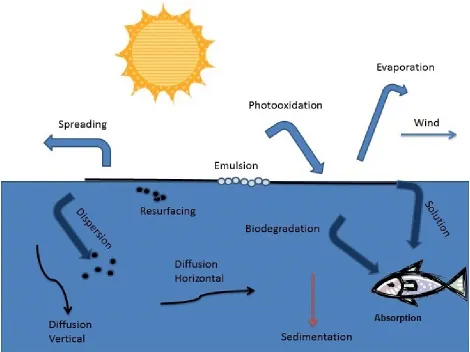
Figure 1.1. Processes in the fate of weathered oil.
Because crude oil is a complex mixture of organic compounds (mostly hydrocarbons), a process known as oxidation can alter these mixtures by creating new compounds or by
10
oil is impacted by anaerobic microbial oxidation. (Caldwell et al., 1998; Townsend et al., 2003; Francis, 2013)
Through the utilization of Fourier transform ion cyclotron resonance mass spectrometry (FTICR-MS), McKenna et al established the initial characterization of the molecules released into the Gulf of Mexico after the Deepwater Horizon explosion and subsequent weathering of the Macondo well petroleum. (McKenna et al., 2013) Through their research, McKenna et al
presented more than 16,000 unique molecular monoisotopic elemental compositions for the acidic (carboxylic acids, alcohols, pyrrolic nitrogen), basic (pyridinic nitrogen), and nonpolar components (aromatic hydrocarbons, furans) for parent Macondo well petroleum. Fu et al suggested that coupling of electrospray ionization (ESI) with FTICR-MS provided complete chemical characterization of thousands of polar constituents in crude oil. (Fu et al., 2006) ESI FTICR-MS was utilized by Hughey et al to identify multiple compound classes containing N, N2,
NS, NO, N2O, and SO (Hughey et al., 2001), while Qian et al identified 3000
nitrogen-containing aromatic compounds from a single ESI FTICR mass spectrum of heavy petroleum crude oil. (Qian et al., 2001)
Numerous studies have been conducted on the photooxidation of crude oil and its components, including Thominette et al who observed a decrease in the low molecular weight compounds and a formation of high molecular weight species (Thominette and Verdu, 1984), and D’Auria et al who studied the effect of UV irradiation on crude oil through the utilization of high pressure mercury lamps. (D'Auria et al., 2008) The photooxidation element of the
11
ultimately, the toxicity of these newly-formed compositions will be the focus of studies throughout the next decade.
PAHs and the Environment
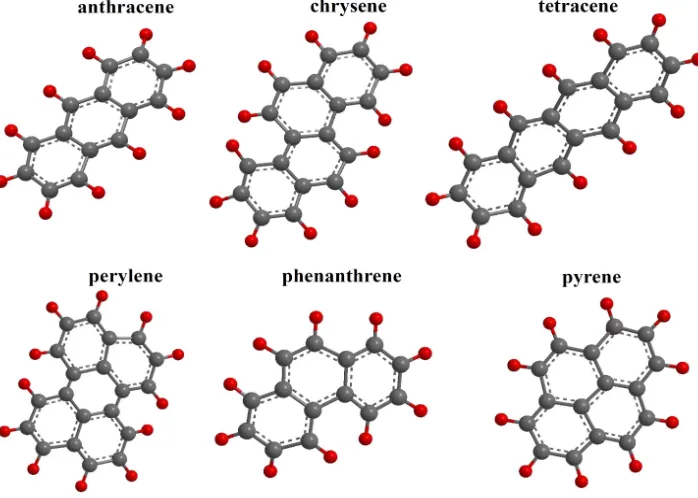
Polycyclic aromatic hydrocarbons, or PAHs, are composed of two or more aromatic (benzene) rings which are fused together when a pair of carbon atoms is shared between them. The resulting structure is a molecule where all carbon and hydrogen atoms lie in one plane. Naphthalene, which is composed of two fused benzene rings, has the lowest molecular weight of all PAHs. While the resistance to oxidation, reduction, and vaporization increases with the increasing molecular weight of PAHs, the aqueous solubility decreases. This change in properties results in different behavior of individual PAHs along with effects on biological systems. (Nagpal, 1993) Figure 1.2 shows the structure of selected PAHs.
12
PAHs are formed mainly as a result of pyrolytic processes, especially the incomplete combustion of organic materials during activities such as processing of coal and crude oil, combustion of natural gas, as well as in natural processes such as carbonization. (World Health Organization, 2000) Due to their lipophilic nature, PAHs can penetrate biological membranes and accumulate in organisms. (Oliva et al., 2010) PAHs are present in the environment in multiple compartments, including food, water, air, soil, and sediment. Menzie et al stated that food groups that tend to have the highest levels of PAHs are charcoal-broiled or smoked meats, leafy vegetables, grains, and fats and oils, while anthropogenic and nonanthropogenic sources of carcinogenic PAHs are found in all surface soils. (Menzie et al., 1992) Data from animal studies indicate that several PAHs may induce a number of adverse effects, such as immunotoxicity, genotoxicity, carcinogenicity, reproductive toxicity (affecting both male and female offspring), and may possibly also influence development of atherosclerosis. (World Health Organization, 2000)
The International Agency for Research on Cancer (IARC) has set up a classification system for PAHs based upon their possible carcinogenic nature to humans. (Lerda, 2010) The classification is as follows: 1-The PAH is carcinogenic to humans, and the exposure
13
The immediate danger of an oil spill is the hazardous effect on the environment and ecosystem. Because aromatics are such a large component of crude oil, the toxic nature of PAHs is a major concern for the aquatic life involved. Sundberg et al have studied the contribution of commonly analyzed PAHs to the potential toxicity in rainbow trout (Sundberg et al., 2006), while Cheney et al investigated the diverse effects of PAHs on the metabolic activity of freshwater bivalve mollusks. (Cheney et al., 2001) While these two studies confirmed the negative impact PAHs have on aquatic life, Unlu et al propose that PAHs found in the surficial sediments of Lake Iznik in Turkey have no short term, harmful biological effects on aquatic life. (Unlu et al., 2010) Regardless, the toxic nature of PAHs must continue to be studied to
determine the long term effects on the environment and ecosystem involved.
Detection of PAHs
PAHs possess very characteristic UV absorbance spectra while their absorbance bands are unique for each ring structure. Because of this, every isomer has a different UV absorbance spectrum from the others, which is particularly useful in the identification of PAHs. Most PAHs are also fluorescent, emitting characteristic wavelengths of light when they are excited. In the study described in Chapter 2, detection and quantification of PAHs was conducted mainly via fluorescence spectroscopy; however, since certain PAHs have very similar fluorescence spectra, other analytical methods, such as GC-FID and HPLC, were used in conjunction with
14 Instrumentation
UV-Vis Spectroscopy
Molecular absorbance spectroscopy is based on the transmittance (T) or absorbance (A) of solutions contained in transparent cells having a path length of (b) centimeters. According to Beer’s Law, absorbance is given by the following: A = -logT. This transmittance is given by the ratio P/PO, where P is the intensity of the light after passing through a sample and PO is the
intensity of light before it passes through the sample. Substituting for T, absorbance is equal to log(PO/P). (Skoog et al., 2007)
When radiation interacts with matter, a number of processes, including absorption can occur. Absorption of light by matter causes the energy content of the molecules or atoms present
to increase. This absorption of light, as is the case of PAHs, occurs in molecules containing π -electrons or non-bonding -electrons. These -electrons excite to higher anti-bonding molecular orbitals, where the gap between the highest occupied molecular orbital (HOMO) and the lowest unoccupied molecular orbital (LUMO) dictates the wavelength of light absorbed. (Plovdiv, 2012)
Figure 1.3. Instrumental design for a single
Fluorescence
Fluorescence occurs when a fluorescent capable material (a fluorophore) is excited into a higher electronic state by absorbing an incident photon
fluorophore (rigid, aromatic ring for example) emits a photon. usually occurs from the ground vibrational level of the an excited vibrational state of the gro
longer wavelengths than absorbance. The energies and relative intensities of the fluorescence signals give information about structure and environments of the fluorophores.
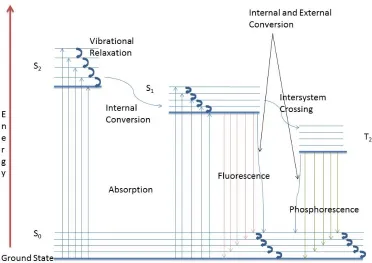
Figure 1.4 shows a Jablonski diagram that depicts the pathway of fluorescence.
A fluorescence emission spectrum is recorded when the excitation wavelength of light is held constant and the emission beam is scanned as a function of wavelength. An excitation spectrum is the opposite, whereby the emission light is held at a constant wavelength, and the
15
Instrumental design for a single-beam UV-Vis photometer.
Fluorescence occurs when a fluorescent capable material (a fluorophore) is excited into a higher electronic state by absorbing an incident photon. In order to return to the ground stat
fluorophore (rigid, aromatic ring for example) emits a photon. The emission (fluorescence) usually occurs from the ground vibrational level of the first excited electronic state and goes to an excited vibrational state of the ground electronic state; therefore, fluorescence signals occur at longer wavelengths than absorbance. The energies and relative intensities of the fluorescence signals give information about structure and environments of the fluorophores. (Harris, 2003
diagram that depicts the pathway of fluorescence.
A fluorescence emission spectrum is recorded when the excitation wavelength of light is held constant and the emission beam is scanned as a function of wavelength. An excitation
whereby the emission light is held at a constant wavelength, and the
Fluorescence occurs when a fluorescent capable material (a fluorophore) is excited into a higher to the ground state, the
(fluorescence) excited electronic state and goes to
luorescence signals occur at longer wavelengths than absorbance. The energies and relative intensities of the fluorescence
Harris, 2003)
A fluorescence emission spectrum is recorded when the excitation wavelength of light is held constant and the emission beam is scanned as a function of wavelength. An excitation
16
excitation light is scanned as a function of wavelength. An excitation spectrum looks very similar to an absorption spectrum. (Harris, 2003; Rodger, 2013)
Fluorescence spectroscopy is much more sensitive than UV-Vis (up to 105x), is highly selective (very few molecules fluoresce), and can detect concentrations as low as 1 nM.
However, since only a small amount of molecules do fluoresce, this type of spectroscopy is not applicable for all situations. Another disadvantage lies with the limit of detection. Because fluorescence can detect very small concentrations, noise can interfere with accurate
quantification by either masking fluorescence signal or producing signal where there actually is none. (Harris, 2003)
17
High-Performance Liquid Chromatography (HPLC)
High-performance liquid chromatography is an analytical technique that uses high pressure to force solvent through closed columns containing very fine particles that give high resolution separations. Not only is HPLC use to separate components in a mixture, but it is also able to identify and quantify each component. HPLC is based upon the relative polarity of the solvent(s) and stationary phase. In normal phase HPLC, the column is filled with tiny silica particles, while the solvent is non-polar, such as hexane. Polar compounds passing through the column will stick longer to the polar silica, while the non-polar compounds will pass more quickly through the column. In reverse phase HPLC, the silica in the column is made non-polar by attaching long hydrocarbon chains (with C8 or C18 typically) to its surface. The solvent used
in this technique is polar (methanol for example). (Harris, 2003; Clark, 2007) Figure 1.5 shows a schematic of an HPLC.
HPLC can be used in conjunction with many detectors, such as an ultraviolet, refractive index, electrochemical, fluorescence, mass spectrometry analyzer, or evaporative light-scattering detector. Each detector has its own approximate limit of detection, with the fluorescence
18
Figure 1.5. Schematic of a typical HPLC
Gas Chromatography
Gas chromatography (GC) is an analytical separation technique used to analyze volatile substances in the gas phase. In GC, a gaseous mobile phase (carrier gas) transports the analyte through the column, which is either coated on the inside with a nonvolatile liquid (gas-liquid partition chromatography) or coated with solid particles of a stationary phase (gas-solid
absorption chromatography). The mobile phase does not interact with the analyte. (Harris, 2003; Thet and Woo, 2013)
Narrow open tubular columns made of fused silica (SiO2) and coated with polyimide are
19
while support-coated columns contain solid particles attached to the inner wall coated with a stationary phase. Packed columns contain fine particles of solid support coated with a
nonvolatile liquid stationary phase. Regardless of which column is used, the column temperature must be high enough to provide sufficient vapor pressure for analytes to be eluted in a reasonable time. (Gilman and Jimenez, 2004; Thet and Woo, 2013)
Like HPLC, gas chromatography can be used in conjunction with many different types of detectors, such as a thermal conductivity detector, flame ionization detector (GC-FID), electron capture detector, or mass spectrometric analyzer (GC-MS). While a GC-FID can detect at low pg, a GC-MS can detect amounts down to 25 fg. The flame ionization detector is an analytical technique where the eluate is burned in a mixture of H2 and air, producing ions and electrons.
The charged particles create a current between the detector’s electrodes, which is measured as a signal. Mass spectrometry analyzers ionize molecules obtained from the GC. These ions are accelerated by an electric field and then are separated according to their mass-to-charge ratio. Figure 1.6 shows a schematic of a typical GC paired with either an FID or MS. (Harris, 2003)
Figure 1.6. Schematic of a GC-MS/GC
20
MS/GC-FID.
21
Chapter 2
Kinetics of Photochemical Behavior of Single and Binary PAH Mixtures in Simulated Oil Matrices: Implications for Environmental Photochemistry
Introduction
The kinetics and mechanisms of environmental transformation, carcinogenicity, and microbial degradation of polycyclic aromatic hydrocarbons have been extensively studied over the last 35 years. Fasnacht and Blough have detailed the mechanisms and quantum yields of the aqueous photodegradation of PAHs (Fasnacht and Blough, 2002, 2003a, b), while Woo et al have identified intermediates in the photocatalytic oxidation of PAHs (Woo et al., 2009). Recent attention was also focused on the photochemistry involved in the fate of the oil from the
Deepwater Horizon spill (King et al., 2011; Atlas et al., 2012; Boehm et al., 2012; Gutierrez et al., 2013; Mahmoudi et al., 2013; Sammarco et al., 2013; King et al., 2014), including work that quantitated amounts of hydroxyl radical (Ray and Tarr, 2014) and singlet oxygen (Ray and Tarr) produced from petroleum films exposed to sunlight. Elucidating the specific photochemical behavior of PAHs in complex oil matrices would lead to a useful understanding of oil spill degradation kinetics and improved model development for predicting the fate of spilled oil. To date, however, there has been little or no research on the kinetics and mechanisms of PAH photochemistry in an oil matrix, including the study of how PAH-PAH interactions affect photochemistry, and what role structure may play in PAH photolysis and photosensitization.
22
and aquatic life due to their carcinogenic nature (Sabate et al., 2001). The toxicity to phytoplankton of single and binary mixtures of PAHs was previously assessed (Meng et al., 2007). However, a full understanding of the toxicity of PAHs also requires study of their degradation products, including those produced through photochemistry. Such information would be more easily understood and utilized with an understanding of the photochemical behavior of single or mixed PAHs in oil.
While recent analytical achievements have been reported for oil component classification and characterization (Ahsan et al., 1997; McKenna et al., 2013), it is still necessary to fully understand the fate of spilled oil and the impact that each component has on degradation, both for isolated PAHs and for PAHs in combination with other fractions of oil. Many studies have been conducted on the role bacteria play in oil biodegradation (Yemashova et al., 2007;
Brooijmans et al., 2009; Rojo, 2009; Gutierrez et al., 2013; Mahmoudi et al., 2013) or on the photooxidation of crude oil fractions. (Ducreux and Lacaze, 1987; Jacquot et al., 1996; Boukir et al., 2001; Bobinger and Andersson, 2009); however, there is still a lack of understanding of individual PAH components and what role they may play in oil photodegradation.
23
Materials and Methods
Pure water (NP Water) was obtained by purification of distilled, deionized water with a Barnstead Nanopure UV water treatment system. Anthracene (99%), phenanthrene (98%), and pyrene (98%) were purchased from Alfa Aesar. GC grade n-tetradecane (99%) and hexane (95%) were purchased from Sigma Aldrich. Tetracene (99%) was purchased from Tokyo Chemical Industry. Perylene (99%) was purchased from Acros Organics. Chrysene (99%) was purchased from Fluka Analytical. Toluene (99.5%) was purchased from BDH Chemicals. GC grade dichloromethane (99.9%) and HPLC grade acetonitrile (ACN) were obtained from EMD Chemicals. Propanol (98%) was purchased from EM Science.
Instrumentation
For photochemical studies, an Atlas CPS+ solar simulator was used at an intensity
equivalent to approximately 1.3 times that of solar noon (AM 1.5). The optical spectrum of the irradiation source in the solar simulator used in our studies was similar to the optical spectrum of the sun, with a slightly higher intensity. The irradiance of our solar simulator set at its maximum output (765 W/cm2, 300-800 nm only) was equivalent to 1.26 times the intensity of full sunlight (1000 W/m2 full spectrum AM 1.5). Corrected t1/2 values for samples were calculated as t1/2 x
1.3. A calculated value of 3.95 h in our solar simulator represented an average day of insolation in the Gulf of Mexico (Ray and Tarr, 2014).
Fluorescence spectra were obtained using a Perkin Elmer LS55 Luminescence
24
containing a binary mixture of anthracene (9.7 ppm) and pyrene (15 ppm), an Agilent 1100 series HPLC with an Agilent Eclipse PAH column was utilized for separation followed by detection with a Hewlett Packard 1046A fluorescence detector with the following method: 1.8 mL/min flow rate; elution gradient of 60% acetonitrile and 40% H2O for 5 min, increased to
100% ACN from 5 to 6 min. Binary mixtures of chrysene and phenanthrene were analyzed using an Agilent 6890 GC with a flame ionization detector and a Hewlett Packard HP-5 column (30 m x 0.32 mm x 25 µm). The injector and detector temperatures were set to 330 °C and 350 °C, respectively, and the temperature programming was: 40 °C held for 2 min, ramp at 25 °C/min to 250 °C, ramp at 5 °C/min to 265 °C, ramp at 25 °C/min to final temperature of 300 °C and hold for 4 min. The injection volume was 3 µL.
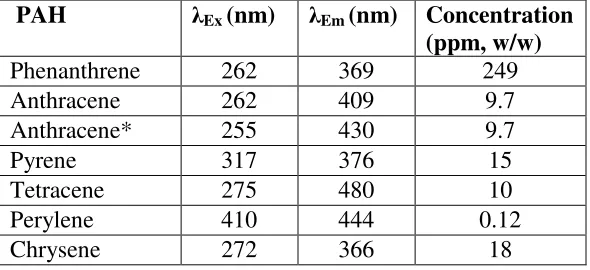
Table 2.1 Excitation and emission wavelengths for individual and binary mixtures of PAHs and concentration used for PAHs in tetradecane.
PAH λEx (nm) λEm (nm) Concentration
(ppm, w/w)
Phenanthrene 262 369 249
Anthracene 262 409 9.7
Anthracene* 255 430 9.7
Pyrene 317 376 15
Tetracene 275 480 10
Perylene 410 444 0.12
Chrysene 272 366 18
*in the presence of 249 ppm phenanthrene
Sample Preparation
25
tetradecane contained 20% toluene by volume. Mixtures of PAHs were prepared in the same manner except that two PAHs were present in the tetradecane.
For each sample, 200 µL of PAH in tetradecane/toluene solution was mixed with 2 mL of hexane and dispersed evenly on 10 mL of NP water in a jacketed borosilicate glass beaker (i.d. = 5 cm). The hexane and toluene were then allowed to evaporate. The result was a thin film (~80-100 µm) of PAH dispersed in tetradecane on top of the water. Triplicate samples were kept at 27 °C by circulating thermostated water throughout each jacketed beaker, and a quartz plate was placed on top of each beaker to reduce water evaporation. One dark control was completely covered with aluminum foil and kept at 27 °C. Samples were exposed to various irradiation times ranging from 5 minutes to 12 hours.
After irradiation, each irradiated sample and the dark control were separately extracted with 10 mL of dichloromethane twice, and the dichloromethane was dried over sodium sulfate. For the anthracene/pyrene binary mixtures, the extracts were evaporated to dryness with N2 and
then reconstituted in 14:5:1 propanol:water:toluene solution to facilitate HPLC analysis. The chrysene/phenanthrene binary extract was evaporated to dryness with N2 and then reconstituted
in 1 mL dichloromethane to concentrate the sample. All other samples were kept in the dichloromethane extract in the dark at 4 °C until an aliquot was measured by fluorescence.
Results and Discussion
26
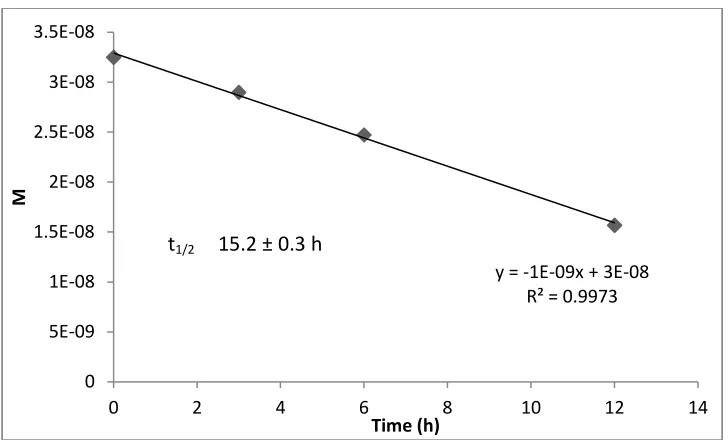
Figure 2.1. Zero order kinetic model for degradation of phenanthrene. Half-life calculated as [A0]/2k. Corrected t1/2 calculated using solar simulator factor of (t1/2 x 1.3).
At 10 ppm, 3 h irradiated anthracene samples degraded by 58 ± 2%. Six hour samples degraded by 79.1 ± 0.5%, while 12 h samples indicated a photodegradation amount of 87 ± 2%. Anthracene followed a second order kinetic model with an observed initial rate of 0.67 ± 0.06 µM h-1. (Figure 2.2)
y = -1E-09x + 3E-08 R² = 0.9973
0 5E-09 1E-08 1.5E-08 2E-08 2.5E-08 3E-08 3.5E-08
0 2 4 6 8 10 12 14
M
27
Figure 2.2. Second order kinetic model for degradation of anthracene. Half-life calculated as 1/k[A0]. Corrected t1/2 calculated using solar simulator factor of (t1/2 x 1.3).
Loss of anthracene when in the presence of phenanthrene was calculated over one, two, and three hour irradiation periods. After only three hours, anthracene loss was calculated as 95.3 ± 0.9%. Comparing the degradation of anthracene with no other PAH present to its degradation in a binary mixture of anthracene and phenanthrene, loss of anthracene increased by 1.6x for the binary mixture after 3 h of irradiation. Irradiations of 1 and 2 h for binary mixtures of
phenanthrene and anthracene showed an anthracene loss of 29 ± 2% and 64 ± 2% respectively. When irradiated by itself, anthracene followed a second order kinetic model; however, when in the presence of phenanthrene, anthracene followed a zero order kinetic model, with an observed rate of 0.323 ± 0.006 µM h-1. (Figure 2.3)
y = 16243x + 24293 R² = 0.9538
0 50000 100000 150000 200000 250000 300000
0 2 4 6 8 10 12 14
1
/M
28
Figure 2.3. Zero order kinetic model for degradation of anthracene in the presence of
(phenanthrene). Half-life calculated as [A0]/2k. Corrected t1/2 calculated using solar simulator
factor of (t1/2 x 1.3).
When combined with pyrene, anthracene showed losses of 49 ± 2%, 82 ± 2%, and 98 ± 1% for 3 h, 6 h, and 12 h irradiations, respectively. In this binary mixture, anthracene
photodegradation followed a first order kinetic model (Figure 2.4), compared to second order when irradiated by itself and zero order when irradiated in the presence of phenanthrene. The t1/2
for anthracene with pyrene present was calculated as 3.21 ± 0.08 h. Since all three experiments involving anthracene exhibited different kinetics, it was impossible to directly compare the observed half-lives. Figure 2.5 compares the kinetics of anthracene photodegradation in these experiments.
y = -9E-06x + 3E-05 R² = 0.9958
0 0.000005 0.00001 0.000015 0.00002 0.000025 0.00003
0 0.5 1 1.5 2 2.5 3 3.5
M
29
Figure 2.4. First order kinetic model for degradation of anthracene in the presence of (pyrene). Half-life calculated as 0.693/k. Corrected t1/2 calculated using solar simulator factor of (t1/2 x
1.3).
Figure 2.5. Degradation comparison of anthracene when irradiated alone in tetradecane () and when in irradiated in tetradecane in the presence of phenanthrene () or pyrene (). Error bars represent one standard deviation with N = 3.
y = -0.2812x + 0.0912 R² = 0.9945
-3.5 -3 -2.5 -2 -1.5 -1 -0.5 0
0 2 4 6 8 10 12 14
N a tu ra l Lo g ( A n th ra ce n e ) Time (h) t1/2 3.21 ± 0.08 h
0 0.1 0.2 0.3 0.4 0.5 0.6 0.7 0.8 0.9 1
0 2 4 6 8 10 12
C
/C
o
30
Three, six, and twelve hour irradiations of pyrene showed PAH losses of 34 ± 2%, 61 ± 3%, and 81 ± 1%, respectively. This degradation pattern followed a first order kinetic model with a t1/2 of 6.2 ± 0.2 h (Figure 2.6). In the presence of phenanthrene, pyrene photodegradation
was substantially inhibited, requiring twice as much irradiation time to achieve 60% degradation. The first order kinetic behavior of pyrene did not change when another PAH was present. With phenanthrene present, the measured t1/2 of pyrene was 10.3 ± 0.5 h (Figure 2.7), which is 1.6x
larger than the t1/2 for pyrene irradiated by itself. When irradiated in the presence of anthracene,
pyrene loss of 51 ± 4%, 63.9 ± 0.5%, and 78 ± 2% was seen for three, six, and twelve hours, respectively. The t1/2 of pyrene in the presence of anthracene was calculated as 7.5 ± 0.5 h
(Figure 2.8). First order kinetic behavior was observed regardless of whether phenanthrene or anthracene was present. Figure 2.9 shows degradation comparisons of pyrene irradiated by itself in tetradecance and when in the presence of other PAHs.
Figure 2.6. First order kinetic model for degradation of pyrene. Half-life calculated as 0.693/k. Corrected t1/2 calculated using solar simulator factor of (t1/2 x 1.3).
y = -0.1447x - 0.0283 R² = 0.9914
-2 -1.8 -1.6 -1.4 -1.2 -1 -0.8 -0.6 -0.4 -0.2 0
0 2 4 6 8 10 12 14
31
Figure 2.7. First order kinetic model for degradation of pyrene in the presence of
(phenanthrene). Half-life calculated as 0.693/k. Corrected t1/2 calculated using solar simulator
factor of (t1/2 x 1.3).
Figure 2.8. First order kinetic model for degradation of pyrene in the presence of (anthracene). Half-life calculated as 0.693/k. Corrected t1/2 calculated using solar simulator factor of (t1/2 x
1.3).
y = -0.0875x + 0.0208 R² = 0.9812
-1.2 -1 -0.8 -0.6 -0.4 -0.2 0
0 2 4 6 8 10 12 14
N a tu ra l Lo g ( P y re n e w it h P h ) Time (h) t1/2 10.3 ± 0.5 h
y = -0.1203x - 0.0795 R² = 0.9727
-1.6 -1.4 -1.2 -1 -0.8 -0.6 -0.4 -0.2 0
0 5 10 15
32
Figure 2.9. First order kinetic model comparison of pyrene when irradiated by itself () and when in the presence of anthracene () or phenanthrene ().
Although tetracene was not reported in MC252 oil, it is a known PAH found in crude oil (Law, 1955). Tetracene photodegraded the quickest of all observed PAHs, showing a loss of 99.771 ± 0.006% after only 1 h in the solar simulator. In addition, losses of 57 ± 4% for 0.08 h and 72.5 ± 0.4% for 0.17 h indicated a first order kinetic model, with a t1/2 of 0.151 ± 0.003 h
(Figure 2.10). As when irradiated by itself, tetracene photodegradation in the presence of phenanthrene was faster than all other binary mixtures of PAHs. After 0.08 h of irradiation in the presence of phenanthrene, tetracene loss was calculated at 53.3 ± 0.3%, while 0.17 h irradiated samples showed a loss of 69.53 ± .02%. Tetracene loss of 98.44 ± 0.06% was seen after 1 h. The kinetic behavior did not change significantly when tetracene was irradiated in the presence of phenanthrene. Figure 2.11 shows a comparison of tetracene degradation by itself and when in the presence of phenanthrene.
-2 -1.8 -1.6 -1.4 -1.2 -1 -0.8 -0.6 -0.4 -0.2 0
0 2 4 6 8 10 12 14
N
a
tu
ra
l
Lo
g
33
Figure 2.10. First order kinetic model for degradation of tetracene. Half-life calculated as 0.693/k. Corrected t1/2 calculated using solar simulator factor of (t1/2 x 1.3).
Figure 2.11. First order kinetic model comparison of tetracene when irradiated by itself () and when in the presence of phenanthrene ().
At 0.117 ppm, perylene degradation behaved similarly to that of pyrene. Observed photodegradation amounts of 36 ± 3%, 59 ± 5%, and 85.6 ± 0.5% for 1, 3, and 6 hour
y = -5.9993x - 0.0994 R² = 0.9981
-7 -6 -5 -4 -3 -2 -1 0
0 0.2 0.4 0.6 0.8 1 1.2
N a tu ra l Lo g ( T e tr a ce n e ) Time (h) t1/2 0.151 ± .003 h
-7 -6 -5 -4 -3 -2 -1 0
0 0.2 0.4 0.6 0.8 1 1.2
34
irradiations, respectively, fit a first order kinetic model. The t1/2 of perylene was calculated as
2.8 ± 0.8 h (Figure 2.12). When irradiated in the presence of phenanthrene, perylene loss of 31 ± 3%, 63 ± 3%, and 90 ± 1% was observed for time intervals of 1, 3, and 6 h respectively.
Perylene photodegradation exhibited a similar t1/2 when irradiated in the presence of
phenanthrene, with a calculated t1/2 of 2.49 ± 0.04 h (Figure 2.13). Figure 2.14 shows a
comparison of perylene degradation by itself and when in the presence of phenanthrene.
Figure 2.12. First order kinetic model for degradation of perylene. Half-life calculated as 0.693/k. Corrected t1/2 calculated using solar simulator factor of (t1/2 x 1.3).
y = -0.3182x - 0.0633 R² = 0.9924
-2.5 -2 -1.5 -1 -0.5 0
0 1 2 3 4 5 6 7
N
a
tu
ra
l
Lo
g
(
P
e
ry
le
n
e
)
35
Figure 2.13. First order kinetic model for degradation of perylene in the presence of
(phenanthrene). Half-life calculated as 0.693/k. Corrected t1/2 calculated using solar simulator
factor of (t1/2 x 1.3).
Figure 2.14. First order kinetic model comparison of perylene when irradiated by itself () and when in the presence of phenanthrene ().
y = -0.3617x + 0.0119 R² = 0.9981
-2.5 -2 -1.5 -1 -0.5 0
0 1 2 3 4 5 6 7
N a tu ra l Lo g ( P e ry le n e w it h P h ) Time (h) t1/2 2.49 ± 0.04 h
-2.5 -2 -1.5 -1 -0.5 0
0 1 2 3 4 5 6 7
36
After a twelve hour irradiation, chrysene samples showed a loss of only 25 ± 1%. Six and nine hour irradiated samples showed losses of 14 ± 4% and 19 ± 3% respectively. An accurate kinetic model could not be determined because two consecutive half-lives were not observed; however, results were in agreement with a first order model, leading to an estimated t1/2 of 34 ± 3 h (Figure 2.15). Two consecutive half-lives were not observed for chrysene when
irradiated in the presence of phenanthrene, as with chrysene when irradiated by itself. Loss of chrysene was calculated at 2 ± 1%, 13 ± 6%, and 21 ± 3% for irradiation times of 6, 9, and 12 h respectively. Chrysene irradiated in the presence of phenanthrene showed behavior consistent with a first order kinetic model, with an estimated t1/2 of 36 ± 4 h (Figure 2.16). This value was
not statistically different from the value for chrysene irradiated alone. Figure 2.17 shows a degradation comparison of chrysene by itself and when in the presence of phenanthrene. Table 2.2 shows zero, first, or second order rate constants (k) for all individual and binary mixtures of PAHs.
Figure 2.15. First order kinetic model for degradation of chrysene. Half-life calculated as 0.693/k. Corrected t1/2 calculated using solar simulator factor of (t1/2 x 1.3). *Two consecutive
half-lives not observed.
y = -0.0263x + 0.0011 R² = 0.9406
-0.35 -0.3 -0.25 -0.2 -0.15 -0.1 -0.05 0
0 2 4 6 8 10 12 14
N a tu ra l Lo g ( C h ry se n e ) Time (h) *t
37
Figure 2.16. First order kinetic model for degradation of chrysene in the presence of
(phenanthrene). Half-life calculated as 0.693/k. Corrected t1/2 calculated using solar simulator
factor of (t1/2 x 1.3). *Two consecutive half-lives not observed.
Figure 2.17. First order kinetic model comparison of chrysene when irradiated by itself () and when in the presence of phenanthrene ().
y = -0.0253x + 0.0088 R² = 0.9306
-0.4 -0.35 -0.3 -0.25 -0.2 -0.15 -0.1 -0.05 0
0 2 4 6 8 10 12 14
N a tu ra l Lo g ( C h ry se n e w it h P h ) Time (h) *t
1/2 36 ± 4 h
-0.35 -0.3 -0.25 -0.2 -0.15 -0.1 -0.05 0
0 2 4 6 8 10 12 14
LN
38
Table 2.2. Individual and binary mixtures of PAHs with corresponding rate constants.
PAH Additive Kinetic Model K
Phenanthrene Zero Order 1.4x10⁻⁹ ± 5.2x10⁻¹¹ M•h-1
Pyrene
none First Order 0.145 ± 0.006 h-1 Phenanthrene, 249 ppm First Order 0.087 ± 0.004 h-1 Anthracene, 9.7 ppm First Order 0.121 ± 0.008 h-1
Perylene none First Order 0.318 ± 0.009 h
-1
Phenanthrene, 249 ppm First Order 0.362 ± 0.006 h-1
Tetracene none First Order 5.9 ± 0.1 h
-1
Phenanthrene, 249 ppm First Order 4.1 ± 0.2 h-1
Chrysene none First Order 0.026 ± 0.002 h
-1
Phenanthrene, 249 ppm First Order 0.025 ± 0.003 h-1
Anthracene
none Second Order 16000 ± 1000M-1•h-1 Phenanthrene, 249 ppm Zero Order 8.7x10⁻⁶ ± 3.9x10⁻⁷ M•h-1 Pyrene, 15 ppm First Order 0.281 ± 0.007 h-1
For anthracene, pyrene, tetracene, and chrysene, there was a clearly observable impact on photodegradation kinetics when another PAH was added. In all cases, except two,
photodegradation was inhibited, lengthening the t1/2 of the observed PAH. This finding suggests
that PAHs can have both positive and negative influences on the photodegradation of other PAHs commonly found in oil. One explanation is that certain PAHs are good singlet oxygen sensitizers while others are good singlet oxygen scavengers. Singlet oxygen is a vital component in the photodegradation of oil. When irradiated, phenanthrene produces singlet oxygen by energy transfer. Reaction of the singlet oxygen with phenanthrene results in the formation of 9,10-phenanthreneqinone or 2,2’-biformylbiphenyl (Barbas et al., 1996). According to a previous report, chrysene also sensitizes singlet oxygen formation (Kong and Ferry, 2003). A binary mixture of phenanthrene and chrysene in tetradecane showed no increase in the
degradation rate of chrysene compared to pure chrysene in tetradecane. Perylene is not known as an efficient generator of singlet oxygen, but it does react with singlet oxygen to form a
39
minimal increase in photodegradation, with a corresponding decrease in perylene t1/2 compared
to exposures in the absence of phenanthrene.
Another consideration in determining PAH photodegradation was the structure of the PAH. Tetracene was determined to have the fastest degradation of all observed PAHs. While observing photochemical behavior of colloidal tetracene particles in water, Kim et al suggested that the rate of degradation was controlled by the availability of active sites as seen in a
Langmuir-Hinshelwood mechanism. (Kim et al., 2003) The linear-arranged ring structure with multiple reactive carbon sites may have aided in the photodegradation of tetracene. Pyrene, with a non-linear, compact ring structure, showed a degradation rate slower than that of tetracene. In aqueous systems, pyrene was not observed to react with singlet oxygen (Sigman et al., 1998); however, perylene, with a similar structure, does react with singlet oxygen and consequently, had a much faster photodegradation rate than pyrene. The staggered-structure ring system of
perylene exhibited degradation that was enhanced when combined with phenanthrene, while the linear-arranged PAH ring structure of anthracene not only degraded more quickly when
combined with phenanthrene, but also changed kinetic behavior. No clear correlation between structure and photodegradation, therefore, could be drawn from these observations.
40
Conclusion
The use of tetradecane as a simulated oil environment allowed for a greater understanding of the photodegradation kinetics of individual and combinations of selected polycyclic hydrocarbons found in oil like that from the Deepwater Horizon spill. Changes in observed kinetics for some PAH mixtures indicate that the formation of dimers or aggregates as well as photosensitization reaction are important in the photochemical fate of PAHs in oil. The information found in this study can also aid in understanding singlet oxygen and hydroxyl radical production from similar binary PAH mixtures, which will serve to further understand the fate of oil and the
41
Chapter 3 Future Work
Steady-state concentration of singlet oxygen produced from photochemical reactions by single PAHs and binary mixtures of PAHs in an n-alkane hydrocarbon matrix is an area that needs to be studied. Zepp et al found that singlet oxygen can produce oxidative transformations of organic pollutants. (Zepp et al., 1977) Preliminary results indicate that pyrene and anthracene show very similar steady-state concentrations of singlet oxygen, when calculated using loss of furfuryl alcohol as a probe. Steady-state concentrations of phenanthrene and chrysene were calculated at 2.04 x10⁻¹¹ M and 1.30 x10⁻¹¹M respectively. Perylene, tetracene, and binary PAH mixtures will be utilized in future singlet oxygen studies.
Production of hydroxyl radical from sunlight-exposed petroleum films has recently been studied by Ray and Tarr. (Ray and Tarr, 2014) Their findings suggest that solar irradiated petroleum films are a very large source of hydroxyl radical, which will play a major role in the degradation of oil compounds and oxidation of other material present such as dissolved organic matter and microorganisms. Future studies of hydroxyl radical production from solar irradiated films such as the ones described in this thesis will aid in understanding the role of single and binary PAHs in the fate of oil.
42
much, future studies containing single and binary mixtures of alkyl PAHs in an n-alkane hydrocarbon matrix will greatly aid in understanding the aromatic fraction of oil during a spill.
Water-soluble organics from irradiated Macondo well petroleum layers were extracted and characterized by ultrahigh resolution Fourier transform ion cyclotron resonance mass spectrometry (FT-ICR MS). An increased abundance of higher-order oxygen classes in irradiated samples indicated that photooxidized components of the Macondo crude oil become water soluble after irradiation. (Ray et al., 2014) Future studies incorporating similar methods with an AB Sciex 3200 Q-Trap mass spectrometer will be conducted on single and binary mixtures of PAHs in an n-alkane hydrocarbon matrix. Through this study, we will be able to characterize water-soluble photoproducts formed solely from irradiated PAHs.
The use of tetradecane as a simulated oil environment was quite useful when looking at single and binary mixtures of PAHs; however, a more realistic oil matrix is needed to accurately mimic the fate of oil during a spill. Factors such as wave motion, emulsion formation, and microbial interactions must be incorporated to fully understand the complete process of an oil spill from start to finish. In addition, the study described in this thesis needs to be conducted on Gulf water to acknowledge the impact, if any, of salt content.
Lastly, the results of the study described in this thesis indicate that the formation of dimers or aggregates are likely and should be investigated to determine effects of energy
43
44
References
1. Aeppli, C., Carmichael, C.A., Nelson, R.K., Lemkau, K.L., Graham, W.M., Redmond, M.C., Valentine, D.L., Reddy, C.M., 2012. Oil Weathering after the Deepwater Horizon Disaster Led to the Formation of Oxygenated Residues. Environmental Science & Technology 46, 8799-8807. 2. Ahsan, A., Karlsen, D.A., Patience, R.L., 1997. Petroleum biodegradation in the Tertiary reservoirs of the North Sea. Mar. Pet. Geol. 14, 55-64.
3. API, 2014. Transporting Oil and Natural Gas. American Petroleum Institute, http://www.api.org/oil-and-natural-gas-overview/transporting-oil-and-natural-gas
4. Aske, N., Kallevik, H., Sjöblom, J., 2001. Determination of Saturate, Aromatic, Resin, and Asphaltenic (SARA) Components in Crude Oils by Means of Infrared and Near-Infrared Spectroscopy. Energy & Fuels 15, 1304-1312.
5. Atlas, R., Murray, K., Cook, L., Boehm, P., 2012. Fate of Deepwater Horizon oil:
Biodegradation of aromatic and saturated hydrocarbons associated with oil in the water column. American Chemical Society, pp. GEOC-134.
6. Barbas, J.T., Sigman, M.E., Dabestani, R., 1996. Photochemical Oxidation of Phenanthrene Sorbed on Silica Gel. Environ. Sci. Technol. 30, 1776-1780.
7. Bobinger, S., Andersson, J.T., 2009. Photooxidation products of polycyclic aromatic compounds containing sulfur. Environ Sci Technol 43, 8119-8125.
8. Boehm, P.D., Cook, L.L., Murray, K.J., Brown, J., Royer, L., 2012. Distribution and fate of PAH and chemical dispersant concentrations in the water column following the Deepwater Horizon accident. American Chemical Society, pp. GEOC-135.
45
10. Brooijmans, R.J.W., Pastink, M.I., Slezen, R.J., 2009. Hydrocarbon-degrading bacteria: the oil-spill clean-up crew. Microb. Biotechnol. 2, 587-594.
11. Bue, B.G., Sharr, S., Moffitt, S.D., Craig, A.K., 1996. Effects of the Exxon Valdez oil spill on pink salmon embryos and preemergent fry. Am. Fish. Soc. Symp. 18, 619-627.
12. Burtis, C., Bruns, D., 2007. Tietz Fundamentals of Clinical Chemistry. Tietz Fundamentals of Clinical Chemistry. Saunders, 70-82.
13. Caldwell, M.E., Garrett, R.M., Prince, R.C., Suflita, J.M., 1998. Anaerobic Biodegradation of Long-Chain n-Alkanes under Sulfate-Reducing Conditions. Environmental Science &
Technology 32, 2191-2195.
14. Cheney, M.A., Birdsall, K., Kukor, J.J., 2001. Uptake and diverse effects of polycyclic aromatic hydrocarbons on the metabolic activity of Elliptio complanata measured by calorespirometry. Environ Toxicol Chem 20, 1031-1036.
15. Clark, J., 2007. High Performance Liquid Chromatography-HPLC, http://www.chemguide.co.uk/analysis/chromatography/hplc.html.
16. Commission, A.O.S., 1990. SPILL: The wreck of the Exxon Valdez. Exxon Valdez Oil Spill Trustee Council, Alaska, http://www.evostc.state.ak.us/index.cfm?FA=facts.details
17. D'Auria, M., Emanuele, L., Racioppi, R., Velluzzi, V., 2008. Synchronous fluorescence spectroscopy and gas chromatography to determine the effect of UV irradiation on crude oil. J. Photochem. Photobiol., A 198, 156-161.
18. Deffeyes, K.S., 2001. Hubbert's Peak: The Impending World Oil Shortage. Princeton University Press, 2003, 1-14.
46
20. Engineers, S.o.P., 2014. Stability of Oil Emulsions, http://petrowiki.org/Stability_of_oil_emulsions.
21. Fallahtafti, S., Rantanen, T., Brown, R.S., Snieckus, V., Hodson, P.V., 2012. Toxicity of hydroxylated alkyl-phenanthrenes to the early life stages of Japanese medaka (Oryzias latipes). Aquat. Toxicol. 106-107, 56-64.
22. Fan, T., Wang, J., Buckley, J.S., Evaluating Crude Oils by SARA Analysis. Society of Petroleum Engineers, 978-1-55563-951-8, 10.2118/75228-MS.
23. Fasnacht, M.P., Blough, N.V., 2002. Aqueous Photodegradation of Polycyclic Aromatic Hydrocarbons. Environ. Sci. Technol. 36, 4364-4369.
24. Fasnacht, M.P., Blough, N.V., 2003a. Kinetic analysis of the photodegradation of polycyclic aromatic hydrocarbons in aqueous solution. Aquat. Sci. 65, 352-358.
25. Fasnacht, M.P., Blough, N.V., 2003b. Mechanisms of the aqueous photodegradation of polycyclic aromatic hydrocarbons. Environ Sci Technol 37, 5767-5772.
26. Fathalla, E.M., Andersson, J.T., 2011. Products of polycyclic aromatic sulfur heterocycles in oil spill photodegradation. Environ. Toxicol. Chem. 30, 2004-2012.
27. Fitzgerald, T.P., Gohlke, J.M., 2014. Contaminant Levels in Gulf of Mexico Reef Fish after the Deepwater Horizon Oil Spill As Measured by a Fishermen-Led Testing Program.
Environmental Science & Technology 48, 1993-2000.
28. Francis, M., 2013. Oil Spill Solutions. Oil Spill Solutions Ltda, http://www.oilspillsolutions.org/evaluation.htm.
29. Fu, J., Klein, G.C., Smith, D.F., Kim, S., Rodgers, R.P., Hendrickson, C.L., Marshall, A.G., 2006. Comprehensive Compositional Analysis of Hydrotreated and Untreated
47
and Electrospray Ionization Ultrahigh-Resolution FT-ICR Mass Spectrometry. Energy & Fuels 20, 1235-1241.
30. Fuhr, B., Scott, K., Dettman, H., Salmon, S., 2005. Fractionation of bitumen by distillation, Sara analysis and gel permeation chromatography. American Chemical Society, pp. PETR-131. 31. Gilman, J., Jimenez, J.-L., 2004. Lecture Chromo-3 Gas Chromatography. CU-Boulder, http://www.colorado.edu/chemistry/chem5181/Lectures/C3_GC.pdf.
32. GoMRI, 2013. Gulf of Mexico research Initiative: Investigating the effect of oil spills on the environment and public health, http://gulfresearchinitiative.org/.
33. Guillet, J., Gu, L., 1998. Studies of the antenna effect in polymer molecules energy migration and trapping in naphthalene-containing polyelectrolytes. Chin. J. Polym. Sci. 16, 261-267. 33. Gutierrez, T., Berry, D., Yang, T., Mishamandani, S., McKay, L., Teske, A., Aitken, M.D., 2013. Role of bacterial exopolysaccharides (EPS) in the fate of the oil released during the deepwater horizon oil spill. PLoS One 8, e67717.
34. Hall, R.J., Belisle, A.A., Sileo, L., 1983. Residues of petroleum hydrocarbons in tissues of sea turtles exposed to the Ixtoc I oil spill. J Wildl Dis 19, 106-109.
35. Harris, D.C., 2003. Fundamentals of Spectrophotometry; Mass Spectrometry; Introduction to Analytical Separations. Quantitative Chemical Analysis, 528-588.
48
38. Jacquot, F., Guiliano, M., Doumenq, P., Munoz, D., Mille, G., 1996. In vitro photooxidation of crude oil maltenic fractions: evolution of fossil biomarkers and polycyclic aromatic
hydrocarbons. Chemosphere 33, 671-681.
39. Kalke, R.D., Duke, T.A., Flint, R.W., 1982. Weathered IXTOC I oil effects on estuarine benthos. Estuarine, Coastal Shelf Sci. 15, 75-84.
40. Kelso, D., Kendziorek, M., 1991. Alaska's response to the Exxon Valdezoil spill. Environmental Science & Technology 25, 16-23.
41. Kelso, M., 2014. Over 1.1 Million Active Oil and Gas Wells in the US. Fracktracker, http://www.fractracker.org/2014/03/1-million-wells/.
42. Kemsley, J., 2013. After Disaster. Chemical & Engineering News Archive 91, 12-17. 43. Kim, H.Y., Bjorklund, T.G., Lim, S.H., Bardeen, C.J., 2003. Spectroscopic and
Photocatalytic Properties of Organic Tetracene Nanoparticles in Aqueous Solution. Langmuir 19, 3941-3946.
44. King, S.M., Leaf, P.A., Olson, A.C., Ray, P.Z., Tarr, M.A., 2014. Photolytic and
photocatalytic degradation of surface oil from the Deepwater Horizon spill. Chemosphere 95, 415-422.
45. King, S.M., Leaf, P.A., Tarr, M.A., 2011. Photochemistry of Deepwater Horizon Oil. ACS Symp. Ser. 1086, 81-95, 83 plates.
46. Kong, L., Ferry, J.L., 2003. Effect of salinity on the photolysis of chrysene adsorbed to a smectite clay. Environ Sci Technol 37, 4894-4900.
49
48. Law, R.D., 1955. Hydrogenating Wyoming black oils. Pet. Refin. 34, 219-220. 49. Lerda, D., 2010. Polycyclic Aromatic Hydrocarbons (PAHs) Factsheet 3rd Edition,
http://irmm.jrc.ec.europa.eu/EURLs/EURL_PAHs/about_pahs/Documents/JRC%2060146_Facts heet%20PAH_3rd%20edition.pdf.
50. Mahmoudi, N., Porter, T.M., Zimmerman, A.R., Fulthorpe, R.R., Kasozi, G.N., Silliman, B.R., Slater, G.F., 2013. Rapid Degradation of Deepwater Horizon Spilled Oil by Indigenous Microbial Communities in Louisiana Saltmarsh Sediments. Environ. Sci. Technol. 47, 13303-13312.
51. Maki, H., Sasaki, T., Harayama, S., 2001. Photo-oxidation of biodegraded crude oil and toxicity of the photo-oxidized products. Chemosphere 44, 1145-1151.
52. Martin, J.D., Adams, J., Hollebone, B., King, T., Brown, R.S., Hodson, P.V., 2014. Chronic toxicity of heavy fuel oils to fish embryos using multiple exposure scenarios. Environ. Toxicol. Chem. 33, 677-687.
53. McIntosh, S., King, T., Wu, D., Hodson, P.V., 2012. Toxicity of dispersed weathered crude oil to early life stages of Atlantic herring (Clupea harengus) [Erratum to document cited in CA153:224000]. Environ. Toxicol. Chem. 31, 929.
54. McKenna, A.M., Nelson, R.K., Reddy, C.M., Savory, J.J., Kaiser, N.K., Fitzsimmons, J.E., Marshall, A.G., Rodgers, R.P., 2013. Expansion of the Analytical Window for Oil Spill
Characterization by Ultrahigh Resolution Mass Spectrometry: Beyond Gas Chromatography. Environ. Sci. Technol. 47, 7530-7539.
50
56. Menzie, C.A., Potocki, B.B., Santodonato, J., 1992. Exposure to carcinogenic PAHs in the environment. Environmental Science & Technology 26, 1278-1284.
57. Nagpal, N.K., 1993. PAHs and Their Characteristics,
http://www.env.gov.bc.ca/wat/wq/BCguidelines/pahs/pahs-01.htm.
58. NWF, 2014. Oil Spill Impacts on Birds https://www.nwf.org/What-We-Do/Protect-Habitat/Gulf-Restoration/Oil-Spill/Effects-on-Wildlife/Birds.aspx.
59. Oliva, M., González de Canales, M.L., Gravato, C., Guilhermino, L., Perales, J.A., 2010. Biochemical effects and polycyclic aromatic hydrocarbons (PAHs) in senegal sole (Solea senegalensis) from a Huelva estuary (SW Spain). Ecotoxicology and Environmental Safety 73, 1842-1851.
60. Paul, J.H., Hollander, D., Coble, P., Daly, K.L., Murasko, S., English, D., Basso, J., Delaney, J., McDaniel, L., Kovach, C.W., 2013. Toxicity and Mutagenicity of Gulf of Mexico Waters During and After the Deepwater Horizon Oil Spill. Environmental Science & Technology 47, 9651-9659.
61. Plovdiv, U.o., 2012. UV-Vis Spectroscopy, http://web.uni-plovdiv.bg/plamenpenchev/mag/books/spectroscopy/PRIMER.PDF.
62. Pritchard, P.H., Mueller, J.G., Rogers, J.C., Kremer, F.V., Glaser, J.A., 1992. Oil spill bioremediation: experiences, lessons and results from the Exxon Valdez oil spill in Alaska. Biodegradation 3, 315-335.
51
64. Rabalais, S.C., Arnold, C.R., Wohlschlag, N.S., 1981. The effects of Ixtoc I oil on the eggs and larvae of red drum (Sciaenops ocellata). Tex. J. Sci. 33, 33-38.
65. Ray, P.Z., Tarr, M.A., Solar Production of Singlet Oxygen from Crude Oil Films on Water. Journal of Photochemistry and Photobiology A: Chemistry.
66. Ray, P.Z., Tarr, M.A., 2014. Petroleum films exposed to sunlight produce hydroxyl radical. Chemosphere.
67. Ray, P.Z., Tarr, M.A., Chen, H., Podgorski, D.C., McKenna, A.M., 2014. Sunlight Creates Oxygenated Species in Water-Soluble Fractions of Deepwater Horizon Oil. Journal of Hazardous Materials Submitted.
68. Rinawati, Koike, T., Koike, H., Kurumisawa, R., Ito, M., Sakurai, S., Togo, A., Saha, M., Arifin, Z., Takada, H., 2012. Distribution, source identification, and historical trends of organic micropollutants in coastal sediment in Jakarta Bay, Indonesia. J. Hazard. Mater. 217-218, 208-216.
69. Rodger, A., 2013. Fluorescence Spectroscopy,
http://www2.warwick.ac.uk/services/rss/business/analyticalguide/fluorescence/.
70. Rojo, F., 2009. Degradation of alkanes by bacteria. Environ Microbiol 11, 2477-2490. 71. Sabate, J., Bayona, J.M., Solanas, A.M., 2001. Photolysis of PAHs in aqueous phase by UV irradiation. Chemosphere 44, 119-124.
52
73. Schrope, M., 2010. The lost legacy of the last great oil spill. Nature (London, U. K.) 466, 304-305.
74. Schwacke, L.H., Smith, C.R., Townsend, F.I., Wells, R.S., Hart, L.B., Balmer, B.C., Collier, T.K., De Guise, S., Fry, M.M., Guillette, L.J., Lamb, S.V., Lane, S.M., McFee, W.E., Place, N.J., Tumlin, M.C., Ylitalo, G.M., Zolman, E.S., Rowles, T.K., 2013. Health of Common Bottlenose Dolphins (Tursiops truncatus) in Barataria Bay, Louisiana, Following the Deepwater Horizon Oil Spill. Environmental Science & Technology 48, 93-103.
75. Sellin Jeffries, M.K., Claytor, C., Stubblefield, W., Pearson, W.H., Oris, J.T., 2013.
Quantitative Risk Model for Polycyclic Aromatic Hydrocarbon Photoinduced Toxicity in Pacific Herring Following the Exxon Valdez Oil Spill. Environ. Sci. Technol. 47, 5450-5458.
76. Sigman, M.E., Schuler, P.F., Ghosh, M.M., Dabestani, R.T., 1998. Mechanism of Pyrene Photochemical Oxidation in Aqueous and Surfactant Solutions. Environ. Sci. Technol. 32, 3980-3985.
77. Skoog, D., Holler, F., Crouch, S., 2007. An Introduction to Ultraviolet-Visible Molecular Absorption Spctrometry. Principles of Instrumental Analysis, pp. 335-550.
78. Sundberg, H., Ishaq, R., Tjaernlund, U., Aakerman, G., Grunder, K., Bandh, C., Broman, D., Balk, L., 2006. Contribution of commonly analyzed polycyclic aromatic hydrocarbons (PAHs) to potential toxicity in early life stages of rainbow trout (Oncorhynchus mykiss). Can. J. Fish. Aquat. Sci. 63, 1320-1333.
79. Thet, K., Woo, N., 2013. Chemwiki Gas Chromatography UC-Davis,
53
80. Thominette, F., Verdu, J., 1984. Photooxidative behavior of crude oils relative to sea pollution. Part II. Photo-induced phase separation. Mar. Chem. 15, 105-115.
81. Townsend, G.T., Prince, R.C., Suflita, J.M., 2003. Anaerobic Oxidation of Crude Oil Hydrocarbons by the Resident Microorganisms of a Contaminated Anoxic Aquifer. Environmental Science & Technology 37, 5213-5218.
82. Unlu, S., Alpar, B., Ozturk, K., Vardar, D., 2010. Polycyclic Aromatic Hydrocarbons (PAHs) in the Surficial Sediments from Lake Iznik (Turkey): Spatial Distributions and Sources. Bull. Environ. Contam. Toxicol. 85, 573-580.
83. Wise, J.P., Wise, J.T.F., Wise, C.F., Wise, S.S., Gianios, C., Xie, H., Thompson, W.D., Perkins, C., Falank, C., Wise, J.P., 2014. Concentrations of the Genotoxic Metals, Chromium and Nickel, in Whales, Tar Balls, Oil Slicks, and Released Oil from the Gulf of Mexico in the Immediate Aftermath of the Deepwater Horizon Oil Crisis: Is Genotoxic Metal Exposure Part of the Deepwater Horizon Legacy? Environmental Science & Technology 48, 2997-3006.
84. Woo, O.T., Chung, W.K., Wong, K.H., Chow, A.T., Wong, P.K., 2009. Photocatalytic oxidation of polycyclic aromatic hydrocarbons: intermediates identification and toxicity testing. J Hazard Mater 168, 1192-1199.
85. World Health Organization, E., 2000. Chapter 5.9 Polycyclic Aromatic Hydrocarbons (PAHs). Air Quality Guidelines,
http://www.euro.who.int/__data/assets/pdf_file/0015/123063/AQG2ndEd_5_9PAH.pdf . 86. Xia, K., Hagood, G., Childers, C., Atkins, J., Rogers, B., Ware, L., Armbrust, K., Jewell, J., Diaz, D., Gatian, N., Folmer, H., 2012. Polycyclic Aromatic Hydrocarbons (PAHs) in
54
87. Xie, G., Barcelona, M.J., 2003. Sequential Chemical Oxidation and Aerobic Biodegradation of Equivalent Carbon Number-Based Hydrocarbon Fractions in Jet Fuel. Environmental Science & Technology 37, 4751-4760.
88. Yemashova, N.A., Murygina, V.P., Zhukov, D.V., Zakharyantz, A.A., Gladchenko, M.A., Appanna, V., Kalyuzhnyi, S.V., 2007. Biodeterioration of crude oil and oil derived products: a review. Rev. Environ. Sci. Bio/Technol. 6, 315-337.
89. Yunker, M.B., Perreault, A., Lowe, C.J., 2012. Source apportionment of elevated PAH concentrations in sediments near deep marine outfalls in Esquimalt and Victoria, BC, Canada: Is coal from an 1891 shipwreck the source? Org. Geochem. 46, 12-37.
55
Vita
Dustin Kountz was born on the 3rd of July, 1976, in Salina, Kansas, to Jerry and Tanya Kountz. He was raised in Bonham, Texas, and attended Bonham High School, where he graduated valedictorian. Upon graduation, he received an academic and music scholarship to Louisiana Tech University. Dustin received his BA in Sociology in 1998 and began working at the Isle of Capri Casino in Bossier City, Louisiana, as head of guest services. It only took a few months for Dustin to realize that his true passion was in teaching and coaching, much like his mother and father who both taught for over 25 years. After receiving his teaching certificate from Southeastern Oklahoma State University in 2000, Dustin began a rewarding career in education that lasted for 13 years. During this time, Dustin became certified in secondary English, Social Studies, Speech, Communications, and Science. He also coached basketball, football, softball, baseball, volleyball, and track.