R E S E A R C H A R T I C L E
Open Access
Charged residues next to transmembrane
regions revisited:
“
Positive-inside rule
”
is
complemented by the
“
negative inside
depletion/outside enrichment rule
”
James Alexander Baker
1,2, Wing-Cheong Wong
1, Birgit Eisenhaber
1, Jim Warwicker
2*and Frank Eisenhaber
1,3*Abstract
Background:Transmembrane helices (TMHs) frequently occur amongst protein architectures as means for proteins to attach to or embed into biological membranes. Physical constraints such as the membrane’s hydrophobicity and electrostatic potential apply uniform requirements to TMHs and their flanking regions; consequently, they are mirrored in their sequence patterns (in addition to TMHs being a span of generally hydrophobic residues) on top of variations enforced by the specific protein’s biological functions.
Results:With statistics derived from a large body of protein sequences, we demonstrate that, in addition to the positive charge preference at the cytoplasmic inside (positive-inside rule), negatively charged residues preferentially occur or are even enriched at the non-cytoplasmic flank or, at least, they are suppressed at the cytoplasmic flank (negative-not-inside/negative-outside (NNI/NO) rule). As negative residues are generally rare within or near TMHs, the statistical significance is sensitive with regard to details of TMH alignment and residue frequency normalisation and also to dataset size; therefore, this trend was obscured in previous work. We observe variations amongst taxa as well as for organelles along the secretory pathway. The effect is most pronounced for TMHs from single-pass transmembrane (bitopic) proteins compared to those with multiple TMHs (polytopic proteins) and especially for the class of simple TMHs that evolved for the sole role as membrane anchors.
Conclusions:The charged-residue flank bias is only one of the TMH sequence features with a role in the anchorage mechanisms, others apparently being the leucine intra-helix propensity skew towards the cytoplasmic side, tryptophan flanking as well as the cysteine and tyrosine inside preference. These observations will stimulate new prediction methods for TMHs and protein topology from a sequence as well as new engineering designs for artificial membrane proteins.
Keywords:Amino acid distribution, Genome-wide statistical study, Membrane protein, Negative-not-inside/ negative-outside rule, Protein topology prediction, Proteomics, Transmembrane helix, Transmembrane region prediction
* Correspondence:j.warwicker@manchester.ac.uk;franke@bii.a-star.edu.sg 2
School of Chemistry, Manchester Institute of Biotechnology, 131 Princess Street, Manchester M1 7DN, UK
1Bioinformatics Institute, Agency for Science Technology and Research (A*STAR), 30 Biopolis Street #07-01, Matrix, Singapore 138671, Singapore Full list of author information is available at the end of the article
Background
Two decades ago, the classic concept of a transmem-brane helical region was a rather simple story: Typical transmembrane proteins were thought to be anchored in the membrane by membrane-spanning bundles of non-polar α-helices of roughly 20 residues in length, with a consistent orientation of being perpendicular to the mem-brane surface. Although this is broadly true, hundreds of high-quality membrane structures have elucidated that membrane-embedded helices can adopt a plethora of lengths and orientations within the membrane. They are capable of just partially spanning the membrane, spanning using oblique angles, and even lying flat on the membrane surface [1, 2]. The insertion and formation of the trans-membrane helices (TMHs) follow a complex thermo-dynamic equilibrium [3]. From the biological function point of view, many TMHs have multiple roles besides being just hydrophobic anchors; for example, certain TMHs have been identified as regulators of protein quality control and trafficking mechanisms [4]. As these additional bio-logical functions are mirrored in the TMHs’sequence pat-terns, TMHs can be classified as simple (just hydrophobic anchors) and complex sequence segments [5–7].
The relationship between sequence patterns in and in the vicinity of TMHs and their structural and functional properties, as well as their interaction with the lipid bilayer membrane, has been a field of intensive research in the last three decades [8]. Besides the span of gener-ally hydrophobic residues in the TMH, there are other trends in the sequence such as a saddle-like distribution of polar residues (depressed incidence of charged residues in the TMH itself ), an enriched occurrence of positively charged residues in the cytosolic flanking regions as well as an increased likelihood of tryptophan and tyrosine at ei-ther flank edge [9–14]. These properties vary somewhat in length and intensity between various biological organelle membranes, between prokaryotes and eukaryotes [15] and even amongst eukaryotic species studied due to slightly different membrane constraints [9, 16]. These biological dispositions are exploitable in terms of transmembrane region prediction in query protein sequences [17, 18], and tools such as the quite reliable TMHMM (software for predicting TMHs based on a hidden Markov model), Phobius or the dense alignment surface-transmembrane filter (DAS-TMfilter) represent today’s prediction limit of TMHs’ hydrophobic cores within the protein sequence [19–25]. The prediction accuracy for true positives and negatives is reported to be close to 100%, and the remaining main cause of false positive prediction is hydro-phobic α-helices completely buried in the hydrophobic core of proteins. Note that reliable prediction of TMHs and protein topology is a strong restriction for protein function of even otherwise non-characterised proteins [26–28] and thus provides very valuable information.
The“positive-inside rule”reported by von Heijne [2, 12] postulates the preferential occurrence of positively charged residues (lysine and arginine) at the cytoplasmic edge of TMHs. The practical value of positively charged residue sequence clustering in topology prediction of TMHs was first shown for the plasmalemma in bacteria [12, 29]. As a trend, the positive-inside rule has since been confirmed with statistical observations for most membrane proteins and biological membrane types [13, 30–32]. However, more recent evidence suggests that, in thylakoid mem-branes, the positive-inside rule is less applicable due to the co-occurrence of aspartic acid and glutamic acid residues together with positively charged residues [16].
The positive-inside rule also received support from protein engineering experiments that revealed conclusive evidence for positive charges as a topological determin-ant [12, 33–35]. Mutational experiments demonstrated that charged residues, when inserted into the centre of the helix, had a large effect on insertion capabilities of the TMH via the translocon. Insertion becomes more unfavourable when the charge is placed closer to the TMH core [36].
It remains unclear exactly why and how the positive charge determines topology from a biophysical perspective. Positively charged residues are suggested to be stronger de-terminants of topology than negatively charged residues due to a dampening of the translocation potential of nega-tively charged residues. This dampening factor is the result of protein-lipid interactions with the net-zero-charged phospholipid phosphatidylethanolamine and other neutral lipids. This effect favours cytoplasmic retention of positively charged residues [37].
The recent accumulation of transmembrane protein se-quences and structures allowed us to revisit the problem of charged residue distribution in TMHs (see also http://blan co.biomol.uci.edu/mpstruc/). For example, whilst β-sheets contain charged residues in the transmembrane region, α -helices generally do not [38]. Large-scale sequence analysis of TMHs from various organelle membrane surfaces in eukaryotic proteomes confirms the clustering of positive charge having a statistical bias for the cytosolic side of the membrane. At the same time, there are many TMH excep-tion examples to the positive-inside rule; however, as a trend, topology can be determined by simply looking for the most positive loop region between helices [9, 13].
negative residues are topologically active to a point. Negatively charged residues were observed in the flanks of TMHs [13], especially in those of marginally hydro-phobic transmembrane regions [41]. It is known that the negatively charged acidic residues in transmem-brane regions have a non-trivial role in the biological context. In E. coli, negative residues experience elec-trical pulling forces when travelling through the SecYEG translocon, indicating that negative charges are biologically relevant during the electrostatic interactions of insertion [42, 43].
Unfortunately, there is a problem with statistical evi-dence for preferential negative charge occurrence next to TMH regions. Early investigations indicated that over-all both positive and negative charge were influential topology factors; this idea was dubbed the charge bal-ance rule. If true, one would also expect to see a skew in the negative charge distribution if a cooperation between oppositely charged residues oriented a TMH [29, 44]. It might be expected that, if positive residues force the loop or tail to stay inside, negative residues would be drawn outside, and the topology would be determined, not unlike electrophoresis. Yet, there are plenty of indi-vidual protein examples but no conclusive statistical evi-dence in the current literature for a negatively charged skew [9, 13, 14, 16, 31, 45].
There are many observations described in the litera-ture that charged residues determine topology more pre-dictably in single-pass proteins than in multi-pass TMHs [40, 46]. It is thought that the charges only determine the initial orientation of the TMH in the biological membrane; yet, the ultimate orientation must be deter-mined together with the totality of subsequent down-stream regions [47].
With sequence-based hydrophobicity and volume ana-lysis and consensus sequence studies, Sharpe et al. [9] demonstrated that there is asymmetry in the intra-membranous space of some membranes. Crucially, this asymmetry differs amongst the membranes of various organelles. They conclude that there are general differ-ences between the lipid composition and organisation in membranes of the Golgi and endoplasmic reticulum (ER). Functional aspects are also important. For example, the abundance of serines in the region following the luminal end of Golgi TMHs appears to reflect the fact that this part of many Golgi enzymes forms a flexible linker that tethers the catalytic domain to the membrane [9].
A study by Baeza-Delgado et al. [13] analysed the dis-tribution of amino acid residue types in TMHs in 170 integral membrane proteins from a manually maintained database of experimentally confirmed TMPs (MPtopo [48]) as well as in 930 structures from the Protein Data Bank (PDB). As expected, half of the natural amino acids are equally distributed along TMHs, whereas
aromatic, polar and charged amino acids along with proline are biased near the flanks of the TMHs. Unsur-prisingly, leucine and other non-polar residues are far more abundant than the charged residues in the trans-membrane region [9].
In this work, we revisit the issue of statistical evidence for the preferential distribution of negatively charged (and a few other) residues within and nearby TMHs. We rely on the improved availability of comprehensive and large sequence and structure datasets for transmem-brane proteins. We also show that several methodo-logical aspects have hindered previous studies [9, 13, 16] from seeing the consistent non-trivial skew for nega-tively charged residues disfavouring the cytosolic inter-facial region and/or preferring the outside flank. First, we show that acidic residues are especially rare within and in the close sequence environment of TMHs, even when compared to positively charged lysine and argin-ine. Second, therefore, the manner of normalisation is critical: Taken together with the difficulty of properly aligning TMHs relative to their boundaries, column-wise frequency calculations relative to all amino acid types as in previous studies will blur possible preferential locali-sations of negative charges in the sequence. However, the outcome changes when we ask where a negative charge occurs in the sequence relative to the total amount of negative charges in the respective sequence region. Thus, by accounting for the rarity of acidic resi-dues with sensitive normalisation, the “non-negative inside rule/negative-outside rule”is clearly supported by the statistical data. We find that minor changes in the flank definitions, such as taking the TMH boundaries from the database or generating flanks by centrally aligning TMHs and applying some standardised TMH length, do not have a noticeable influence on the charge bias detected.
Third, there are significant differences in the distribu-tion of amino acid residues between single-pass and multi-pass transmembrane regions in both the intra-membrane helix and the flanking regions, with further variations introduced by taxa and by the organelles along the secretory pathway. Importantly, we find that it is critical to weigh down the effect of TMHs in multi-pass transmembrane proteins with no or super-short flanks to observe statistical significance for the charge bias. Bluntly stated, if there are no flanks of sufficient length, there is also no negative charge bias to be observed.
datasets and a sensitive normalisation approach, new sequence features are revealed that provide spatial insight into TMH membrane anchoring, recognition, helix-lipid, and helix-helix interactions.
Results
Acidic residues within and nearby TMH segments are rare
In order to reliably compare the amino acid sequence properties of TMHs, we assembled datasets of TMH pro-teins from what are likely to be the best in terms of quality and comprehensiveness of annotation in eukaryotic and prokaryotic representative genomes, as well as composite datasets to represent larger taxonomic groups and to consider subcellular locations (see Table 1). In total, 3292 single-pass TMH segments and 29,898 multi-pass TMH segments were extracted from various UniProt [49] text files according to TRANSMEM annotation (download dated 20-03-2016). The UniProt datasets used included only manually curated records; however, it is still neces-sary to check for systematic bias due to the prediction methods used by UniProt for TMH annotation in the majority of cases without direct experimental evidence. Therefore, a fully experimentally verified dataset was also generated for comparison. The representative 1544 single-pass and 15,563 TMHs were extracted from the manually curated experimentally verified TOPDB [50] database (download dated 21-03-2016) referred to as ExpAll here (Table1). TMH organelle residency is defined according to UniProt annotation. To ensure reliability, organelles were only analysed from a representative redundancy-reduced protein dataset of the most well-studied genome: Homo sapi-ens (referred to as UniHuman herein). The several datasets from UniProt are subdivided into different
human organelles (UniPM, UniER, UniGolgi) and taxonomical groups (UniHuman, UniCress, UniBacilli, UniEcoli, UniArch, UniFungi) as described in Table 1 (see also the Methods section). As will be shown below, these various datasets allow us to validate our findings for a variety of conditions, namely with regard (1) to experimental verification of TMHs, (2) to origin from various species and taxonomic groups, (3) to the number of TMHs in the same protein as well as (4) to subcellular localisation. Datasets and programs used in this work can be downloaded from http://mendel.-bii.a-star.edu.sg/SEQUENCES/NNI/.
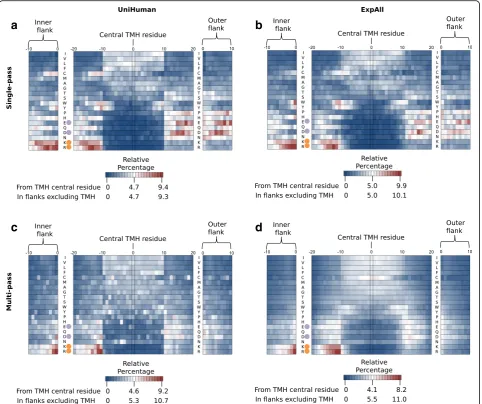
The hydrophobic nature of the lipid bilayer membrane implies that, generally, charged residues should be rare within TMHs. For acidic residues, even the location in the sequence vicinity of TMHs should be disfavoured because of the negatively charged head groups of lipids directed towards the aqueous extracellular side or the cytoplasm. In agreement with the biophysically justified expectations, the statistical data confirm that acidic resi-dues are especially rare in TMHs and their flanking regions. In Fig. 1, where we plot the total abundance of all amino acid types in single-pass TMHs and multi-pass TMHs (including their ±5 flanking residues), acidic resi-dues were found to be amongst the rarest amino acids both in UniHuman and ExpAll.
The effect is most pronounced in single-pass trans-membrane proteins (Fig. 1a). There are only 666 gluta-mates (just 1.24% of all residues) and 560 aspartates (1.05% respectively) amongst the total set of 53,238 residues comprising 1705 TMHs and their flanks. Within just the TMH regions, there are 71 glutamates (0.20% of all residues in TMHs and flanks) and 58 aspar-tates (0.16% respectively). This cannot be an artefact of
Table 1Acidic residues are rarer in TMHs of single-pass proteins than in TMHs of multi-pass proteins
Dataset Acidic residues (D and E) Aspartic acid (D only) Glutamic acid (E only)
μSP μMP HstatisticPvalue μSP μMP HstatisticPvalue μSP μMP HstatisticPvalue ExpAll 0.086 0.309 148.1 4.50E-34 0.045 0.157 40.3 2.13E-10 0.042 0.161 46.6 8.64E-12
UniHuman 0.076 0.398 316.5 8.31E-71 0.034 0.191 91.6 1.05E-21 0.042 0.207 100.3 1.33E-23
UniER 0.106 0.430 34.4 4.39E-9 0.061 0.161 8.0 4.72E-3 0.045 0.268 26.8 2.24E-7
UniGolgi 0.097 0.381 39.8 2.88E-10 0.043 0.180 19.4 1.05E-5 0.053 0.201 20.2 7.01E-6
UniPM 0.039 0.400 121.0 3.86E-28 0.016 0.187 32.7 1.06E-8 0.022 0.213 36.9 1.26E-9
UniCress 0.062 0.434 163.5 1.99E-37 0.036 0.198 32.5 1.20E-8 0.025 0.241 66.0 4.59E-16
UniFungi 0.177 0.349 43.1 5.14E-11 0.044 0.166 24.5 7.60E-7 0.133 0.183 4.6 0.033
UniBacilli 0.089 0.352 24.1 9.16E-7 0.048 0.185 11.2 8.27E-4 0.040 0.176 12.3 4.54E-5
UniEcoli 0.148 0.315 2.7 0.100 0.111 0.150 0.1 0.729 0.037 0.163 2.2 0.140
UniArch 0.438 0.606 1.8 0.183 0.083 0.344 11.2 8.33E-4 0.354 0.247 3.5 0.0624
UniProt TMH assignments since this feature is repeated in ExpAll. There are only 582 glutamates (1.22%) and 520 aspartates (1.09%) amongst the 47,568 residues in-volved. Within the TMH itself, there are 64 glutamates (0.19%) and 69 aspartates (0.21%). In both cases, the negatively charged residues represent the ultimate end of the distribution. Note that acidic residues are rare even compared to positively charged residues, which are about three to four times more frequent. On a much smaller dataset of single-spanning transmembrane proteins, Nakashima and Nishikawa [51] made similar compositional studies. To compare, they found 0.94% glutamate and 0.94% aspartate within just the TMH region (these values are very similar to ours from TMHs with small flanks; apparently, they used more outwardly defined TMH boundaries), but the content of each glutamate and as-partate within the extracellular or cytoplasmic domains is larger by an order of magnitude, between 5.26% and 9.34%. These latter values tend to be even higher than the average glutamate and aspartate composition throughout the protein database (5–6% [51]).
In the case of multi-pass transmembrane proteins (Fig. 1c and d), glutamates and aspartates are still very rare in TMHs and their ±5 residue flanks
(1.94% and 1.92% from the total of 377,207 in the case of UniHuman, 1.79% and 1.70% from the total of 454,700 in the case of ExpAll). Yet, their occur-rence is similar to those of histidine and tryptophan and, notably, acidic residues are only about ~1.5 times less frequent than positively charged residues. The observation that acidic residues are more sup-pressed in single-pass TMHs compared with multi-pass TMHs is statistically significant. In Table 1, the acidic residues are counted in the helices (excluding flanking regions) belonging to either multi-pass or single-pass helices. Indeed, single-pass helices appear to tolerate negative charge to a far lesser extent than multi-pass helices, as the data in the top two rows of Table 1 indicate (for datasets UniHuman and ExpAll). The trend is strictly observed throughout subcellular localisations (rows 3–5 in Table 1) and taxa (rows 6–10). Statistical significance (P≤0.001) is found in all but six cases. These are UniEcoli (D + E, D, E), UniArch (D + E, E) and UniFungi (E). The problem is, most likely, that the respective datasets are quite small. Notably, the difference between single- and multi-pass TMHs is greatest in UniPM; here, TMHs from multi-pass proteins have on average 0.400
a
b
d
c
negative residue per helix, whereas single-pass TMHs contained just 0.039 (P= 3.86e-28).
Amino acid residue distribution analysis reveals a
“negative-not-inside/negative-outside”signal in single-pass TMH segments
The rarity of negatively charged residues is a complicat-ing issue when one studies their distribution along the sequence positions of TMHs and their flanks. For UniHuman (Fig. 2a) and ExpAll (Fig. 2b), we plotted the absolute abundance of aspartic acid, glutamic acid, ly-sine, arginine and leucine at each position (i.e., it scales as the equivalent fraction in the total composition of the alignment column). Note that the known preference of positively charged residues towards the cytoplasmic side is nevertheless evident. Yet, it becomes apparent that any bias in the occurrence of the much rarer acidic residues is overshadowed by fluctuations in the highly abundant residues such as leucine.
The trends become clearer if the occurrence of specific residues is normalised with the total number of residues of the given amino acid type in the dataset observed in the sequence region studied as shown for UniHuman in Fig. 2c and for ExpAll in Fig. 2d. For comparison, we indicated background residue occurrences (dashed lines calculated as averages for positions–25 to–30 and 25 to 30). The respective average occurrences in the inside and outside flanks (calculated from an average of the values at positions–20 to–10 and 10 to 20 respectively) are shown with wide lines.
The“positive-inside rule”becomes even more evident in this normalisation: Whereas the occurrence of positively charged residues is about the background level at the out-side flank, it is about two to three times higher both for the UniHuman and the ExpAll datasets at the inside flank. Note that the background level was found to be 1.7% (lysine) and 1.6% (arginine) in UniHuman and 1.4% (lysine and arginine) in ExpAll. The inside flank average is 4.3% (lysine) and 4.6% (arginine) in UniHuman and 4.2% (lysine) and 4.6% (arginine) in ExpAll. The outside flank is similar to the background noise levels: about 1.4% (lysine) and 1.5% (arginine) in UniHuman and about 1.5% (lysine) and 1.4% (arginine) in ExpAll.
Most interestingly, a "negative-inside depletion" trend for the negatively charged residues is apparent from the distribution bias. The inside flank averages for glutamic acid were 1.1% and 1.4% in UniHuman and ExpAll re-spectively; for aspartic acid, 1.2% and 1.4% in UniHuman and ExpAll respectively. Meanwhile, the outside flanks for aspartic acid and glutamic acid occurrences were measured at 2.9% and 2.4% respectively in UniHuman, and in ExpAll, these values for aspartic acid and glu-tamic acid were found to be 2.5% and 2.1% respectively. Against the background level of aspartic acid (2.8% and
2.9% in UniHuman) and glutamic acid (2.6% and 2.9% in ExpAll), the inside flank averages were found to be about 2 to 3 times lower than the background level whilst the outside flank averages were comparable to the back-ground level (Fig. 2c and d). Taken together, this indi-cates a clear suppression of negatively charged residues at the inside flank of single-pass TMHs and a possible trend for negatively charged residues occurring preferen-tially at the outside flank. This is not an effect of the flank definition selection since the trend remains the same when using the database-defined flanks without the context of the TMH (Fig. 2e and f ). For UniHuman (Fig. 2e), the negative charge expectancy on the inside flank does not reach above 2% until position –10 (D) and position–11 (E), whereas, on the outside flank, both D and E start >2%. The same can be seen in ExpAll (Fig. 2f ), where negative residues reach above 2% only as far from the membrane boundary as at position –9 (D) and position–7 (E) on the inside but exceed 2% beginning with positions 1 (D) and 3 (E) on the outside.
The observation of negative charge suppression at the inside flank, herein the “negative-inside depletion” rule, is statistically significant throughout most datasets in this study. The inside-outside bias was counted using the Kruskal-Wallis (KW) test comparing the occurrence of acidic residues within 10 residues of each TMH inside and outside the TMH (Table 2). We studied both the database-reported flanks as well as those obtained from central align-ment of TMHs (see Methods). The null hypothesis (no dif-ference between the two flanks) could be confidently rejected in all cases (P value < 0.001 except for UniBacilli), the sign of the Hstatistic (KW) indicating suppression at the inside and/or preference for the outside flank (except for UniArch). Most importantly, acidic residues were found to be distributed with bias in ExpAll (Pvalue <3.47e-58) and in UniHuman (P value = 1.13e-93). Whereas with UniBacilli, the problem is most likely the dataset size, the exception of UniArch, for which we observe a strong negative inside rule, is more puzzling and indicates biophysical differences of their plasma membranes.
Amino acid residue distribution analysis reveals a general negative charge bias signal in outside flank of multi-pass TMH segments: the negative-outside enrichment rule
a
b
c
d
e
f
Fig. 2Relative percentage normalisation reveals a negative-outside bias in TMHs from single-pass protein datasets. All flank sizes were set at up to ±20 residues. We acknowledge that all values, besides the averaged values, are discrete, and connecting lines are illustrative only. On the
percentage at each position for multi-pass helices from UniHuman in Fig. 3c and e and ExpAll in Fig. 3d and f ), the bias in the distribution of any type of charged residues becomes visible.
With regard to the positive-inside preference, posi-tively charged residues have a background value of 2.0% for arginine and 2.2% for lysine in UniHuman, and 1.7% for arginine and 1.9% for lysine in ExpAll. At the inside flank, this rises to 4.6% for arginine and 4.1% for lysine in UniHuman and 4.6% for arginine and 4.2% for lysine in ExpAll. The mean net charge at each position was calculated for multi-pass and single-pass datasets from UniHuman and ExpAll (Additional file 1: Figure S1). The positive-inside rule clearly becomes visible, as the net charge has a positive skew approximately between residues –10 and –25. What is noteworthy is that the peaks found for single-pass helices were almost three times greater than those of multi-pass helices. For single-pass TMHs, the peak is +0.30 at position –15 in UniHuman and +0.31 at position–14 in ExpAll, whereas TMHs from multi-pass proteins had lower peaks of +0.15 at position –13 in UniHuman and +0.10 at pos-ition–14 in ExpAll. Thus, there is a positive charge bias towards the cytoplasmic side; yet, it is much weaker for multi-pass than for single-pass TMHs.
Notably, a "negative-outside enrichment" trend also can be seen from the distribution of the negatively charged residues, though with some effort (Table 3), as the effect is also weaker than in the case of single-pass TMHs. We studied the flanks under four conditions: (1)
database-defined flanks without overlap between neigh-bouring TMHs, (2) flanks after central alignment of TMHs without flank overlap, (3) database-defined flanks but allowing overlap of flanks shared amongst neigh-bouring TMHs, (4) same as condition (2) but only the subset of cases where there is at least half of the required flank length at either side of the TMH. In UniHuman as calculated under condition (1), aspartic acid is lower on the inside flank (2.3%) than on the out-side flank (3.0%). Glutamic acid is also lower at the in-side flank (2.4%) than the 2.8% on the outin-side flank (Fig. 3c). Slight variations in defining the membrane boundary point do not influence the trend (compare Fig. 3c and e). We find that, in all studied conditions, the UniHuman dataset delivers statistical significances (P values: (1) 6.10e-34, (2) 5.43e-41, (3) 3.00e-57, (4) 5.60e-41), strongly supporting negative charge bias (inside suppression/outside preference; see Table 3).
Surprisingly, the result could not straightforwardly be repeated with the considerably smaller ExpAll. Under condition (1), we find with ExpAll that aspartic acid has a background level of 1.0%, an average of 2.6% on the in-side flank and of 2.9% on the outin-side flank, but glutamic acid’s background is 1.2% but 2.8% on the inside flank and 2.5% on the outside flank. Statistical tests do not support finding a negative charge bias in conditions (1) and (2). Apparently, the problem is TMHs having no or almost no flanks at one of the sides. Statistical signifi-cance for the negative charge bias is detected as soon as this problem is dealt with — either by allowing
Table 2Statistical significances for negative charge distribution skew on either side of the membrane in single-pass TMHs
Single-pass Database-defined flanks Flanks after central alignment
Dataset Helices Negative residues Hstatistic Pvalue Negative residues Hstatistic Pvalue
Inside Outside Inside Outside
ExpAll 1544 848 1648 258.59 3.47E-58 735 1541 262.29 5.44E-59
UniHuman 1705 780 1922 421.53 1.13E-93 652 1865 501.86 3.74E-111
UniER 132 78 156 23.76 1.09E-06 76 150 21.62 3.33E-06
UniGolgi 206 60 240 104.45 1.61E-24 54 239 107.18 4.06E-25
UniPM 493 197 578 177.68 1.56E-40 161 569 215.18 1.02E-48
UniCress 632 314 450 18.23 1.96E-05 231 444 55.80 8.01E-14
UniFungi 729 449 631 28.15 1.12E-07 413 627 38.08 6.79E-10
UniBacilli 124 90 113 3.73 5.35E-02 86 106 2.53 1.12E-01
UniEcoli 54 32 77 17.24 3.30E-05 30 74 14.74 1.24E-04
UniArch 48 113 8 49.66 1.83E-12 96 7 45.62 1.43E-11
The“Helices”column refers to the total TMHs contained in each dataset (ExpALL, TMHs from TOPDB [50]; UniHuman, human representative proteome; UniER, human endoplasmic reticulum representative proteome; UniGolgi, human Golgi representative proteome; UniPM, human plasma membrane representative proteome; UniCress,Arabidopsis thaliana(mouse-ear cress) representative proteome; UniFungi, fungal representative proteome; UniBacilli, Bacilli class
extension of flanks overlap amongst neighbouring TMHs as in condition (3) or by excluding examples without proper flank lengths from the dataset as in condition (4). The respective P values under these conditions are 2.05e-6 and 9.81e-15.
The issues we had with ExpAll raised the question that sequence redundancy in the UniHuman set may have played a role. Therefore, we repeated all calculations but with UniRef50 instead of UniRef90 for mapping into se-quence clusters (see the Methods section for details).
a
b
c
d
e
f
Fig. 3Negative-outside bias is very subtle in TMHs from multi-pass proteins. The meaning for thehorizontal axisis the same as in Fig. 2, with the nega-tive sequence position numbers extending towards the cytoplasmic space. Leucine is inblue. Arginine and lysine are shown indarkandlight orange
respectively. Aspartic and glutamic acid are shown indarkandlight purplerespectively. All flank sizes were set at up to ±20 residues. (aandb) On the
vertical axesare the absolute abundances of residues from TMHs of multi-pass proteins from (a) UniHuman and (b) ExpAll. (candd) On thevertical axes
are the relative percentages at each position for TMHs from multi-pass proteins from (c) UniHuman and (d) ExpAll. As in Fig. 2c and d, thedashed lines
We were surprised to see that harsher sequence redun-dancy requirements do not affect the outcome of the statistical tests in any major way. For the conditions (1)–(4), we computed the followingP values: (1) 1.31e-28 (5940 negatively charged residues inside vs 7492 outside), (2) 1.38e-36 (5516 vs 7320), (3) 5.60e-53 (7089 vs 9233) and (4) 4.18e-41 (4232 vs 5730).
So, the amplifying effect of some subsets in the overall dataset on the statistical test that might be caused by allowing overlapping flanks (condition (3)) is not the
major factor leading to the negative charge skew. Simi-larly, the trend is also not caused by sequence redundancy. Thus, we have learned that the negative charge bias does also exist in multi-pass transmembrane proteins but under the conditions that there are sufficiently long loops be-tween TMHs. Bluntly stated: No loops equals to no charge bias. As soon as the loops reach some critical length, there are differences between single-pass and multi-pass TMHs with regard to occurrence and distribution of negative charges and the inside-suppression/outside-enrichment
Table 3Statistical significances for negative charge distribution skew on either side of the membrane in multi-pass TMHs
A)
Multi-pass Database-defined flanks Flanks after central alignment
Dataset IDs Helices Negative residues Hstatistic Pvalue Negative residues Hstatistic Pvalue
n μ σ Inside Outside Inside Outside
ExpAll 2205 15,563 7.07 3.95 9709 9598 0.04 8.43E-01 9648 9659 0.35 5.56E-01
UniHuman 1789 12,353 6.93 3.20 7196 9164 147.50 6.10E-34 6740 8968 179.77 5.43E-41
UniER 155 898 5.85 3.20 630 584 0.44 5.08E-01 578 576 0.03 8.58E-01
UniGolgi 61 383 6.28 2.97 274 261 0.02 8.75E-01 266 259 0.09 7.65E-01
UniPM 427 3079 7.22 3.30 1945 2499 47.98 4.30E-12 1791 2440 64.42 1.01E-15
UniCress 507 3823 7.55 3.32 2567 2426 0.73 3.93E-01 2398 2433 1.11 2.93E-01
UniFungi 1338 8685 6.50 3.75 5560 5266 5.83 1.57E-02 5140 5214 0.00 9.62E-01
UniBacilli 140 822 5.94 3.98 470 468 0.07 7.92E-01 450 471 0.92 3.38E-01
UniEcoli 529 3888 7.39 3.76 1990 1902 0.26 6.07E-01 1875 1887 0.18 6.71E-01
UniArch 59 327 5.97 2.73 245 175 7.98 4.72E-03 235 181 7.08 7.81E-03
B)
Multi-pass Overlapping flanks Database-defined viable* flanks
Dataset Negative residues Hstatistic Pvalue N Negative residues Hstatistic Pvalue
Inside Outside Inside Outside
ExpAll 11,969 12,615 22.54 2.05E-06 8808 6082 6916 59.93 9.81E-15
UniHuman 8645 11,181 254.30 3.00E-57 8183 5169 6915 179.71 5.60E-41
UniER 750 763 1.16 2.81E-01 516 398 441 3.16 7.55E-02
UniGolgi 333 369 7.12 7.64E-03 195 162 186 3.00 8.30E-02
UniPM 2319 3107 99.68 1.79E-23 1977 1343 1960 98.63 3.05E-23
UniCress 3142 3298 9.21 2.41E-03 2110 1626 1741 6.40 1.14E-02
UniFungi 6724 6814 0.46 4.96E-01 4581 3340 3411 0.41 5.22E-01
UniBacilli 585 636 2.65 1.04E-01 382 230 306 12.73 3.61E-04
UniEcoli 2574 2800 17.88 2.35E-05 1596 951 1114 16.57 4.69E-05
UniArch 342 248 14.67 1.28E-04 132 120 104 0.28 5.97E-01
The“Helices”column refers to the total TMHs contained in each dataset (ExpALL, TMHs from TOPDB [50]; UniHuman, human representative proteome; UniER, human endoplasmic reticulum representative proteome; UniGolgi, human Golgi representative proteome; UniPM, human plasma membrane representative proteome; UniCress,Arabidopsis thaliana(mouse-ear cress) representative proteome, UniFungi, fungal representative proteome; UniBacilli, Bacilli class representative proteome; UniEcoli,Escherichia colirepresentative proteome; UniArch, Archaea representative proteome; seeMethodsfor details). In (A) the
“Database-defined flanks”and in (B) the“Database-defined viable* flanks”and the“Overlapping flanks”columns, the“Negative residues”column refers to the total number of negative residues found in the ±10 flanking residues on either side of the TMH and does not include residues found in the helix itself. (A) In the
“Flanks after central alignment”column, the“Negative residues”column refers to the total number of negative residues found in the–20 to–10 residues and the +10 to +20 residues from the centrally aligned residues with a maximum database defined flank length of 20 residues. The total number of proteins is given in the IDs column. The“Helices”column contains the total number of TMHs in the dataset (n), the average number of TMHs per protein in that population (μ) and the standard deviation of that average (σ). The Kruskal-Wallis scores were calculated for negative residues by comparing the number of negatively charged residues that were within 10 residues inside and 10 residues outside the helices
negative charge bias appears. Not only are there more negative charges within the multi-pass TMH itself (in fact, negative charges are almost not tolerated in single-pass TMHs; see Table 1), but also, there is a much stronger negative-outside skew in the TMHs of single-pass proteins than in those of multi-pass proteins.
Further significant sequence differences between single-pass and multi-single-pass helices: distribution of tryptophan, tyrosine, proline and cysteine
Amino acid residue profiles along the transmembrane seg-ment and its flanks differ between single- and multi-pass TMHs also in other aspects. The relative percentages of all amino acid types (normalisation by the total amount of that residue type in the sequence segment) from single-pass helices of the UniHuman (Fig. 4a; from 1705 TMHs with flanks having 68,571 residues) and ExpAll (Fig. 4b; from 1544 TMHs with flanks having 60,200 residues) were plotted as a heatmap. The amino acid types were listed on the vertical axis according to Kyte and Doolittle hydro-phobicity [52] in descending order.
In accordance with expectations, enrichment for hydro-phobic residues in the TMH, for the positively charged residues on the inside flank as well as a distribution for the negative distribution bias, was found in both datasets. Additionally, the inside interfacial region showed consist-ent enrichmconsist-ent hotspots for tryptophan (e.g. 7.1% at pos-ition –11 in ExpAll, 6.2% at position –10 in UniHuman with flanks after central TMH alignment) and tyrosine (6.4% at –11 in ExpAll, 7.1% at–11 in UniHuman), and some preference can also be seen for the outer interfacial region (e.g. 5.2% at position 11 for tryptophan in ExpAll and 5.8% at position 10 for tryptophan in UniHuman), albeit the “hot” cluster of the outer flank covers fewer positions than that of the inner flank. Further, there is an apparent bias of cysteine on the inner flank and interfacial region (e.g. 5.5% at position –10 in ExpAll, 5.9% at pos-ition –11 in UniHuman) and a depression in the outer interfacial region and flank (up to a minimum of 0.3% in both ExpAll and UniHuman). Proline appears to have a depression signal on the outer flank. Note that, in a simi-lar way to Figs. 2 and 3, the distributions of the flanks derived from centrally aligned TMHs are corroborated by the distributions from the database-defined TMH bound-ary flanks (see outside bands in Fig. 4a–d).
A similar heatmap was generated for UniHuman multi-pass TMHs (Fig. 4c; from 12,353 TMHs with flanks having 452,708 residues) and ExpAll multi-pass (Fig. 4d; from 15,563 TMHs with flanks having 535,599 residues). Whereas the heatmaps of Fig. 4a–c appear quite noisy, the plot for ExpAll multi-pass TMHs ap-pears almost to have undergone Gaussian-like smooth-ing, thus, indicating the quality of this dataset. Tyrosine and tryptophan in the multi-pass case do not appear as
enriched in the interfacial regions of single-pass TMHs from both UniHuman and ExpAll. Prolines are only sup-pressed in the TMH itself and are not supsup-pressed in the outer flank as in the single-pass case but, indeed, are tol-erated if not slightly enriched in the flanks.
Hydrophobicity and leucine distribution in TMHs in single- and multi-pass proteins
Generally, we see in Fig. 4 that compositional biases appear more extreme in the single-pass case, particularly when it comes to polar and non-polar residues being more heavily suppressed and enriched. To investigate this observation, we calculated the hydrophobicity at each sequence position averaged over all TMHs consid-ered (after having window-averaged over three residues for each TMH) using the Kyte and Doolittle hydrophobi-city scale [52] (Fig. 5a) and validated using the White and Wimley octanol-interface whole residue scale [53], Hessa’s biological hydrophobicity scale [36] and the Eisenberg hydrophobic moment consensus scale [54] (Additional file 2: Figure S2). The total set of TMHs was split into 15 sets of membrane-spanning proteins (1 set containing single-pass proteins, 13 sets each containing TMHs from 2-, 3-, 4-…14-transmembrane proteins and another of TMHs from proteins with 15 or more trans-membranes). In Fig. 5b, we show the P value at each sequence position by comparing the respective values from multi-pass and single-pass TMHs using the two-samplettest (Fig. 5b). Strikingly, the inside flank of the single-pass TMHs is much more hydrophilic (e.g. see the Kyte and Doolittle score =–1.3 at position –18) than that of multi-pass TMHs (Pvalue = 5.64e-103 at position
–14). Most likely, the positive-inside rule along with the interfacial clustering of tryptophan and tyrosine contrib-ute to a strong polar inside flank in single-pass helices that is not present in multi-pass helices en masse. Fur-ther, multi-pass TMHs cluster remarkably closely within the transmembrane core; the respective hydrophobicity is apparently not dependent on the number of TMHs in a given multi-pass transmembrane protein. On average, single-pass TMHs are more hydrophobic in the core than multi-pass TMHs (Pvalue < 1.e-72 within positions–5…5 andPvalue = 5.92e-190 at position 0). On the other hand, hydrophobicity differences between TMHs from single-and multi-pass proteins fade somewhat at the transition towards the flanks (Pvalue = 1.85e-4 at position–10, and
Pvalue = 3.35e-31 at position 10).
find that TMHs from single-pass proteins have a trend to contain more leucine residues at the cytoplasmic side of TMHs (see Figs. 2 and 4).
This trend is statistically significant for TMHs in many biological membranes (Table 4, Fig. 6). In the most extreme case of UniCress (single-pass), we see 49% more leucine residues on the inside leaflet than the outside leaflet
(P value = 5.41e-24). This contrasts with UniCress (multi-pass), in which the skew is far weaker, albeit yet statistically significant. There are 6% more leucine residues at the inside half (P value = 2.08e-4). The trend of having more leucine residues at the cytoplasmic half of the TMH is observed for all datasets (both single- and multi-pass) except for UniArch (single-pass). The phenomenon is
a
b
c
d
Fig. 4Relative percentage heatmaps from predictive and experimental datasets corroborate residue distribution differences between TMHs from single-pass and multi-pass proteins. The residue position aligned to the centre of the TMH is on thehorizontal axis, and the residue type is on the
statistically significant withPvalues < 1.e-3 for ExpAll, Uni-Human, UniPM and UniCress (both single- and multi-pass). As with negative charge distribution, UniArch presents a reversed effect compared to other single-pass protein datasets with a 57% reduction in leucine on the inside leaflet compared to the outside leaflet (P value = 7.25e-6). However, leucines of TMHs from UniArch multi-pass proteins have no discernible preference for the inside leaflets (4% more on the inside leaflet,Pvalue = 0.625).
A negative-outside (or negative-not-inside) signal is present across many membrane types
We explored the presence of amino acid residue compos-itional skews described above for human transmembrane
proteins for those in other taxa and also specifically for human proteins with regard to membranes at various subcellular localisations. Acidic residues for TMHs from single-pass and multi-pass helices were plotted according to their relative percentage distributions (of the total amount of this residue type in the respective segment) for five taxon-specific datasets: UniCress (Fig. 6a), UniFungi (Fig. 6b), UniEcoli (Fig. 6c), UniBacilli (Fig. 6d), UniArch (Fig. 6e), and for three organelle-specific datasets: UniER (Fig. 6f), UniGolgi (Fig. 6g), UniPM (Fig. 6h).
For single-pass proteins in all taxon-specific datasets (with the exception of UniArch), there are more negative residues at the outside than at the inside. The skew is statistically significant (see Table 2, P< 0.001) except for
a
b
Fig. 5There is a difference in the hydrophobic profiles of TMHs from single-pass and multi-pass proteins. (a) The hydrophobicity of single-pass TMHs compared to multi-pass segments from the UniHuman dataset. The Kyte and Doolittle scale of hydrophobicity [52] was used with a win-dow length of 3 to compare TMHs from proteins with different numbers of TMHs. This scale is based on the water-vapour transfer of free energy and the interior-exterior distribution of individual amino acids. The same datasets also had different scales applied (Additional file 2: Figure S2). Thevertical axisis the hydrophobicity score, whilst thehorizontal axisis the position of the residue relative to the centre of the TMH, with nega-tive values extending into the cytoplasm. Inblackare the average hydrophobicity values of TMHs belonging to single-pass TMHs, whilst inother coloursare the average hydrophobicity values of TMHs belonging to multi-pass proteins containing the same numbers of TMHs per protein. In
purpleare the TMHs from proteins with more than 15 TMHs per protein that do not share a typical multi-pass profile, perhaps due to their excep-tional nature. (b) The Kruskal-Wallis test (Hstatistic) was used to compare single-pass windowed hydrophobicity values with the average windowed hydrophobicity value of every TMH from multi-pass proteins at the same position. Thevertical axisis the logarithmic scale of the resultant
Pvalues. We can much more readily reject the hypothesis that hydrophobicity is the same between TMHs from single-pass and multi-pass proteins in the core of the helix and the flanks than the interfacial regions, particularly at the inner leaflet due to leucine asymmetry (Table 4)
Table 4Leucines at the inner and outer leaflets of the membrane in TMHs
Dataset Single-pass Multi-pass
Inside Outside Percentage Hstatistic Pvalue Inside Outside Percentage Hstatistic Pvalue
ExpAll 4020 3403 118.13 40.07 2.44E-10 27,986 27,008 103.62 14.13 1.70E-4
UniHuman 4982 3697 134.76 193.02 6.99E-44 25,199 22,365 112.67 195.24 2.29E-44
UniER 359 297 120.88 8.41 3.72E-3 1863 1764 105.61 3.98 4.61E-2
UniGolgi 604 513 117.74 10.74 1.05E-3 753 677 111.23 5.61 1.79E-2
UniPM 1485 1006 147.61 98.90 2.65E-23 6221 5577 111.55 35.21 3.00E-9
UniCress 1495 1005 148.76 102.05 5.41E-24 6491 6099 106.43 13.76 2.08E-4
UniFungi 1389 1308 106.19 3.41 6.48E-2 14,505 14,099 102.88 6.74 9.41E-3
UniBacilli 260 251 103.59 0.03 8.72E-1 1488 1335 111.46 7.59 5.89E-3
UniEcoli 130 100 130.00 2.78 9.53E-2 7251 6975 103.96 5.92 1.50E-2
UniArch 51 118 43.22 20.13 7.25E-6 636 612 103.92 0.24 6.25E-1
UniBacilli. However, despite statistical significance found for UniFungi (P value = 1.12e-7 for database-defined and
P value = 6.79e-10 for flanks after central alignment; Table 2), the trend is not very strong in this case (Fig. 6b). Whereas the skew is just a suppression of negatively charged residues at the inside flank for ExpAll and UniHuman (as well as in UniCress), the bias observed for UniEcoli also involves a negative charge enrichment at the outside flank. In the case of UniArch (Fig. 6e), we see a negative inside preference that is 6.0% in the case of aspartic acid and 6.3% for glutamic acid (not shown), with much lower values close to 0% on the
outside. Whilst the difference is statistically significant for both TMHs (Table 2) from single-pass proteins (P value = 1.83e-12 and P value = 1.43e-11 for two versions of flank determination) and multi-pass pro-teins (P values 4.72e-3, 7.81e-3, 1.28e-4 for three versions of flank determination, see Table 3A and B), the distribution along the position axis is heavily fluctuat-ing, perhaps as a result of the small size of the dataset. However, one can assuredly assign a “negative-inside” tendency to the flanking regions of Archaean TMHs.
In the human organelle datasets, we see trend shifts at different stages in the secretory pathway. In UniER,
a
e
b
f
g
c
d
h
Fig. 6Comparing charged amino acid distributions in TMHs of multi-pass and single-pass proteins across different species and organelles. The relative percentage distribution of charged residues and leucine was calculated at each position in the TMH with flank lengths of ±20 in different datasets. The distributions are normalised according to relative percentage distribution. Aspartic acid and glutamic acid are shown indark purple
there is an enrichment of negative charge on the outside flank of 1–1.5% that is comparable to the magnitude of the positive inside signal. In UniGolgi, there is a sup-pression of negatively charged residues on the inside flank as well as an enrichment on the inside flank result-ing in ~2% distribution difference. For UniPM, there is a negative-inside suppression (but no outside enrichment) as well as a positive-inside signal. All observed trends are statistically significant (see Table 2,P< 1.e-5).
For multi-pass TMH proteins, we either see the same trends but in a weaker form, or no skews are observed at all, as inspection of the graphs in Fig. 6 shows. For data-sets UniER, UniGolgi, UniCress, UniFungi and UniBacilli, the hypothesis of equal distribution of negatively charged residues cannot be rejected (P value > 0.001, see Table 3); thus, a skew is statistically non-significant. Although UniPM has a statistically significant bias (Pvalue < 4.30e-12, Table 3), the trends are more subtle and most present for aspartic acid of UniPM. We see many more negative and positive charges tolerated within the multi-pass TMHs themselves throughout all datasets (Table 1). We note that there is a positive-inside rule for all multi-pass datasets studied herein.
To conclude, we find that negative charge bias distribu-tion is a feature of single-pass protein TMHs that is present across many membrane types, and it can have the form of a negative charge suppression at the inside flank or an enrichment of those charges at the outside flank.
Amino acid compositional skews in relation to TMH complexity and anchorage function
In previous work, we studied the relationship of TMH composition, sequence complexity and function [5–7] and concluded that simple TMHs are more probably responsible for simple membrane anchorage, whereas complex TMHs have a biological function beyond just anchorage. We wished to see how the skews observed in this work relate to that classification. Therefore, the single-pass TMHs from UniHuman and ExpAll were separated into subsets of simple, twilight and complex TMHs using the webserver Transmembrane helix: Simple Or Complex (TMSOC) [6, 7]. The relative per-centages of eight residue types (L, D, E, R, K, Y, W, C; normalisation with the total amount of residues of that amino acid type in all sequence segments considered) were plotted along the sequence position for simple and complex helices (Fig. 7). Of UniHuman single-pass pro-teins, there were 889 records with simple TMHs and 570 with complex TMHs (Fig. 7a). In ExpAll, 769 TMHs from single-pass proteins were simple TMHs and 570 were complex TMHs (Fig. 7b).
It is visually apparent (Fig. 7) that there are (1) stron-ger skews and more inside-outside disparities in simple single-pass transmembranes than in complex single-pass
transmembranes and (2) greater similarities between single-pass complex transmembrane regions and those from multi-pass proteins compared with simple single-pass transmembranes in comparison with either of the other two distributions. To examine the statistical sig-nificance of these observations, we compared the amino acid distributions (K, R, K + R, D, E, D + E, Y, W, L, C) across the range of TMHs with flank lengths ±10 resi-dues using the Kolmogorov-Smirnov (KS), the Kruskal-Wallis (KW) and the χ2 statistical tests. The KS test scrutinises for significant maximal absolute differences between distribution curves, the KW test looks for skews between distributions and theχ2statistical test checks the average difference between distributions. Calculations were carried out over single-pass complex, single-pass simple and multi-pass TMH datasets from both ExpAll and UniHuman (for P values and Bahadur slopes, see Table 5 (dataset UniHuman) and Table 6 (dataset ExpAll)).
The many low P values in Tables 5 and 6 indicate significant differences between the three distributions studied. For the UniHuman dataset (Table 5), we find the most striking, significant differences between charged residue distributions (R, K, D, E) of simple and complex single-pass TMH + flank regions (χ2 P value < 2.23e-3 for single amino acid types). Similarly, simple single-pass TMH + flank segments differ significantly from multi-pass TMH + flank segments (KW test P values < 3.e-2 for R, K, D, E, Y, W amino acid types as well as for K + R and D + E). The trends are the same for the ExpAll dataset (Table 6): simple and complex single-pass TMH + flank regions differ in charged amino acid type distributions (χ2Pvalue < 4.21e-3 for all cases), as do sim-ple single-pass and multi-pass ones (KW test P values < 5.e-2 for R, D, E, Y, W amino acid types and D + E).
Whereas P value tests for significant differences be-tween distributions depend strongly on the amount of data, the more informative Bahadur slopes that meas-ure the distance from the zero hypothesis are independ-ent of the amount of data [55–57]. As we can see in Tables 5 and 6, the absolute Bahadur slopes for the simple single-pass to multi-pass comparison are always larger (even by at least an order of magnitude): (1) for all three statistical tests applied (χ2
a
c
e
g
i
k
b
d
f
h
j
l
Several distribution features of simple TMHs from single-pass proteins, when compared to complex TMHs from single-pass proteins and TMHs from multi-pass proteins, that contribute to the statistical differences (Fig. 7) are especially notable. There is a more pro-nounced trend for positively charged residues and tyro-sine to be preferentially located on the inside flanks and for negatively charged residues to be on the outside flanks. The symmetrical peaks in the percentage distri-bution of tyrosine in complex single-pass TMHs are more akin to multi-pass TMHs, whereas in simple TMHs the distribution resembles a more typical single-pass helix (compare with Fig. 3). Furthermore, the depression of charged residues within the TMH itself is strongest in simple single-pass TMHs.
To emphasise, tryptophan is essentially not tolerated within the simple TMHs, and there are higher peaks of tryptophan occurrence at either flank. We also see a strong inside skew for leucine clustering within the core of simple TMHs which is not present in the“flatter” dis-tributions of complex single-pass TMHs and TMHs from multi-pass proteins.
There is obviously a cysteine-inside preference for simple, single-pass TMHs but less in complex, multi-pass TMHs (Fig. 7). This conclusion is contrary to that of a previous study [51], but that deduction was drawn from a much smaller dataset of 45 single-pass TMHs and 24 multi-pass transmembrane proteins.
Discussion
The“negative-not-inside/negative-outside”skew in TMHs and their flanks is statistically significant
We have seen that, consistently throughout the datasets, there is a trend for generally rare negatively charged residues to prefer the outside flank of a TMH rather than the inside (and to almost completely avoid the TMH itself ), be it by suppression on the inside and/or enrichment on the outside. The trend is much stronger in single-pass protein datasets than in multi-pass protein datasets. However, as we have elaborated, the real crux of the bias appears to be associated with the TMH being simple or complex [6, 7] and, thus, whether or not the TMH has a role beyond anchorage. The existence of this bias has implications for topology prediction of proteins with TMHs, engineering membrane proteins and also
for models of protein transport via membranes and protein-membrane stability considerations.
It should be noted that the controversy in the scientific community about the existence of a negative charge bias at TMHs was mainly with regard to multi-pass transmem-brane proteins. Despite having access to much larger, better annotated sequence datasets and many more three-dimensional (3D) structures than our predecessors, we also had our share of difficulties here (see the Results section titled: Amino acid residue distribution analysis re-veals a general negative charge bias signal in outside flank of multi-pass TMH segments: the negative-outside enrich-ment rule and Table 3). The straightforward approach results in inconclusive statistical tests if datasets become small (for example, if selections are restricted to subcellu-lar localisations or 3D structures or if very harsh sequence redundancy criteria are applied) and, especially, if TMHs with very short or no flanks are included. Therefore, in the case of multi-pass proteins, we studied flanks as taken from the transmembrane boundaries in the databases under several conditions: (1) without allowing flank over-lap between neighbouring TMHs, (2) as a subset of (1) but with requiring some minimal flank length at either side and (3) with overlapping flanks. We also studied flanks after central alignment of TMHs and assuming standardised TMH length. Multi-pass TMHs (without overlapping flanks) do not show statistically significant negative charge bias under condition (1) but, apparently, because of many TMHs without any or super-short flanks, at least at one side. Significance appears as soon as subsets of TMHs with flanks at both sides are studied. Not surprisingly, there is no charge bias if there are no flanks in the first place. It is perhaps worth noting that the re-sults from multi-pass TMHs with overlapping flanks may involve amplification of skews since this involves multiple counting of the same residues. Given the redundancy threshold of UniRef90, we cannot rule out that these statistical skews are the result of a trend from only a small subgroup of TMPs which is being amplified. Hence, we also needed to observe if these same observed biases were true in condition (2), which is indeed the case.
As the "negative-not-inside/negative-outside” skew is widely observed amongst varying taxa and subcellular localisations with statistical significance, it appears, at least to a certain extent, to be caused by physical reasons
(See figure on previous page.)
and to be associated with the background membrane po-tential. Several earlier considerations and observation support this thought: (1) Firstly, a concert between the negative and positive charge on the TMH flanks drives anchorage and the direction of insertion of engineered TMHs [29, 44]. (2) Secondly, the inner leaflet of the plasmalemma tends to be more negatively charged [58]. Specifically, phosphatidylserine was found to distribute
in the cytosolic leaflets of the plasma membrane, and it was found to electrostatically interact with moderately positive-charged proteins enough to redirect the proteins into the endocytic pathway [59]. The negative charge of proteins at the inside of the plasma membrane would decrease the anchoring potency of the TMH via electro-static repulsion. (3) Thirdly, in membranes that maintain a membrane potential, there are inevitably electrical
Table 5Simple TMHs are less similar than complex TMHs to TMHs from multi-pass proteins in UniHuman
Residues Pvalues forχ2 Bahadur slopes forχ2
Simple-vs-complex Simple-vs-multi Complex-vs-multi Simple-vs-complex Simple-vs-multi Complex-vs-multi
R 3.20E-06 7.38E-02 1.24E-01 6.61E-03 2.20E-03 1.27E-04
K 2.23E-03 4.99E-02 2.14E-01 3.99E-03 3.70E-03 1.18E-04
D 1.67E-09 3.06E-01 3.02E-01 3.34E-02 3.24E-03 1.20E-04
E 3.80E-07 2.34E-01 2.31E-01 1.81E-02 3.05E-03 1.36E-04
Y 3.86E-01 3.97E-01 2.11E-01 1.06E-03 1.47E-03 8.25E-05
W 3.77E-03 2.97E-01 3.84E-01 8.52E-03 2.73E-03 1.13E-04
L 3.59E-01 2.88E-01 3.21E-01 1.52E-04 3.92E-04 1.69E-05
C 6.44E-01 3.97E-01 3.41E-01 4.29E-04 1.29E-03 8.57E-05
R + K 2.19E-02 2.83E-01 2.52E-01 1.11E-03 6.33E-04 4.68E-05
D + E 1.47E-03 2.86E-01 2.79E-01 4.59E-03 1.49E-03 6.15E-05
Pvalues for Kolmogorov-Smirnov Bahadur slopes for Kolmogorov-Smirnov
Simple-vs-complex Simple-vs-multi Complex-vs-multi Simple-vs-complex Simple-vs-multi Complex-vs-multi
R 2.31E-01 3.57E-04 1.08E-02 7.66E-04 6.71E-03 2.76E-04
K 4.31E-02 2.18E-03 8.93E-01 2.06E-03 7.56E-03 8.68E-06
D 1.39E-01 5.02E-06 1.08E-02 3.26E-03 3.34E-02 4.52E-04
E 7.96E-02 1.58E-05 1.08E-02 3.10E-03 2.32E-02 4.20E-04
Y 7.96E-02 2.22E-02 2.31E-01 2.81E-03 6.07E-03 7.78E-05
W 2.31E-01 9.06E-04 4.31E-02 2.24E-03 1.58E-02 3.70E-04
L 2.31E-01 2.31E-01 5.31E-01 2.17E-04 4.61E-04 9.42E-06
C 1.39E-01 3.61E-01 3.61E-01 1.93E-03 1.42E-03 8.10E-05
R + K 7.96E-02 1.33E-04 7.96E-02 7.35E-04 4.48E-03 8.60E-05
D + E 4.31E-02 1.58E-05 4.98E-03 2.21E-03 1.31E-02 2.55E-04
Pvalues for Kruskal-Wallis Bahadur slopes for Kruskal-Wallis
Simple-vs-complex Simple-vs-multi Complex-vs-multi Simple-vs-complex Simple-vs-multi Complex-vs-multi
R 2.19E-01 5.06E-02 2.37E-01 7.92E-04 2.52E-03 8.79E-05
K 2.90E-01 1.33E-01 7.00E-01 8.11E-04 2.49E-03 2.73E-05
D 3.50E-01 1.81E-02 2.81E-01 1.74E-03 1.10E-02 1.27E-04
E 2.59E-01 5.65E-02 1.78E-01 1.65E-03 6.04E-03 1.60E-04
Y 6.03E-01 4.53E-01 4.41E-01 5.62E-04 1.26E-03 4.34E-05
W 4.19E-01 1.84E-01 5.70E-01 1.33E-03 3.81E-03 6.62E-05
L 6.37E-01 4.88E-01 9.77E-01 6.68E-05 2.25E-04 3.47E-07
C 5.00E-01 2.22E-01 9.62E-01 6.76E-04 2.10E-03 3.11E-06
R + K 1.87E-01 8.67E-02 4.08E-01 4.86E-04 1.23E-03 3.05E-05
D + E 1.68E-01 4.52E-02 1.91E-01 1.25E-03 3.68E-03 7.97E-05
The statistical results were gathered by comparing complex single-pass TMHs, simple TMHs from single-pass proteins and TMHs from multi-pass proteins in UniHuman. The abundance of different residues at each position when using the centrally aligned TMH approach was compared with several statistical tests (the Kolmogorov-Smirnov, Kruskal-Wallis and theχ2
forces acting on charged residues during chain trans-location, as this influences the translocon machinery when orienting the TMH. Therefore, it is no surprise that we see an inside-outside bias for negatively charged residues that is opposite to the one for positively charged residues. The negative charges in TMH residues have been shown to experience an electrical pulling force as they pass through the bacterial SecYEG translocon
import [42, 43]. Also, they are known to be involved in intra-membrane helix-helix interactions [60]. For ex-ample, aspartic acid and glutamic acid can drive efficient di- or trimerisation of TMHs in lipid bilayers and, furthermore, aspartic acid interactions with neighbour-ing TMHs can directly increase insertion efficiency of marginally hydrophobic TMHs via the Sec61 translocon [60]. In support of this, less acidic residues are found in
Table 6Simple TMHs are less similar than complex TMHs to TMHs from multi-pass proteins in ExpAll
Residues Pvalues forχ2 Bahadur slopes forχ2
Simple-vs-complex Simple-vs-multi Complex-vs-multi Simple-vs-complex Simple-vs-multi Complex-vs-multi
R 5.10E-06 2.98E-01 5.10E-06 9.17E-03 1.61E-03 6.23E-05
K 2.35E-03 1.85E-01 2.35E-03 4.81E-03 3.88E-03 9.78E-05
D 2.61E-08 1.84E-01 2.61E-08 4.15E-02 7.90E-03 1.41E-04
E 2.38E-10 2.04E-01 2.38E-10 3.88E-02 7.08E-03 1.22E-04
Y 3.03E-01 3.11E-01 3.03E-01 2.01E-03 2.49E-03 5.51E-05
W 4.21E-03 4.29E-01 4.21E-03 1.11E-02 4.76E-03 6.46E-05
L 3.79E-01 3.04E-01 3.79E-01 2.28E-04 4.66E-04 1.50E-05
C 3.87E-01 2.52E-01 3.87E-01 1.75E-03 3.28E-03 1.48E-04
R + K 7.16E-04 2.52E-01 7.16E-04 2.80E-03 1.28E-03 3.76E-05
D + E 3.58E-05 2.94E-01 3.58E-05 1.03E-02 1.94E-03 4.90E-05
Pvalues for Kolmogorov-Smirnov Bahadur slopes for Kolmogorov-Smirnov
Simple-vs-complex Simple-vs-multi Complex-vs-multi Simple-vs-complex Simple-vs-multi Complex-vs-multi
R 3.61E-01 4.31E-02 3.61E-01 7.66E-04 7.79E-03 1.62E-04
K 4.31E-02 8.93E-01 4.31E-02 2.49E-03 1.05E-02 6.57E-06
D 1.39E-01 2.18E-03 1.39E-01 4.68E-03 3.61E-02 5.10E-04
E 5.31E-01 1.33E-04 5.31E-01 1.11E-03 2.81E-02 6.87E-04
Y 2.31E-01 9.06E-04 2.31E-01 2.47E-03 6.26E-03 3.30E-04
W 5.31E-01 4.98E-03 5.31E-01 1.29E-03 1.13E-02 4.04E-04
L 2.31E-01 2.31E-01 2.31E-01 3.45E-04 2.12E-03 1.85E-05
C 5.31E-01 3.61E-01 5.31E-01 1.16E-03 8.91E-04 1.09E-04
R + K 1.39E-01 2.31E-01 1.39E-01 7.61E-04 4.82E-03 4.00E-05
D + E 1.39E-01 9.06E-04 1.39E-01 1.99E-03 1.41E-02 2.80E-04
Pvalues for Kruskal-Wallis Bahadur slopes for Kruskal-Wallis
Simple-vs-complex Simple-vs-multi Complex-vs-multi Simple-vs-complex Simple-vs-multi Complex-vs-multi
R 4.37E-01 3.92E-01 4.37E-01 6.24E-04 2.52E-03 4.82E-05
K 3.83E-01 6.93E-01 3.83E-01 7.62E-04 2.88E-03 2.13E-05
D 4.49E-01 1.81E-01 4.49E-01 1.90E-03 1.06E-02 1.42E-04
E 7.64E-01 1.94E-01 7.64E-01 4.71E-04 9.05E-03 1.26E-04
Y 8.32E-01 3.36E-01 8.32E-01 3.09E-04 9.63E-04 5.15E-05
W 7.25E-01 1.36E-01 7.25E-01 6.53E-04 5.44E-03 1.52E-04
L 7.15E-01 7.95E-01 7.15E-01 7.90E-05 3.41E-04 2.90E-06
C 8.47E-01 9.54E-01 8.47E-01 3.05E-04 4.26E-05 5.06E-06
R + K 2.89E-01 5.13E-01 2.89E-01 4.79E-04 1.41E-03 1.82E-05
D + E 4.94E-01 2.07E-01 4.94E-01 7.11E-04 4.14E-03 6.29E-05
As in Table5, the statistical results were gathered by comparing complex single-pass TMHs, simple TMHs from single-pass proteins and TMHs from multi-pass proteins; however, in this case only ExpAll is used. The abundance of different residues at each position when using the centrally aligned TMH approach was compared with several statistical tests (Kolmogorov-Smirnov, Kruskal-Wallis and theχ2
single-pass TMHs, amongst which only some will undergo intra-membrane helix-helix interactions. As the mutation studies have shown negative charge as a topological deter-minant [35], it is perhaps no surprise that we observe a skew in negatively charged residues in a similar manner to the skew in positively charged residues.
Whereas the "negative-not-inside/negative-outside”skew is observed for distantly related eukaryotic species, and it is also present in Gram-negative bacteria such asE. coli, this sequence pattern was not observed for the Gram-positive bacteria, in which there is no observable bias. In contrast, Archaea have a statistically significant “negative-inside” propensity both for single- and multi-pass TM proteins. It is known that Archaea have remarkably different mem-branes compared to other kingdoms of life due to their extremophile adaptations to stress [61]. Whilst it is unclear why negative charge is distributed so differently in UniArch compared to the other taxonomic datasets, one must appreciate that a much more nuanced approach would be needed to draw formal conclusions about Archaea, which current databases cannot provide due to the relatively limited information and annotation of Archaean proteomes.
Methodological issues made previous studies struggle to identify negatively charged skews with statistical significance
Whereas the influence of a negative charge bias in engineered proteins with transmembrane regions on the direction of insertion into the membrane was sol-idly established [35, 39, 40, 45, 62], the search for the negative charge distribution pattern in the statistics of sequences of transmembrane proteins from databases failed to find significance for the expected negative charge skew [9, 13, 14, 16, 31, 45].
Generally speaking, the datasets from previous studies have been considerably smaller compared with those in our work (only Sharpe et al. had a similar order of mag-nitude [9]), especially those with experimental informa-tion about 3D structure and membrane topology that we used for validation. And they might not have had the luxury of using UniProt’s improved TRANSMEM con-sensus annotation based on a multitude of transmem-brane prediction methods and experimental data, but this is also not the major issue. We found that there are other factors that are critical for observing sequence bias such as negative charge skew in the case of TMHs:
1. Acidic residues are rare near and within TMHs, and biases in their distribution are easily blurred by minor fluctuations of much more frequent amino acid types, most notably leucine. Therefore, the method of normalisation is critical. We have shown that normalising by the total amount of residues of
the amino acid type studied within the sequence region under consideration is appropriate to answer the question of where to find a negatively charged residue if there is any at all (called“relative percentage”in this work).
2. The alignment of the TMHs is critical. It was common practice to align the TMH according to the most cytosolic residue [9], although it is known that the membrane/cytosol boundary of the TMH is not well defined (and the exact boundary is even less well understood at the non-cytosolic side). Aligning the transmembrane regions and their flanks from the centre of the TMH was first proposed by Baeza-Delgado et al. [13]. Since we know now that acidic residues are often suppressed in the cytosolic flank and within the TMH, this implies that the few acidic residues found in the cytosolic interface would appear more comparable to those in the poorly defined non-cytosolic interface, as the respective residues are spread over more potential positions, diminishing any observable bias.
3. We find that separation into single- and multi-pass transmembrane datasets (or, even better, simple and complex transmembranes [6,7]) is critical to study the inside/outside bias. As many TMHs in multi-pass transmembrane proteins have essentially no flanks or very short flanks if the condition of non-overlap is applied to flanks of neighbouring TMHs, this might also obscure the observation of the negative charge bias. If there are no flanks, then there will be no residue distribution bias in these flanks. The problem can be alleviated by either studying only subsets with minimal flank lengths on both sides (although datasets might become too small for statistical analysis) or by allowing flank overlaps between neighbouring TMHs. 4. This classification is even more justified in the light
of previous reports about the“missing