DEMOGRAPHIC RESEARCH
VOLUME 33, ARTICLE 16, PAGES 451
−
498
PUBLISHED 4 SEPTEMBER 2015
http://www.demographic-research.org/Volumes/Vol33/16/ DOI: 10.4054/DemRes.2015.33.16
Research Article
Partnership dynamics across generations of
immigration in France:
Structural vs. cultural factors
Ariane Pailhé
This publication is part of the Special Collection on “Partnership dynamics among immigrants and their descendants in Europe,” organized by Guest Editors Hill Kulu and Tina Hannemann.
©2015 Ariane Pailhé.
This open-access work is published under the terms of the Creative Commons Attribution NonCommercial License 2.0 Germany, which permits use, reproduction & distribution in any medium for non-commercial purposes, provided the original author(s) and source are given credit.
1 Introduction 452
2 Theoretical framework, previous research, and hypotheses 453
2.1 Partnership formation among immigrants 453
2.2 Partnership formation among descendant of immigrants 455
3 The French context 458
3.1 France: An old country of immigration 458
3.2 Marital trajectories in France 458
3.3 Marital practices in migrant origin societies 460
3.4 Migrant marital practices in France 462
4 Data and methods 463
4.1 Data 463
4.2 Analysis strategy 465
4.3 Variables 465
5 Results 468
5.1 First union formation 468
5.2 The type of first union 473
5.3 The transition from cohabitation to marriage 478
6 Conclusion and discussion 480
7 Acknowledgements 483
References 484
Appendix 1 492
Appendix 2 494
Partnership dynamics across generations of immigration in
France: Structural vs. cultural factors
Ariane Pailhé1
Abstract
BACKGROUND
Postponed union formation, declines in marriage, and increases in cohabitation represent major changes in family behavior. The question arises whether these changes have taken place among immigrants and their descendants.
OBJECTIVE
This study analyzes the integration dynamics across generations of immigrants in France by focusing on partnership formation patterns. It addresses how the socialization vs. assimilation hypothesis shapes immigrants and their descendants’ first partnership formation patterns, analyzing the interplay of cultural and structural factors.
METHODS
It compares i) the timing of union formation, ii) the type of first union (cohabitation vs. marriage), and iii) the transition from cohabitation to marriage of first- and second-generation male and female immigrants from the same region of origin with those of the native-born. The data come from the Trajectories and Origins survey (2008) that oversamples immigrants and their descendants. Piecewise-constant exponential models are estimated.
RESULTS
There is a convergence towards prevailing French behavior across the generations of immigrants. Second-generation immigrants form their first union later than the first generation and the level of informal cohabitation increases. Structural factors such as higher level of education have led to changes in partnership formation patterns over generations of immigrants but the convergence is not complete, and cultural factors have a strong effect, especially for women.
CONCLUSIONS
Descendants of immigrants have more choices than their parents regarding lifestyle and personal arrangements, and traditional family behaviors weaken. But first unions are still considered to be a long-term commitment rather than a trial period.
1. Introduction
Since the 1960s, family forms in most European countries have become more varied, in parallel with increasingly diverse and individualized family life courses. The sequence of demographic events and the pace at which they occur are now less standardized than before (Brückner and Mayer 2005; Buchmann and Kriesi 2011). Postponed union formation, declines in marriage, and increases in cohabitation represent some of the main changes in family behavior. This process of de-standardization and de-institutionalization of family forms is the result of increasing individualization and a weakening of the normative constraints that shape transitions and their sequencing over the life course (Lesthaeghe and Surkyn 2004). These changes in family models have also arisen due to the changing gender system and the increasing economic independence of women and their changing roles in society (Oppenheim, Mason, and Jensen 1995). Growing economic insecurity and changes in job standards have also been major causes of the transformation of the life course (Blossfeld et al. 2005).
The question arises of whether such changes have also taken place among immigrants and their descendants, who comprise a large share of the European population. This question is important since, compared to the native-born French, differences and similarities in age at partnership formation and type of union indicate the level of adherence to norms and practices in the host society (Adserà and Ferrer 2014). The postponement of partnership formation and the rise of cohabitation are indicators that individual behaviors are less determined by tradition and more open to individual choice (Bernardt et al. 2007). They also reflect changes in women’s roles (Sassler 1997). Thus, union formation patterns indicate the extent to which immigrants and their offspring integrate culturally into their host society (Algan et al. 2012). However, little attention has been paid to the timing of union formation among immigrants, and even less to the type of union they engage in (Kulu and Gonzáles-Ferrer 2014).
the 2008 adult population (Insee 2012). They come from an extremely wide range of geographical origins. In some of these regions, unions are formed in a very similar way to the prevailing French model, i.e., widespread cohabitation, rising age at which first-time couples are formed, and frequent separations (Sobotka and Toulemon 2008). In other sending countries, marriage is almost universal, and the age at first marriage remains low. France has also adopted a specific model of integration, i.e., assimilation, by promoting the conformity of immigrants and their descendants to the ideals of the French Republic (Favell 2001). Relatively few cultural rights are granted to immigrants (Koopmans 2010), which limits the persistence of cultural differences (Huschek, Liefbroer, and de Valk 2010). This specific context should theoretically drive a convergence of partnership dynamics towards French standards.
In order to analyze this potential convergence in the absence of data that follows immigrant groups over time and over several generations, we compare the partnership dynamics of first- and second-generation immigrants from the same region of origin with those of the native-born. We analyze several outcomes: i) the timing of union formation, ii) the type of first union (cohabitation vs. marriage), and iii) the transition from cohabitation to marriage. We consider decreasing differences between generations of immigrants and the native-born to be a sign of gradual adaptation to the behaviors and norms that prevail in France. Migration patterns differ greatly between men and women, and gender roles are constructed differently in origin and destination societies. Thus, we analyze partnership dynamics by gender. The recent Trajectories and Origins survey (2008) provides an opportunity to investigate the partnership dynamics of immigrants and their descendants.
2. Theoretical framework, previous research, and hypotheses
2.1 Partnership formation among immigrants
respects migration influences timetables for partnership formation (Glick 2010; Lloyd 2006).
The first hypothesis emphasizes that migration is a significant disruption in the individual life course. In particular, migrants have to adapt to a completely new marriage market, which delays partnership formation (Adsera and Ferrer 2014). Alternatively, the family formation hypothesis underscores the fact that migration and family events are interrelated. Marriage is often a reason to migrate (Kofman 2004; Lievens 1999), especially if family visas are granted to spouses, and marriage and migration occur simultaneously when selection of migrants is based on family reunification policy (Tribalat 1996). The socialization hypothesis considers that exposure to certain norms and values during an immigrant’s childhood (i.e., those of their country of origin) have long-lasting effects and are dominant in shaping individual behaviors (Michaël and Tuma 1985). In particular, socially recognized norms exist for the timing and sequencing of events associated with the transition to adulthood, and thus influence partnership dynamics (East 1998). The uncertainty associated with the migration experience and the perception that the new environment threatens these values can even result in an over-emphasis of values (Huschek, de Valk, and Liefbroer 2011). Following this hypothesis, union formation patterns should be close to the practices in the country of origin. By contrast, the assimilation or adaptation hypothesis emphasizes adapting immigrant behaviors to the environment and norms of the society of settlement (Foner 1997). Migration transforms the normative, social, and economic contexts in which the decision is taken to form a union, and the partnership dynamics should converge to those of the host country. This adaptation can be reinforced by the fact that immigrants are generally a highly selected group from their country of origin. This selection may be based on skills required in the host country, which may impact family behaviors.
2.2 Partnership formation among descendant of immigrants
When immigrants come from societies in which the transition to adulthood has characteristics other than those of the society in which they grow up, the socialization process of their descendants is characterized by potentially conflicting injunctions (de Valk and Liefbroer 2007; Hamel et al. 2012). Being attached to two cultural heritages, their behaviors are shaped by both the dominant norms of the society in which they grow up and by the intergenerational transmission of family values and practices (Huschek, Liefbroer, and de Valk 2010; Collet and Santelli 2012). Thus both the adaptation and the socialization hypotheses apply to their partnership dynamics. Specific family values and norms can be expected to persist among descendants of immigrants, because their core identity would be scrutinized if they were to renounce their own traditional values and norms regarding the appropriate timing and type of union formation (Arias 2001; Schnapper 1991). In addition, the reality of belonging to a minority community may make the intergenerational transmission of family values an important issue among immigrants. Conversely, the values and behaviors adopted by descendants of immigrants can shift towards those of the majority population by means of school socialization, the media, and friends from the host culture (Huschek, de Valk, and Liefbroer 2011).
major type of union among second-generation Turks, especially for women (Milewski and Hamel 2010).
This study addresses how socialization vs. adaptation shapes immigrants and their descendants’ partnership formation patterns in the French context. The ‘assimilation or adaptation’ hypothesis predicts that immigrants are expected to adapt their behavior during their time spent in France and over generations.
H1: A larger gap in union formation behavior between first and second generations is a sign of gradual adaptation to behaviors and norms that prevail in France.
This hypothesis predicts that union formation behavior among the descendants of immigrants converges to that of native-born men and women, and that cohabitation among immigrants’ descendants is higher than that of their parents’ generation. According to this hypothesis, we also expect that immigrants from earlier immigration waves (Southern Europe and the Maghreb) have adapted more than more recent immigrants.
Alternatively, the socialization hypothesis underlines the effect of exposure to values during childhood as a key determinant of individual behaviors. Immigrants in France come from different origins, and thus bring a variety of human, economic, and social capital. Since norms and practices vary in terms of the appropriate timing of union formation and cohabitation, union formation patterns are expected to differ between origins and between first and second generations.
H2a: The greater the cultural differences between immigrants and the native population, the larger the difference in union formation patterns is likely to be.
According to this hypothesis, we expect that the timing and type of union for immigrants and the second generation from Southern Europe are more likely to be close to those of the native French. In particular, they are more likely to cohabit than immigrants and the children of immigrants from Asia, Turkey, North Africa, and Sub-Saharan Africa.
As for the mainstream population (South 2001; Axinn and Thornton 1992), parental background is an important factor in explaining the transmission of preferences and the timing of first unions (de Valk and Liefbroer 2007; Huschek, Liefbroer, and de Valk 2010). Relatively modern attitudes towards family formation and postponed entry into first union are found among second-generation young adults whose parents have high human capital, small family size, and low religious commitment (Idema and Phalet 2007).
Education is one of the most important determinants of marriage prevalence and timing (Ní Bhrolcháin and Beaujouan 2012). In particular, higher educational attainment leads to greater autonomy in life course choices, and it increases the cost of union. Hence, educational attainment has a strong delaying effect on union formation, as union formation is usually seen as incompatible with educational enrolment (Blossfeld and Huinink 1991). The level of education also shapes both individual preferences and the size of the marriage market (Furtado 2012). In the case of immigrants’ descendants, a higher level of education also leads to deviations from the parents’ views and toward a stronger preference for autonomy in life course choices (Collet and Santelli 2012). It also provides higher socio-economic resources, which help to impose the offspring’s own choices on their parents. Thus, higher education causes partnership timing to converge with that which prevails among the majority population (Arias 2001). Empirical studies show that own level of completed education has more impact than the parents’ level, especially for women (Bernardt et al. 2007). The higher transition rates to a first union among women in the Turkish-origin group appear to be related mainly to a lower level of education among Turkish immigrants’ descendants in France (Milewski and Hamel 2010). Thus, a convergence with the timing that prevails among the native population occurs as the level of education increases.
H3: Increasing levels of higher education leads to a postponement of union formation and to higher prevalence of cohabitation.
H4: Immigrants and their descendants who are in a disadvantaged position (especially in the labor market) postpone partnership formation, which explains differences according to origin.
Few studies have investigated immigrant groups from a gendered perspective, and most have been devoted mainly to preferences rather than behaviors. Idema and Phalet (2007) show that second-generation Turkish daughters in Germany shift towards more egalitarian values, particularly when their mothers are highly educated, whereas sons remain as traditional as their fathers. Educational level has a strong effect on egalitarian preferences among second-generation Turks (Bernardt et al. 2007; Diehl, Koenig, and Ruckdeschel 2009; Huschek, Liefbroer, and de Valk 2011). Due to huge gender differences in countries of origin and to higher parental control over daughters than sons, we expect partnership formation patterns to differ by gender.
H5. Partnership formation among female descendants is closer to that of their parents, i.e., they are younger at partnership formation and have a higher rate of direct marriage.
3. The French context
3.1 France: An old country of immigration
descendants of immigrants represent a significant share of the adult population: 10.5% in 2008 (Insee 2012).
The composition of immigration flows and the immigrant population according to country of origin changed over time. After the Second World War, the majority of immigrants came from Southern Europe (Italy, Spain, and Portugal). Subsequently France received more and more immigrants from its former colonies in North and Sub-Saharan Africa, as well as Southeast Asia. From the middle of the 1950s the Maghrebis (i.e., those from Algeria, Morocco, and Tunisia) and the Turkish formed the most significant groups of new immigrants. Migration from Southeast Asia (Vietnam, Cambodia, and Laos) took place later and over a short period (mid-1970s to mid-1980s). Immigration from other EU-27 countries and from Sub-Saharan Africa (Senegal, Mali) is more recent, and the latter is gaining in significance.
3.2 Marital trajectories in France
second and third births stand at 44% and 35%, respectively. The majority of couples do not turn their union into marriage when they have a child: 60% of couples cohabiting at first childbearing are still cohabiting when they have their second child (Charton 2009).
As a result of changes in norms and other structural factors, such as additional years spent in education, first unions take place at higher ages than before. The median age at first union formation increased from 23.8 for men born in 1955 to 26.0 for men born in 1971, according to the Etude de l’histoire familiale survey conducted in 1999 (Prioux 2005). For women the corresponding figures are 21.5 for women born in 1955 and 23.7 for women born in 1974. At the same time, the age at first partnership became more diverse. Age at first marriage was also postponed: first marriages in these cohorts were contracted, respectively, at age 25.0 and 30.6 for men, and 22.9 and 28.9 for women.
3.3 Marital practices in migrant origin societies
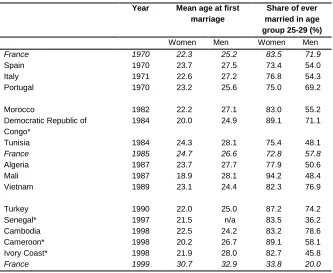
Marital practices differ greatly across immigrants’ countries of origin. To illustrate these differences, Table 1 reports the mean age at marriage and the percentage of ever-married individuals between ages 25–29 for a selection of the main countries of origin of immigrants in France. The selected year approximates the period when the majority of migrants from each origin came to France. In Southern European countries the mean age at marriage was close to that of France or even a bit higher. In these countries, the process of de-standardization and de-institutionalization of family forms occurred much later than in France (Pailhé et. al 2014). In particular, postponement of union formation and the rise in the frequency of cohabitation began later (Billari and Liefbroer 2010), but the marital practices resemble each other more than those in the other immigrant-origin societies. Partnership dynamics differ significantly from the French in Turkey and Northern and Sub-Saharan Africa
control over the choice of spouse (Thiriat 1998). Consanguineous marriages between cousins are preferred in these societies, in order to assure the continuation of the family line (Milewski and Hamel 2010; Collet and Santelli 2012).
Table 1: Data on marital status in immigrants’ countries of origin
Year Mean age at first marriage
Share of ever married in age group 25-29 (%)
Women Men Women Men
France 1970 22.3 25.2 83.5 71.9
Spain 1970 23.7 27.5 73.4 54.0
Italy 1971 22.6 27.2 76.8 54.3
Portugal 1970 23.2 25.6 75.0 69.2
Morocco 1982 22.2 27.1 83.0 55.2
Democratic Republic of Congo*
1984 20.0 24.9 89.1 71.1
Tunisia 1984 24.3 28.1 75.4 48.1
France 1985 24.7 26.6 72.8 57.8
Algeria 1987 23.7 27.7 77.9 50.6
Mali 1987 18.9 28.1 94.2 48.4
Vietnam 1989 23.1 24.4 82.3 76.9
Turkey 1990 22.0 25.0 87.2 74.2
Senegal* 1997 21.5 n/a 83.5 36.2
Cambodia 1998 22.5 24.2 83.2 78.6
Cameroon* 1998 20.2 26.7 89.1 58.1
Ivory Coast* 1998 21.9 28.0 82.7 45.8
France 1999 30.7 32.9 33.8 20.0
Note: Selected years for the average age at marriage are those closest to the median year of migration for each origin. Major
African countries are selected. * Including consensual unions
Source: United Nations, Department of Economic and Social Affairs, Population Division. World Marriage Data 2012.
pre-marital sex is – or was2 – illegal, as it constitutes an offense to the family honor (Milewski and Hamel 2010; Collet and Santelli 2012). Women’s sexuality is strictly controlled and families encourage early marriage, since it guarantees that a woman’s reputation and responsibility for her are taken care of, and it also increases the chances of a better partner.
3.4 Migrant marital practices in France
In France, male migration is primarily a migration of young single men, while the share of women who meet their partner before migration is significantly higher (Pailhé and Hamel 2015). Immigrant men wait until they are properly settled in France before starting a family: they postpone partnership formation until later than both the native French and men in their country of origin. This postponement is increasing over cohorts and is particularly high for migrants from the Maghreb and Sub-Saharan Africa, while it occurs earlier for migrants from Turkey and Portugal (Tavan 2005). Female immigrants more frequently marry before coming to France. They also postpone partnership formation in comparison to the practice in their country of origin, but in 1999 their timing was close to that of French female natives.
Partnership behaviors of Turkish and African second generations in France are influenced by two conflicting sets of values. On the one hand, their parents’ value systems are marked by patriarchal values and Muslim traditions. On the other hand, they experience the more individualistic values of French society. French people of African and Turkish descent are more conservative with regard to certain values, especially those that ban sex before marriage for girls (Brouard and Tiberj 2005). Many Muslim women appear to endorse this norm (Andro 2012). In parallel to this conservatism, second-generation Turks and Africans appear to be more open to modern values regarding cohabitation and egalitarian gender roles (Streiff-Fénart 2006; Collet and Santelli 2012). As far as behaviors are concerned, second-generation Turks form their first union earlier and rarely cohabit (Milewski and Hamel 2010). On the other hand, young second-generation immigrants from Southern Europe and the Maghreb enter adulthood later than the native French (Hamel, Moguérou, and Santelli 2011).
Gender differences during the transition to adulthood are strong among descendants of immigrants from Turkey and Northern and Sub-Saharan Africa: sons have a lot of autonomy, while daughters are more strictly supervised, especially when they go out (Hamel, Moguérou, and Santelli 2011). However,
immigrants’ parents strongly encourage education for their daughters, which is a factor of emancipation (Collet and Santelli 2012).
4. Data and methods
4.1 Data
The data we use come from the Trajectories and Origins (TeO) survey conducted in 2008 by the French National Institute of Demography (INED) and the French National Statistical Office (INSEE). This survey is particularly appropriate since it investigates the living conditions and social trajectories of immigrants and second-generation immigrants. Twenty-two thousand people living in France3 were interviewed, and immigrants and their descendants were oversampled (Beauchemin, Hamel, and Simon 2010). The native French and immigrants were 18–60 years old (1948–90 cohorts), while descendants of immigrants were 18–50 years old (1958– 90 cohorts).
The survey contains retrospective biographical data concerning family and employment history, in particular dates (month and year) of first and current co-residential union, first and current marriage, and first separation. The survey also contains standard socioeconomic information and very detailed information on family background; e.g., parents’ social class, religious affiliation, level of education, number of siblings, language skills, etc. There is detailed information on migration origin: individual’s place of birth and nationality at birth, parent’s place of birth and nationality at birth, year of arrival in France, and reason for immigration. Native French are defined as individuals born to two French-born parents. Immigrants are persons born abroad without French nationality at birth. Descendants of immigrants are persons born in metropolitan France with at least one immigrant parent. Even though they are not immigrants according to French law, individuals born in overseas French departments or whose parents were born in overseas French departments were excluded from the analysis, since they have specific partnership patterns. Because we are interested in partnership formation patterns in the French context, we only take into consideration unions among immigrants that began after arrival in France, as did Nadja Milewski (2007) in her study of entry into parenthood4. Immigrants who experienced first union formation in the same year as immigration are also excluded in order to leave out cases where
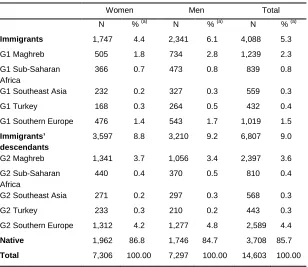
union formation and migration are jointly determined. We mainly exclude women5, who migrate less often on their own initiative. The immigrants we select, especially women, entered their first union at higher ages than those who are excluded from our sample (Pailhé and Hamel, 2015). These migrants may adapt more readily to the partnership practices of the settlement country. Cases with missing information, with entry into first union prior to age 15, or with inconsistent dates in their life history, were also excluded from the analysis6. Our sample consists of 14,603 individuals. Table 2 displays the sample size for each migrant group and the share of each group in respect to the whole population.
Table 2: Distribution of population by origin, sex, and cohort
Women Men Total
N % (a) N % (a) N % (a)
Immigrants 1,747 4.4 2,341 6.1 4,088 5.3
G1 Maghreb 505 1.8 734 2.8 1,239 2.3
G1 Sub-Saharan Africa
366 0.7 473 0.8 839 0.8
G1 Southeast Asia 232 0.2 327 0.3 559 0.3
G1 Turkey 168 0.3 264 0.5 432 0.4
G1 Southern Europe 476 1.4 543 1.7 1,019 1.5
Immigrants’ descendants
3,597 8.8 3,210 9.2 6,807 9.0
G2 Maghreb 1,341 3.7 1,056 3.4 2,397 3.6
G2 Sub-Saharan Africa
440 0.4 370 0.5 810 0.4
G2 Southeast Asia 271 0.2 297 0.3 568 0.3
G2 Turkey 233 0.3 210 0.2 443 0.3
G2 Southern Europe 1,312 4.2 1,277 4.8 2,589 4.4
Native 1,962 86.8 1,746 84.7 3,708 85.7
Total 7,306 100.00 7,297 100.00 14,603 100.00
Source: Trajectories and Origins survey (TeO), INED-INSEE, 2008.
(a) The percentages are computed using sampling weights to give the proportion of these groups in the total population.
5 2,135 migrants (718 men and 1,417 women) were excluded. 1,389 entered a first union prior to
migration and 746 entereda first union in the year they migrated.
6 90 individuals entereda first union before age 15 and 329 individuals have missing information for the
4.2 Analysis strategy
In order to analyze the socialization vs. adaptation hypothesis, we analyze variations in partnership formation patterns among immigrants and second generations, as well as across immigrant groups. The analysis is divided into three parts. First we describe the differences in age at first union across generations of immigrants and origins. Univariate Kaplan-Meier estimates are used to describe differences in the timing and prevalence of a first union. The analyses are stratified by sex and adjusted for the stratifying nature of the survey7 by using sampling weights. In order to determine whether the observed differences in the timing of partnership formation are culturally or structurally determined, piecewise-constant exponential models are estimated. In this semi-parametric continuous time duration model, the duration time is split into several intervals. The hazard rate is allowed to differ in different time periods but is assumed to be constant within any given time period. We estimate the timing (in months) of entry into first union, with the risk time starting at age 15 for second-generation immigrants and native French. For first-generation immigrants the risk of entering a first union is calculated on the basis of their age at arrival in France. Cases are censored at the interview date or at age 45; whichever comes first.
Second, the timing of first cohabitation and first direct marriage are estimated as competing risks. In the event of a competing risk, cases are censored at the interview date or at age 45. Third, we analyze the duration between cohabitation and marriage in order to estimate whether cohabitation is a stepping-stone to marriage. For this analysis, exposure time starts at the beginning of first cohabitation.
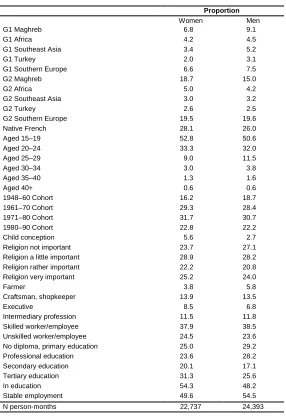
4.3 Variables
Unions are defined as couples living together under the same roof for 6 months or more. First union is defined as the first cohabiting union or the first marriage lasting at least 6 months. First marriage is defined as the first religious or civil marriage. The same set of control covariates is used in the multivariate analysis, with the covariates being added step by step. The distribution of control variables is presented in Table 3. The baseline model (Model 1) controls for origin, cohort, and
7 Sampling weights were calibrated so that the estimated counts corresponded with the population of
fertility. To test our two first hypotheses, immigrants and their descendants are distinguished and several groups are selected that are representative of the main immigration groups with a variety of human, economic, and social capital. The following aggregated regions of origin are used: the Maghreb (Algeria, Tunisia, and Morocco), Sub-Saharan Africa (Senegal, Mali, Cameroon, Guinea, etc.), Southeast Asia (Vietnam, Cambodia, and Laos), Turkey and Southern Europe (Italy, Spain, and Portugal). Four birth cohorts are distinguished: born in 1948-1960, in 1961– 1970, in 1971–1980, and in 1981–1990. Since premarital pregnancy among single women increasingly prompts transition into union formation (Perelli-Harris et al. 2012), we include a time-varying variable by computing the year of first birth minus 9 months. In order to test if socio-economic and cultural position of the family shape the decision to form a union (H2b), Model 2 controls for background variables. Social background is taken into account through parents’ social class and the level of religiosity, i.e., the level of importance given to religion during childhood education. To examine whether behaviors are related to educational level (H3) we include the level of education (Model 3), which is introduced in the model as four dummy variables: basic education, low professional education, secondary education, and high education (university)8. To test how socio-economic resources shape the timing of partnership formation (H4), access to stable employment (i.e., a job lasting at least one year) is computed for each calendar year (Model 4). This time-dependent variable is lagged by one year. A time-varying dummy variable for school enrollment is also added, as school enrollment may be incompatible with union formation (Glick et al. 2006). It is expected to delay the entrance into union, education level being controlled for. In order to analyze whether socio-cultural background, educational attainment, and socio-economic resources shape entry into partnership and the type of union, separate analyses by origin group are also implemented. All models are estimated separately for men and women in order to test H5.
8 Educational level is measured by French standards. Since most countries of origin were former French
Table 3: Distribution of control variables
Proportion
Women Men
G1 Maghreb 6.8 9.1
G1 Africa 4.2 4.5
G1 Southeast Asia 3.4 5.2
G1 Turkey 2.0 3.1
G1 Southern Europe 6.6 7.5
G2 Maghreb 18.7 15.0
G2 Africa 5.0 4.2
G2 Southeast Asia 3.0 3.2
G2 Turkey 2.6 2.5
G2 Southern Europe 19.5 19.6
Native French 28.1 26.0
Aged 15–19 52.8 50.6
Aged 20–24 33.3 32.0
Aged 25–29 9.0 11.5
Aged 30–34 3.0 3.8
Aged 35–40 1.3 1.6
Aged 40+ 0.6 0.6
1948–60 Cohort 16.2 18.7
1961–70 Cohort 29.3 28.4
1971–80 Cohort 31.7 30.7
1980–90 Cohort 22.8 22.2
Child conception 5.6 2.7
Religion not important 23.7 27.1
Religion a little important 28.9 28.2
Religion rather important 22.2 20.8
Religion very important 25.2 24.0
Farmer 3.8 5.8
Craftsman, shopkeeper 13.9 13.5
Executive 8.5 6.8
Intermediary profession 11.5 11.8
Skilled worker/employee 37.9 38.5
Unskilled worker/employee 24.5 23.6
No diploma, primary education 25.0 29.2
Professional education 23.6 28.2
Secondary education 20.1 17.1
Tertiary education 31.3 25.6
In education 54.3 48.2
Stable employment 49.6 54.5
N person-months 22,737 24,393
Source: Calculations based on Trajectories and Origins survey (TeO), INED-INSEE, 2008
5. Results
5.1 First union formation
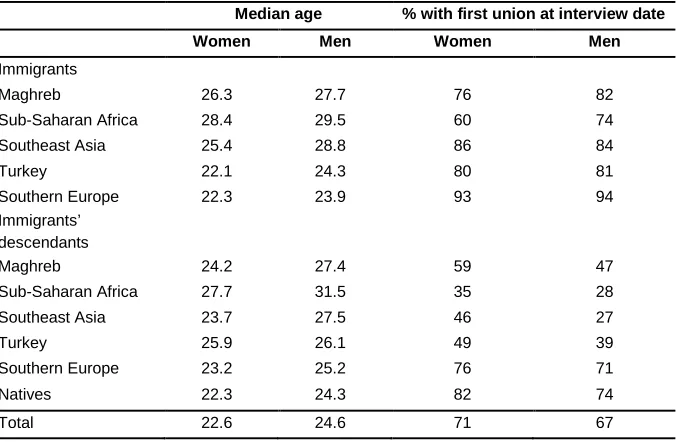
The timing of union formation varies widely across origins and between the sexes (Table 4). For men and women alike, immigrants generally enter into their first union later than the native French. However, immigrants from Southern Europe and Turkey are an exception, as their median age at first union formation is close to that of the native French; i.e., around 22 years old for women and 24 years old for men. Immigrants from the Maghreb and Southeast Asia form their first union three to four years later, and those from Sub-Saharan Africa much later: at 28.4 years for women and 29.5 for men.
Since the second generations are still young – except those from Southern Europe and, to a lesser extent, those from the Maghreb9 – only a small proportion had experienced a first union at the time of the survey: about one quarter of male descendants of Sub-Saharan African or Southeast Asian immigrants and more than 4 out of 10 men of Maghrebian or Turkish descent. The proportion is higher among women, as they form their first union earlier: 35% for descendants of Sub-Saharan African immigrants, 46% for Southeast Asian immigrants, 59% for Northern African immigrants, and 49% for Turkish immigrants. All groups of descendants form their first union later than the native French, partly because they belong to younger cohorts. The gap with respect to the native French narrows for second-generation immigrants from the Maghreb, Southeast Asia, and Sub-Saharan Africa, especially for women. Conversely, second generations from Turkey10 and Southern Europe and men from Sub-Saharan Africa enter into union later than immigrants of the same origin.
9
The average age is, respectively, 34 and 29 years old for descendants of immigrants from Southern Europe and Maghreb, while other descendants’ average age is about 25 years old.
10 The median age at first union for female descendants of Turkish immigrants is two years higher than
Table 4: First union formation, by origin, and sex
Median age % with first union at interview date
Women Men Women Men
Immigrants
Maghreb 26.3 27.7 76 82
Sub-Saharan Africa 28.4 29.5 60 74
Southeast Asia 25.4 28.8 86 84
Turkey 22.1 24.3 80 81
Southern Europe 22.3 23.9 93 94
Immigrants’ descendants
Maghreb 24.2 27.4 59 47
Sub-Saharan Africa 27.7 31.5 35 28
Southeast Asia 23.7 27.5 46 27
Turkey 25.9 26.1 49 39
Southern Europe 23.2 25.2 76 71
Natives 22.3 24.3 82 74
Total 22.6 24.6 71 67
Source: Calculations based on Trajectories and Origins survey (TeO), INED-INSEE, 2008
Coverage: Immigrants aged 18–60 who arrived single in metropolitan France, Native French aged 18–60, and descendants of immigrants aged 18–50.
Since these cross-origin differences in median age at first union may arise from a compositional effect, we control for cohort, family background, educational attainment, and activity status (Table 5). Model 1 compares the origin groups, controlling for birth cohort and conception of a child. For immigrant women from Sub-Saharan Africa, the Maghreb, and Southeast Asia, the results are in line with those of the Kaplan-Meier non-parametric analysis: they exhibit slower entry into union compared to native French women. On the other hand, once controlled for cohort and by considering exposure time after migration, immigrant women from Turkey and Southern Europe have a higher probability of an early union. For men, all groups have faster transition to first union, except those from Southeast Asia. The great majority of immigrants from this region (men and women alike) are single when they migrate (Pailhé and Hamel 2015). They also postpone union formation after migration.
in Models 2 and 3 as compared to Model 1. When employment path is controlled for, the gap increases between female Turkish immigrants and the native French: however, there is no significant difference between native French and female immigrants from Southern Europe (Model 4). In other words, the fastest transition to union formation for immigrant women from Southern Europe is related to the fastest entry into stable employment. The opposite explanation is found for female Turkish immigrants. The fastest transition to union for male Turkish immigrants does not appear to be related to socio-cultural background, level of education, or timing of entry into employment; while among Southern European immigrants, the timing of end of education and start of first employment matters.
There are huge gender differences regarding first union formation for immigrants from the Maghreb and Sub-Saharan Africa: while women delay first union as compared to natives, men form their first union more rapidly. This difference may be explained by gender differences regarding the selection of immigrants: most women from these origins have already formed a first union before migrating; thus, it is possible that those who were single at migration, i.e., those in our scope, may have characteristics that favor postponement of union formation. Controlling for religiosity, social background (Model 2), and level of education (Model 3) does not alter their relative risk of union formation, although they are closer to natives when education and employment paths are taken into account (Model 4). In particular, adding these variables removes the differences between natives and immigrant women from the Maghreb. Thus, the postponement of partnership formation appears to be linked to longer studies and/or longer entry into stable employment for immigrant women from the Maghreb. For immigrant men from North and Sub-Saharan Africa, the postponement of first union appears to be higher once the timing of schooling and employment is controlled for. For them, this postponement seems to be only weakly linked to entry into stable employment. It may be related to other factors we do not control for, such as taking longer to ask or obtain a family reunification visa for a woman living in the country of origin (Beauchemin, Borrel, and Régnard 2015).
partnership appears to be weakly linked to differences in socio-cultural characteristics.
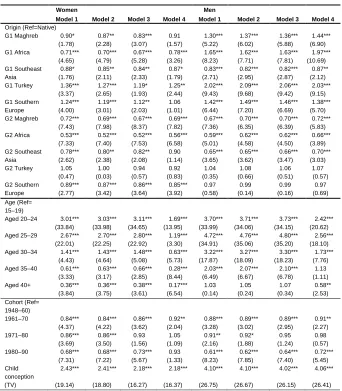
Table 5: Relative risk of first union, by sex
Women Men
Model 1 Model 2 Model 3 Model 4 Model 1 Model 2 Model 3 Model 4
Origin (Ref=Native)
G1 Maghreb 0.90* 0.87** 0.83*** 0.91 1.30*** 1.37*** 1.36*** 1.44***
(1.78) (2.28) (3.07) (1.57) (5.22) (6.02) (5.88) (6.90)
G1 Africa 0.71*** 0.70*** 0.67*** 0.78*** 1.65*** 1.62*** 1.63*** 1.97***
(4.65) (4.79) (5.28) (3.26) (8.23) (7.71) (7.81) (10.69)
G1 Southeast 0.88* 0.85** 0.84** 0.87* 0.83*** 0.82*** 0.82*** 0.87**
Asia (1.76) (2.11) (2.33) (1.79) (2.71) (2.95) (2.87) (2.12)
G1 Turkey 1.36*** 1.27*** 1.19* 1.25** 2.02*** 2.09*** 2.06*** 2.03***
(3.37) (2.65) (1.93) (2.44) (9.43) (9.68) (9.42) (9.15)
G1 Southern 1.24*** 1.19*** 1.12** 1.06 1.42*** 1.49*** 1.46*** 1.38***
Europe (4.00) (3.01) (2.03) (1.01) (6.44) (7.20) (6.69) (5.70)
G2 Maghreb 0.72*** 0.69*** 0.67*** 0.69*** 0.67*** 0.70*** 0.70*** 0.72***
(7.43) (7.98) (8.37) (7.82) (7.36) (6.35) (6.39) (5.83)
G2 Africa 0.53*** 0.52*** 0.52*** 0.56*** 0.59*** 0.62*** 0.62*** 0.66***
(7.33) (7.40) (7.53) (6.58) (5.01) (4.58) (4.50) (3.89)
G2 Southeast 0.78*** 0.80** 0.82** 0.90 0.65*** 0.65*** 0.66*** 0.70***
Asia (2.62) (2.38) (2.08) (1.14) (3.65) (3.62) (3.47) (3.03)
G2 Turkey 1.05 1.00 0.94 0.92 1.04 1.08 1.06 1.07
(0.47) (0.03) (0.57) (0.83) (0.35) (0.66) (0.51) (0.57)
G2 Southern 0.89*** 0.87*** 0.86*** 0.85*** 0.97 0.99 0.99 0.97
Europe (2.77) (3.42) (3.64) (3.92) (0.58) (0.14) (0.16) (0.69)
Age (Ref= 15–19)
Aged 20–24 3.01*** 3.03*** 3.11*** 1.69*** 3.70*** 3.71*** 3.73*** 2.42***
(33.84) (33.98) (34.65) (13.95) (33.99) (34.06) (34.15) (20.62)
Aged 25–29 2.67*** 2.70*** 2.80*** 1.19*** 4.72*** 4.76*** 4.80*** 2.56***
(22.01) (22.25) (22.92) (3.30) (34.91) (35.06) (35.20) (18.10)
Aged 30–34 1.41*** 1.43*** 1.48*** 0.63*** 3.22*** 3.27*** 3.30*** 1.73***
(4.43) (4.64) (5.08) (5.73) (17.87) (18.09) (18.23) (7.76)
Aged 35–40 0.61*** 0.63*** 0.66*** 0.28*** 2.03*** 2.07*** 2.10*** 1.13
(3.33) (3.17) (2.85) (8.44) (6.49) (6.67) (6.78) (1.11)
Aged 40+ 0.36*** 0.36*** 0.38*** 0.17*** 1.03 1.05 1.07 0.58**
(3.84) (3.75) (3.61) (6.54) (0.14) (0.24) (0.34) (2.53)
Cohort (Ref= 1948–60)
1961–70 0.84*** 0.84*** 0.86*** 0.92** 0.88*** 0.89*** 0.89*** 0.91**
(4.37) (4.22) (3.62) (2.04) (3.28) (3.02) (2.95) (2.27)
1971–80 0.86*** 0.86*** 0.93 1.05 0.91** 0.92* 0.95 0.98
(3.69) (3.50) (1.56) (1.09) (2.16) (1.88) (1.24) (0.57)
1980–90 0.68*** 0.68*** 0.73*** 0.93 0.61*** 0.62*** 0.64*** 0.72***
(7.31) (7.22) (5.67) (1.33) (8.23) (7.85) (7.40) (5.45)
Child conception
2.43*** 2.41*** 2.18*** 2.18*** 4.10*** 4.10*** 4.02*** 4.06***
Table 5: (Continued)
Women Men
Model 1 Model 2 Model 3 Model 4 Model 1 Model 2 Model 3 Model 4
Religion (Ref= a little important)
not important 1.04 1.02 1.01 1.01 1.00 0.99
(1.04) (0.43) (0.25) (0.23) (0.13) (0.18)
rather 1.06 1.07* 1.07* 0.99 1.00 1.00
important (1.39) (1.69) (1.75) (0.23) (0.10) (0.00)
very important
1.08* 1.07* 1.07* 0.97 0.97 0.96
(1.92) (1.66) (1.82) (0.75) (0.77) (0.87)
Parents’ occupation (Ref.= Unskilled worker/ employee)
Farmer 1.07 1.09 1.07 1.29*** 1.31*** 1.25***
(0.97) (1.23) (0.95) (4.11) (4.31) (3.63)
Craftsman, 1.07 1.12** 1.15*** 1.32*** 1.35*** 1.39***
shopkeeper (1.48) (2.34) (2.86) (5.67) (6.08) (6.59)
Executive 0.84*** 0.95 1.05 1.20*** 1.27*** 1.35***
(2.97) (0.89) (0.78) (2.82) (3.61) (4.54)
Intermediary 0.94 1.03 1.05 1.14** 1.18*** 1.22***
Prof (1.27) (0.50) (0.86) (2.29) (2.90) (3.57)
Skilled 1.10** 1.11*** 1.12*** 1.14*** 1.15*** 1.15***
worker/ employee
(2.48) (2.83) (3.04) (3.38) (3.48) (3.63)
Education (Ref=Primary)
Professional 0.98 1.06 1.06 1.07*
(0.58) (1.56) (1.58) (1.70)
Secondary 0.81*** 1.07 0.90** 1.07
(4.62) (1.40) (2.20) (1.37)
Tertiary 0.72*** 1.21*** 0.89*** 1.31***
(8.15) (4.21) (2.74) (6.06)
In education 0.34*** 0.48***
(TV) (21.83) (13.15)
Stable 1.37*** 1.44***
employment (TV)
(7.74) (7.70)
N 15,741 15,741 15,741 22,737 16,984 16,984 16,984 24,393
* p<0.1; ** p<0.05; *** p<0.01
Source: Calculations based on Trajectories and Origins survey (TeO), INED-INSEE, 2008
Coverage: Immigrants aged 18–60 who arrived single in metropolitan France, Native French aged 18–60, and descendants of immigrants aged 18–50.
Model 1: controlled for origin, cohort, age, child conception.
Model 2: additionally controlled for social background and religiosity.
Model 3: additionally controlled for educational level.
Model 4: additionally controlled for being in education and in stable employment. Robust z statistics in parentheses
5.2 The type of first union
Country of origin influences union formation, not just in terms of timing, but also in terms of type of union (Table 6). For the native French, nearly three-quarters of first unions start with cohabitation. On the other hand, marrying directly is very common for immigrants from Turkey: about 3 out of 4 first unions start with marriage. More than half the immigrants from the Maghreb also marry directly, this proportion being higher for women. Levels of direct marriage decrease over generations of immigration, especially among those from Southeast Asia, for whom 9 out of 10 first unions start with cohabitation. However, direct marriage remains rather common for second generations from North Africa and Turkey: more than 4 out of 10 first unions start with marriage. Whatever the origin, direct marriage remains more frequent for women than for men, especially for descendants from Sub-Saharan Africa and the Maghreb. More surprisingly, men from the Turkish second generation marry directly more often than women of the same origin.
Table 6: Type of first union, by origin and sex (%)
Men Women
Marriage Cohabitation Marriage Cohabitation
Immigrants
Maghreb 57.2 42.8 65.3 34.7
Sub-Saharan Africa 34.6 65.4 28.3 71.7
Southeast Asia 42.7 57.3 39.5 60.5
Turkey 78.1 21.9 76.7 23.3
Southern Europe 47.0 53.0 49.0 51.0
Immigrants’ descendants
Maghreb 40.8 59.2 54.4 45.6
Sub-Saharan Africa 12.1 87.9 35.1 64.9
Southeast Asia 6.1 93.9 10.0 90.0
Turkey 46.8 53.2 39.7 60.3
Southern Europe 20.4 79.6 25.8 74.1
Natives 25.6 74.4 30.2 69.8
Total 28.6 71.4 33.8 66.2
Source: Calculations based on Trajectories and Origins survey (TeO), INED-INSEE, 2008
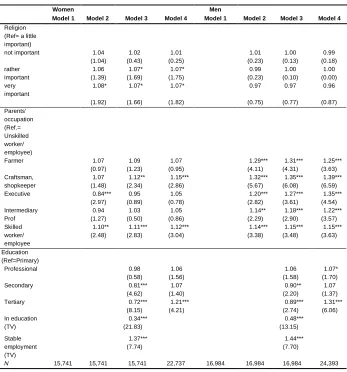
These differences between origins in the mode of partnership formation remain pronounced after controlling for cohort and conception of a child (Tables 7, Model 1). Immigrants (both men and women) are more prone to marry directly, while they are less likely to start living with a partner without being married. Immigrants from Turkey and, to a lesser extent, from North Africa, have a much higher likelihood of marrying directly than native French men and women: conversely, they have a lower risk of cohabitation. In these two groups the risk of direct marriage is very high for men, given that direct marriage is rather rare for native French men. Immigrants from Southeast Asia and Southern Europe also have a higher likelihood of direct marriage, but differences to natives are much smaller. The risk of direct marriage differs by gender for immigrants from Sub-Saharan Africa: it does not significantly differ from native French women but is much higher for men. As stated previously, this difference may come from the selection of single immigrants in these countries. Women from Sub-Saharan Africa (especially those from Central and Guinean Africa who migrate autonomously) are less prone to form a union and to marry directly (Beauchemin, Borrel, and Régnard 2015).
Table 7: Relative risk of direct marriage and of cohabiting union, by sex
Women Men
Model 1 Model 2 Model 3 Model 4 Model 1 Model 2 Model 3 Model 4
Risk of Direct Marriage
G1 Maghreb 2.34*** 1.81*** 1.64*** 1.75*** 3.31*** 2.75*** 2.65*** 2.80***
(10.74) (7.16) (5.97) (6.59) (15.12) (12.16) (11.63) (12.23)
G1 Africa 0.91 0.79* 0.72** 0.82 2.64*** 2.13*** 2.15*** 2.64***
(0.72) (1.75) (2.39) (1.45) (9.10) (6.85) (6.93) (8.64)
G1 Southeast Asia 1.37*** 1.26* 1.20 1.25* 1.64*** 1.46*** 1.41*** 1.50***
(2.64) (1.90) (1.46) (1.84) (4.58) (3.40) (3.09) (3.64)
G1 Turkey 5.20*** 4.15*** 3.62*** 3.69*** 8.19*** 6.62*** 6.13*** 6.17***
(15.05) (12.70) (11.35) (11.41) (21.01) (18.33) (17.30) (17.24)
G1 Southern Europe 1.99*** 1.56*** 1.38*** 1.30*** 2.44*** 2.11*** 1.95*** 1.84***
(8.35) (5.17) (3.78) (3.06) (10.19) (8.34) (7.40) (6.74)
G2 Maghreb 1.90*** 1.54*** 1.50*** 1.53*** 1.55*** 1.40*** 1.36*** 1.41***
(8.94) (5.65) (5.28) (5.62) (4.55) (3.39) (3.08) (3.48)
G2 Africa 0.93 0.81 0.79 0.85 0.96 0.85 0.84 0.92
(0.44) (1.35) (1.51) (1.01) (0.17) (0.74) (0.80) (0.41)
G2 Southeast Asia 0.48*** 0.50** 0.53** 0.59* 0.34*** 0.36** 0.38** 0.40**
(2.70) (2.51) (2.28) (1.90) (2.61) (2.47) (2.33) (2.21)
G2 Turkey 4.61*** 3.67*** 3.25*** 3.18*** 5.15*** 4.12*** 4.00*** 4.13***
(12.68) (10.49) (9.43) (9.26) (10.58) (8.94) (8.75) (8.92)
G2 Southern Europe 0.99 0.93 0.92 0.92 0.76*** 0.73*** 0.72*** 0.70***
(0.07) (0.89) (0.96) (0.99) (2.58) (2.88) (3.01) (3.22)
Risk of cohabiting union
G1 Maghreb 0.40*** 0.45*** 0.45*** 0.50*** 0.68*** 0.82*** 0.83** 0.88*
(9.81) (8.28) (8.40) (7.33) (5.38) (2.60) (2.43) (1.74)
G1 Africa 0.64*** 0.69*** 0.69*** 0.82** 1.34*** 1.48*** 1.52*** 1.82***
(5.21) (4.23) (4.19) (2.22) (3.94) (5.11) (5.38) (7.66)
G1 Southeast Asia 0.70*** 0.71*** 0.71*** 0.73*** 0.59*** 0.61*** 0.63*** 0.65***
(3.65) (3.56) (3.53) (3.23) (5.99) (5.54) (5.24) (4.77)
G1 Turkey 0.33*** 0.35*** 0.35*** 0.37*** 0.57*** 0.67*** 0.70** 0.68***
(5.71) (5.37) (5.39) (5.03) (3.95) (2.72) (2.43) (2.64)
G1 Southern Europe 0.93 1.00 0.98 0.93 1.07 1.24*** 1.24*** 1.17**
(0.89) (0.04) (0.24) (0.91) (0.97) (2.81) (2.80) (2.04)
G2 Maghreb 0.39*** 0.43*** 0.42*** 0.44*** 0.46*** 0.53*** 0.54*** 0.55***
(15.44) (13.34) (13.45) (13.06) (11.55) (9.30) (9.07) (8.70)
G2 Africa 0.40*** 0.45*** 0.45*** 0.48*** 0.48*** 0.55*** 0.57*** 0.60***
(8.66) (7.65) (7.67) (6.85) (6.05) (4.86) (4.70) (4.24)
G2 Southeast Asia 0.78** 0.81** 0.82* 0.90 0.64*** 0.64*** 0.65*** 0.68***
(2.45) (2.03) (1.91) (1.07) (3.56) (3.58) (3.52) (3.16)
G2 Turkey 0.21*** 0.23*** 0.23*** 0.22*** 0.35*** 0.42*** 0.42*** 0.42***
(6.88) (6.37) (6.45) (6.59) (5.19) (4.26) (4.29) (4.32)
G2 Southern Europe 0.83*** 0.83*** 0.83*** 0.81*** 0.97 1.01 1.02 0.99
(4.05) (3.74) (3.92) (4.31) (0.68) (0.24) (0.39) (0.18)
* p<0.1; ** p<0.05; *** p<0.01
Source: Calculations based on Trajectories and Origins survey (TeO), INED-INSEE, 2008
Coverage: Immigrants aged 18–60 who arrived single in metropolitan France, Native French aged 18–60, and descendants of immigrants aged 18–50. Robust z statistics in parentheses. TV: time-varying variable.
Model 1: controlled for origin, cohort, age, child conception. Model 2: additionally controlled for social background and religiosity. Model 3: additionally controlled for educational level.
Taking into account socio-economic and cultural background (Model 2) diminishes the direct marriage gap between immigrants and their descendants versus the native French. Direct marriage appears to be clearly linked with lower social background and greater importance of religion, especially regarding Turkish immigrants and their descendants. Controlling for educational level (Model 3) also decreases the risk of immigrants marrying directly and, to a lesser extent, their descendants; but it does not affect their timing of cohabitation. Conversely, when time-varying variables related to end of schooling and access to stable employment are added (Model 4), the risk of direct marriage increases for immigrants, except for those from Southern Europe. This is a sign that timing of marriage is related to professional integration. However, differences in socio-economic and cultural background and in educational level and employment path do not remove the differences between immigrants, their descendants, and the native French, especially among Turkish immigrants. Controlling for such variables only marginally affects the timing of cohabitation. The likelihood of cohabitation increases slightly for second-generation immigrants once religiosity and social background are controlled for (Model 2), but the gap compared to natives remains.
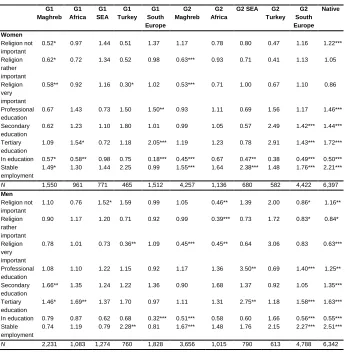
Separate models by origin (Table 8) show that religiosity, educational attainment, and access to stable employment have different effects on the transition to cohabitation according to origin. As expected, religiosity has a significant effect for those from a Muslim culture. Hence, immigrant men and women from Turkey and female immigrants from the Maghreb (for whom religion was important during childhood) have a significantly lower risk of cohabiting. This also holds true for the second generations from the Maghreb. Likewise, the likelihood of cohabitation is higher for male immigrants from Southeast Asia and Southern Europe, and for male descendants of Sub-Saharan Africa with low religiosity.11
11 Low religiosity decreases the risk of both cohabitation and direct marriage (results not shown here and
Table 8: Relative risk of cohabiting union, by origin G1 Maghreb G1 Africa G1 SEA G1 Turkey G1 South Europe G2 Maghreb G2 Africa
G2 SEA G2
Turkey G2 South Europe Native Women Religion not important
0.52* 0.97 1.44 0.51 1.37 1.17 0.78 0.80 0.47 1.16 1.22***
Religion rather important
0.62* 0.72 1.34 0.52 0.98 0.63*** 0.93 0.71 0.41 1.13 1.05
Religion very important
0.58** 0.92 1.16 0.30* 1.02 0.53*** 0.71 1.00 0.67 1.10 0.86
Professional education
0.67 1.43 0.73 1.50 1.50** 0.93 1.11 0.69 1.56 1.17 1.46***
Secondary education
0.62 1.23 1.10 1.80 1.01 0.99 1.05 0.57 2.49 1.42*** 1.44***
Tertiary education
1.09 1.54* 0.72 1.18 2.05*** 1.19 1.23 0.78 2.91 1.43*** 1.72***
In education 0.57* 0.58** 0.98 0.75 0.18*** 0.45*** 0.67 0.47** 0.38 0.49*** 0.50***
Stable employment
1.49* 1.30 1.44 2.25 0.99 1.55*** 1.64 2.38*** 1.48 1.76*** 2.21***
N 1,550 961 771 465 1,512 4,257 1,136 680 582 4,422 6,397
Men
Religion not important
1.10 0.76 1.52* 1.59 0.99 1.05 0.46** 1.39 2.00 0.86* 1.16**
Religion rather important
0.90 1.17 1.20 0.71 0.92 0.99 0.39*** 0.73 1.72 0.83* 0.84*
Religion very important
0.78 1.01 0.73 0.36** 1.09 0.45*** 0.45** 0.64 3.06 0.83 0.63***
Professional education
1.08 1.10 1.22 1.15 0.92 1.17 1.36 3.50** 0.69 1.40*** 1.25**
Secondary education
1.66** 1.35 1.24 1.22 1.36 0.90 1.68 1.37 0.92 1.05 1.35***
Tertiary education
1.46* 1.69** 1.37 1.70 0.97 1.11 1.31 2.75** 1.18 1.58*** 1.63***
In education 0.79 0.87 0.62 0.68 0.32*** 0.51*** 0.58 0.60 1.66 0.56*** 0.55***
Stable employment
0.74 1.19 0.79 2.28** 0.81 1.67*** 1.48 1.76 2.15 2.27*** 2.51***
N 2,231 1,083 1,274 760 1,828 3,656 1,015 790 613 4,788 6,342
* p<0.1; ** p<0.05; *** p<0.01
Controlled for cohort, age, child conception, and social background
This positive but non-significant effect may also be related to the fact that many second generations who are still in tertiary education wait until they have completed their schooling and found a stable job before entering a union. Individuals with higher education may also wait longer before entering a consensual union because their contact with a greater number of potential partners means that they take more time to consider their options before settling down. They may also wait until they have gained some degree of independence from their parents before starting to cohabit, especially if their parents have low economic resources. Access to self-sufficiency through stable employment increases the risk of cohabitation, especially for the second generation. Hence, gaining stable employment significantly increases the risk of entering into cohabitation for second-generation men and women from the Maghreb and Southern Europe, and for female descendants of immigrants from Southeast Asia.
5.3 The transition from cohabitation to marriage
Turkish immigrants not only have a higher propensity to marry directly, but also a higher propensity to marry after having cohabited (Table 9). Transitions from cohabitation to marriage are also significantly higher for immigrants from North Africa compared to the native French. We do not find such an effect for male immigrants from the Maghreb once socio-cultural background is taken into consideration. Immigrant women from Southern Europe also have a higher probability of turning cohabitation into marriage.
Table 9: Relative risk of transition from cohabitation to marriage, by country of origin
Women Men
Model 1 Model 2 Model 3 Model 4 Model 1 Model 2 Model 3 Model 4
G1 Maghreb
1.70*** 1.68*** 1.72*** 1.74*** 1.35** 1.24 1.25 1.29
(3.35) (3.09) (3.13) (3.13) (2.15) (1.38) (1.43) (1.62)
G1 Africa 1.07 1.23 1.27 1.27 1.25 1.06 1.01 1.02
(0.43) (1.21) (1.37) (1.37) (1.51) (0.35) (0.05) (0.14)
G1 Southeast Asia
1.30 1.27 1.29 1.28 1.00 0.91 0.94 0.97
(1.54) (1.36) (1.46) (1.41) (0.00) (0.45) (0.32) (0.16)
G1 Turkey 3.34*** 3.09*** 3.10*** 3.06*** 3.05*** 2.86*** 2.92*** 3.00***
(3.97) (3.48) (3.41) (3.36) (5.09) (4.80) (4.69) (4.80)
G1 Southern
1.37** 1.33** 1.37** 1.39** 1.10 1.06 1.13 1.15
Europe (2.52) (2.09) (2.20) (2.28) (0.74) (0.39) (0.86) (0.93)
G2 Maghreb
0.98 0.95 0.97 0.97 0.90 0.92 0.96 0.98
(0.18) (0.42) (0.29) (0.25) (0.82) (0.64) (0.28) (0.19)
G2 Africa 0.70 0.73 0.73 0.73 1.44 1.36 1.42 1.39
(1.53) (1.33) (1.36) (1.36) (0.83) (0.75) (0.80) (0.77)
G2 Southeast Asia
1.27 1.35 1.36 1.35 1.49** 1.54** 1.47** 1.47**
(0.96) (1.24) (1.28) (1.24) (2.30) (2.41) (2.03) (2.05)
G2 Turkey 0.05*** 0.05*** 0.05*** 0.05*** 0.65 0.54 0.51 0.52
(2.86) (2.78) (2.77) (2.77) (0.91) (1.26) (1.32) (1.30)
G2 Southern
1.03 1.00 1.00 1.00 0.78 0.80 0.82 0.83
Europe (0.24) (0.03) (0.01) (0.01) (1.49) (1.42) (1.31) (1.31)
* p<0.1; ** p<0.05; *** p<0.01
Source: Calculations based on Trajectories and Origins survey (TeO), INED-INSEE, 2008
Coverage: Immigrants aged 18–60 who arrived single in metropolitan France, Native French aged 18–60, and descendants of immigrants aged 18–50.
Model 1: controlled for origin, cohort, duration of cohabitation, age at cohabitation, child conception. Model 2: additionally controlled for social background and religiosity.
Model 3: additionally controlled for educational level.
Model 4: additionally controlled for being in education and in stable employment. Robust z statistics in parentheses
6. Conclusion and discussion
This study has investigated transformations in partnership formation, i.e., the timing and type of first union across generations of immigrants pertaining to the main origin groups in France. It has analyzed men and women separately, using data from the Trajectories and Origin survey. It addressed how the socialization vs. assimilation hypothesis shapes immigrants and their descendants’ first partnership formation patterns, analyzing the interplay of cultural and structural factors by focusing on religiosity, education, and access to employment.
In line with our first hypothesis, we find there are significant differences in partnership trajectories between the first and the second generations. First of all, both male and female second-generation immigrants form their first union later than the first generation. The adaptation process of partnership patterns over generations also manifests with lower levels of direct marriage over generations, while the level of informal cohabitation increases. The development of pre-marital cohabitation over generations of immigration is a sign of more gradual entry into a union and an alternative way of living: descendants of immigrants have more choices than their parents regarding lifestyle and personal arrangements, and they have more freedom to plan their own lives. It also signals a weakening of traditional family behaviors, in particular regarding changes in the conception of pre-marital sex.
related to the high rate of endogamous marriages between second- and first-generation Turkish immigrants (Hamel et al. 2015). In this case, as for immigrants, restrictive immigration policy promotes high rates of direct marriage, given that family reunification is the main legal way for people to move to France.
The institution of marriage also remains important for immigrants from the Maghreb and, to a lesser extent, their descendants. The tempo of change between the first and second generations is, however, more marked for Maghrebis than for Turks. Thus, among those of Muslim descent, there is a higher convergence for the earliest immigration flows. However, to qualify our earlier conclusions, the process of convergence towards French behaviors is also pronounced for some groups whose sending country’s marital norms radically differ from French standards. Children of Southeast Asian and Sub-Saharan African immigrants postpone union formation and have low likelihood of direct marriage.
These cross-origin differences are partly related to socio-cultural background. As expected (hypothesis H2b), low levels of parental socioeconomic status and strong religious commitment are associated with earlier entry into union and more direct marriage. But the introduction of such explanatory factors in the models only slightly reduces origin differences in the propensity for direct marriage and in the timing of first union. Similarly, in spite of the fact that education drives the decline in direct marriage and increase in cohabitation, cross-origin differences in the type of first union are only slightly explained by differences in education level. Increasing level of education does not appear to significantly increase the risk of cohabitation for second generations, which is contrary to our H3 hypothesis. It thus appears that education has less effect on behaviors than on preferences regarding partnership formation (Huschek, Liefbroer and de Valk 2010; Bernardt et al. 2007). Access to self-sufficiency through stable employment also has a positive effect on partnership formation. Nevertheless, taking into account different tempos of access to stable employment does not eliminate the differences across groups, and it does not explain the postponement of first union among the second generation, which was unexpected (H4).
Finally, structural factors like higher level of education have led to changes in partnership formation patterns over generations of immigration, but the convergence is not complete, and cultural factors (i.e., socialization) have a strong effect, especially for women. Wide cross-origin variations were found in the timing of partnership formation, independently of the individuals’ family and socioeconomic background characteristics. The second generation still diverges from the dominant French norm of the unmarried couple by postponing union formation. It appears that practices regarding type of union are not so easy to give up. The postponement of union formation may be related to how immigrants and second-generation immigrants think a union should be, i.e., a long-term engagement rather than a trial period. Changes in behavior take time. It took several generations for cohabitation to diffuse in European countries, and not surprisingly it will take time for immigrants’ descendants to adopt such behavior (Glick et al. 2006).
Given that the population of immigrants under study is selected, we certainly over-estimate the adaptation of partnership behaviors among the immigrants. Individuals who are single upon arriving migrate on their own initiative, either to find work or to pursue their education (Beauchemin, Borrel, and Régnard 2015). They may adapt more readily to the partnership practices of the settlement country. If so, we certainly underestimate the descendants of immigrants’ adaptation by comparing the first and the second generations. To check this selection effect, we ran the same estimations over a sample that includes immigrants who entered a partnership before migration12. The comparison of results confirms our expectations. For female immigrants from Turkey and Sub-Saharan Africa, differences with regard to natives are slightly larger when all immigrants are considered. The effect of selection is higher for men, especially for African immigrants. When all immigrants are considered, male immigrants from Sub-Saharan Africa form their first union later than native French men – but earlier for those who migrate after forming a union. Apart from this case, the selection has little effect and, as expected, when all immigrants are taken into account the adaptation of all immigrants is lower, and that of descendants of immigrants compared to immigrants is higher.
Another limitation of this study is that we do not take into account all structural factors that shape the timing of union formation. In particular, we imperfectly take into account their economic situation, whereas the level of income explains the timing of leaving the parental home and partnership formation (Smock and Manning 1997; Oppenheimer 1988). Local socio-economic conditions must also be taken into account, since living in degraded and segregated areas reduces contact with the mainstream population, and this can also influence partnership
formation. Longer transition to partnership formation may also be related to specific challenges for the second generation: they have to find a partner that suits them and who matches their parents’ aspirations, which may take longer to find. In particular, exogamous unions tend to occur later than endogamous unions (Soehl and Yahirun 2011). Future research should take into account how the dominant norm for endogamous marriage shapes union formation.
7. Acknowledgements
References
Adserà, A. and Ferrer, A. (2014). Immigrants and Demography: Marriage, Divorce, and Fertility. In: Chiswick, B.R. and Miller, P.W. (eds.). Handbook on the Economics of International Migration. Elsevier.
Alba, R. and Nee, V. (2003). Remaking the American mainstream: assimilation and contemporary immigration. Cambridge: Harvard University Press.
doi:10.4159/9780674020115.
Algan, Y., Bisin, A., Manning, A., and Verdier, T. (2012). Cultural Integration of Immigrants in Europe (Studies of Policy Reform). UK: Oxford University Press. doi:10.1093/acprof:oso/9780199660094.001.0001.
Andersson, G. (2004). Childbearing after migration: Fertility patterns of foreign-born women in Sweden. International Migration Review 38(2): 747–774.
doi:10.1111/j.1747-7379.2004.tb00216.x.
Andro, A. (2012). Young People Who Have Not Yet Had Sexual Intercourse: Social Norms and Lack of Opportunity. In: Bajos, N. and Bozon, M. (eds.). Sexuality in France: Gender Practices and Health. The Bardwell Press. Arias, E. (2001). Change in Nuptiality Patterns among Cuban Americans: Evidence
of Cultural and Structural Assimilation?. International Migration Review 35(2): 525–556. doi:10.1111/j.1747-7379.2001.tb00028.x.
Axinn, W.G. and Thornton, A. (1992). The influence of parental resources on the timing of the transition to marriage. Social Science Research 21(3): 261– 285. doi:10.1016/0049-089X(92)90008-5.
Beauchemin, C., Hamel, Ch., and Simon, P. (2010). Trajectories and Origins: Survey on Population Diversity in France. Document de travail de l’Ined. Beauchemin, C., Borrel, C., and Régnard, C. (2015). Le renouveau des migrations
féminines. In: Beauchemin, C., Hamel, Ch., and Simon, P. (eds.). Enquête Trajectoires et origines. Paris: Ined.
Bernhardt, E., Goldscheider, F., Goldscheider, C., and Bjerén, G. (2007). Entering adulthood in Sweden: Gender, family and immigrant origins. Stockholm: Centre for Gender studies Stockholm University.