AND DNA-BASED AMPLIFICATION NETWORKS
by
Herbert M. Huttanus
A thesis
submitted in partial fulfillment of the requirements for the degree of
Master of Science in Materials Science and Engineering Boise State University
DEFENSE COMMITTEE AND FINAL READING APPROVALS
of the thesis submitted by
Herbert M. Huttanus
Thesis Title: Making More Sensitive DNA Sensors Using Gold Nanoparticles and DNA-Based Amplification Networks.
Date of Final Oral Examination: 26 March 2014
The following individuals read and discussed the thesis submitted by student Herbert M. Huttanus and they evaluated his presentation and response to questions during the final oral examination. They found that the student passed the final oral examination.
Jeunghoon Lee, Ph.D. Chair, Supervisory Committee William L. Hughes, Ph.D. Member, Supervisory Committee Bernard Yurke, Ph.D. Member, Supervisory Committee
ABSTRACT
This study focuses on the use of gold nanoparticles with DNA-based signal amplification as a detection method for low concentrations of DNA biomarkers.
Biotechnology is a rapidly evolving field with primarily medical applications. Early detection is a challenging process for some cancers and other diseases yet is so critical to successful treatment. Increasingly sensitive detection techniques are being developed, but the current gold standard for detecting nucleotide biomarkers at low concentrations is polymerase chain reaction. While this technique is sensitive, it requires the use of active enzymes, a thermocycler, and trained personnel working in a clean environment, and is thus not very feasible for diagnosing diseases in remote locations or third world epidemic scenarios. Gold nanoparticles with complimentary DNA probes provide an easy, colorimetric method for detecting a DNA target, but are not very sensitive to sub-nanomolar concentrations without post-hybridization enhancement or sensitive instruments. To overcome this limitation, we employ enzyme-free, DNA-based amplification networks that use cascading hybridization reactions to produce multiple nanoparticle binding events per molecule of target DNA. Our data show that the DNA-based amplification does increase sensitivity of our colorimetric gold nanoparticles without sacrificing their ease of use. We also expand this detection method to other biomolecule of interest, by using an aptamer sequence to bind a small biomolecule and then trigger the DNA-based amplification network.
TABLE OF CONTENTS
ABSTRACT ... iv
LIST OF TABLES ... vii
LIST OF FIGURES ... viii
LIST OF ABBREVIATIONS ... x
CHAPTER ONE: CHALLENGE, TOOLS AND POSSIBILITIES ... 1
Introduction ... 1
What Is the Plasmon?... 2
Plasmon Coupling ... 4
Application of Nanoparticles ... 6
DNA Reaction Networks ... 10
Merging Two Methods ... 19
CHAPTER TWO: DESIGNING, TESTING, AND ANALYZING CASCADING AGGREGATION NETWORKS ... 21
General Approach ... 21
Attachment Procedure ... 21
Design One: Conventional Nanoparticle Control ... 23
Design Two: Two Hairpins ... 25
Design Three: Linker/Target Complex ... 30
Design Four: Linker/Target with Protecting Group... 35
Design Five: Shortening the Bridge ... 38
Maintaining Metastability ... 42
CHAPTER THREE: APTAMER TRANSDUCERS ... 46
Expanding the Candidates for Analytes ... 46
Design Adjustments ... 48
Gel Tests ... 50
Aggregation... 52
CHAPTER FOUR: AN ALTERNATE AMPLIFICATION SCHEME ... 56
Catalytic Hairpin Assembly ... 56
Design One: Attaching Nanoparticles to the Hairpins ... 58
Design Two: 3’ Attachment ... 60
Design Three: Tethered Hairpin 2 ... 63
Future Work ... 67
CHAPTER FIVE: CONCLUSION... 69
A Summary and Perspectives ... 69
APPENDIX A ... 72
Materials and Sequences ... 72
REFERENCES ... 75
LIST OF TABLES
Table 2.1 Inter-particle Spacing ... 40 Table A.1 DNA Sequences Used ... 72
LIST OF FIGURES
Figure 1.1 The Displacement of Nanoparticle Electrons by an Electromagnetic
Field.. ... 4
Figure 1.2 Nanoparticles Coated with Ligands. ... 7
Figure 1.3 Aggregation-Induced Spectrum Shift. ... 8
Figure 1.4 Toehold Mediated Strand Displacement. ... 12
Figure 1.5 Seesaw Switch Mechanism. ... 14
Figure 1.6 Autocatalytic Switch Mechanism. ... 15
Figure 1.7 A DNA Hairpin. ... 16
Figure 1.8 Mechanisms for Hybridization Chain Reaction. ... 17
Figure 1.9 Gel Electrophoresis Analysis of Hybridization Chain Reaction Products... 20
Figure 2.1 Direct Aggregation... 24
Figure 2.2 Mechanism of HCR on Nanoparticles. ... 27
Figure 2.3 Two Hairpin Design Aggregation. ... 29
Figure 2.4 Steric Hindrance Between Nanoparticles. ... 31
Figure 2.5 Catalytic Linker Design. ... 33
Figure 2.6 Protected Linker Design. ... 36
Figure 2.7 Short Linker Results.. ... 41
Figure 3.1 Aptamer Transducer... 48
Figure 3.2 Aptamer Based Mechanism. ... 49
Figure 3.3 Combinatorial DNA Hybridizations. ... 51
Figure 3.4 Aggregation Results for the Aptamer Detection Design.. ... 53
Figure 3.4 Possible Inhibition Mechanism. ... 55
Figure 4.1 CHA Mechanism. ... 57
Figure 4.2 Mechanism for Colorimetric Detection with CHA. ... 59
Figure 4.3 CHA Reaction Products in Gel Electrophoresis. ... 60
Figure 4.4 DNA Crowding on NP Surface... 61
Figure 4.5 CHA Design Two. ... 62
Figure 4.6 Mechanism of the Tethered Design.. ... 64
Figure 4.7 Aggregation Results for Tether CHA Design. ... 66
LIST OF ABBREVIATIONS
Ade Adenosine
Apt Aptamer
CHA Catalytic Hairpin Assembly
DNA Deoxyribo Nucleic Acid
HCR Hybridization Chain Reaction
H,T,L,S Hairpin, Target, Linker or Signal strands respectively LSPR Localized Surface Plasmon Resonance
NP Nanoparticle
PCR Polymerase Chain Reaction
PBS Phosphate Buffered Saline
SDS Sodium Dodecyl Sulfate
SPR Surface Plasmon Resonance
TMSD Toehold Mediated Strand Displacement
Trn Transducer
CHAPTER ONE: CHALLENGE, TOOLS AND POSSIBILITIES
Introduction
There is a growing demand for simple, sensitive, and inexpensive biological assays for detecting low concentrations of clinically relevant molecular markers such as micro RNAs and other nucleic acids [1-3]. Common methods for nucleic acid sensing include using fluorescent dyes and polymerase chain reactions [4, 5]. These common methods require sensitive enzymes or photosensitive dyes as well as expensive laboratory equipment, which is not always available at point of care nor is it field deployable.
Because they are not field deployable, they are not ideal for biomolecule detection at remote locations, such as pathogenic outbreaks in a third world country or field studies of the spread of genetically modified plants [6]. For such applications, a simpler test for the end user would be preferable and would have to meet several criteria. The testing method should be cheap, easy to employ, easy to read, durable, reliable and sensitive. The first three criteria, in particular, are best met by a colorimetric test such as the litmus test or a home pregnancy test. Simple colorimetric detection of many types of analytes can be achieved using gold nanoparticles (NPs) with appropriate functionalization [7-10].
several advantages over alternatives such as fluorescent dyes in that (1) gold NPs have high extinction coefficients relative to organic dyes, which translate to a stronger signal, and (2) their color change can be detected without using external instrumentation. In addition, gold nanoparticles can be used to test for a wide variety of analytes by coating the nanoparticles with appropriate ligands. This study focuses on using DNA probes attached to a nanoparticle surface in order to detect a specific DNA sequence. Understanding the application of gold nanoparticles for diagnostics requires both an understanding and characterization of their unique optical properties.
What Is the Plasmon?
Gold nanoparticles have absorption spectrum very different from that of bulk gold because of surface plasmon resonance. A surface plasmon is a semi-quantized oscillation of a plasma of free electrons [12]. The electron plasma in question is a collection of valence electrons in the gold. These electrons are delocalized and only weakly held by the nuclei of metal atoms. When an electric field is applied to a closed system, the
electrons will shift towards the higher potential. A force is also applied to the nucleus and to the inner shell electrons, but the mass of the nucleus, and the partial charge
cancellation from the inner shell electrons limit displacement. The displacement of the plasma is uniform throughout most of a bulk material but at the material surfaces on the high potential side, electrons accumulate, and the reverse happens on the low potential surface where electron density is reduced. This establishes a dipole [13].
If the electric field is removed, the dipole’s electric field supplies a restoring force that sends the valence electrons back toward the positive pole. This restoring force
Dipole oscillation is quickly dampened in semiconductors, but in metals with high conductivity, the oscillation is preserved. The frequency of the dipole oscillation is largely determined by the material properties, but also by the distance between the poles and thus by nanoparticle size [14].
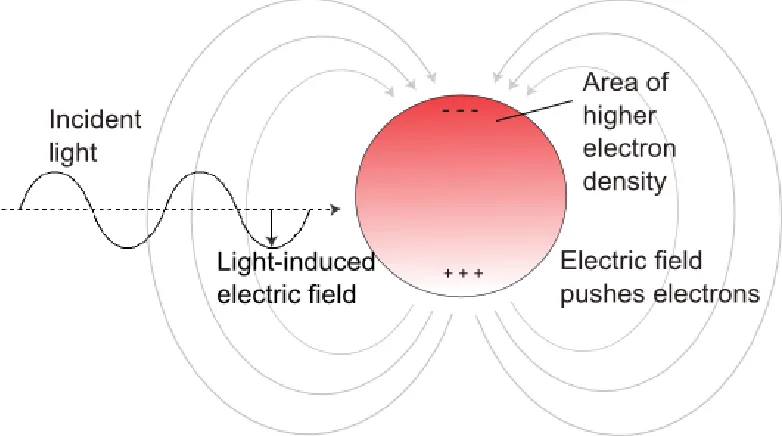
When a sinusoidal electric field is applied (i.e., electromagnetic radiation), it is possible for the external electric field to be either in phase or out of phase with the particle’s intrinsic frequency of dipole oscillation. When the external field oscillates at the right frequency and is in phase with the dipole oscillation, the photon is said to resonate with the particle and is thus absorbed by the metal to establish a plasmon (Fig. 1.1). This dipole description is an oversimplification since quadripole and other high order modes of oscillation have been observed for the bulk valence electrons. The important thing to remember, however, is that the wavelength of light that can be absorbed or scattered by the nanoparticle is dependent on the material properties, size, and the geometry of the plasmonic particle.
The mode most responsible for the color of gold nanoparticles is actually the surface plasmon. Unlike the bulk plasmon described previously, the surface plasmon is a resonance of electric potential across a barrier between substances. In the case of gold nanoparticles, the barrier is the nanoparticle surface where metallic gold and the
Figure 1.1 The Displacement of Nanoparticle Electrons by an Electromagnetic Field. An external electric field can bias the metallic valence electrons towards one end of the nanoparticle, creating a dipole. The energy in a photon's oscillating electric field will be absorbed by the particle if the frequency matches that of the nanoparticle's inherent dipole flipping frequency.
surface, the wave has the opportunity to become a standing wave, should the wavelength of the excitation source match that of the nanoparticle's resonant surface plasmon
wavelength. In such quantized scenarios, the surface plasmon is localized and the oscillation is termed local surface plasmon resonance (LSPR) [16].
Plasmon Coupling
The absorption of light by metallic nanoparticles via LSPR is interesting, but by itself offers little more practical application than rendering a colloidal suspension of metal nanoparticle a different color than the bulk metal. Most of the interesting
Recall that oscillating dipoles are established by the surface plasmon. Since dipoles create an electric field around themselves, then surface plasmons have an
oscillating electric field that could be affecting or affected by the electric fields of nearby surface plasmons [14]. The model needed to describe such interactions will depend on the number of surface plasmon resonances involved. One plasmon is difficult enough to model with the Maxwell equations and two can be much more complicated [17], but three body equations and higher order interactions require a great deal of simplifying assumptions.
While solving the two particle equation is more like solving the one particle equation in many respects, it turns out that the need to do this only arises in very particular applications of nanoparticles, where discrete numbers of particles are being brought together on some engineered nanostructure. The vast majority of nanoparticle applications, however, involve the more random aggregation of nanoparticles, which brings nanoparticles from a dilute solution into dense aggregates either by a chemical change in their stability or by using bridging molecules attached to the particle surface, such as DNA [18, 19]. The shift in state from dilute to aggregated particles drastically changes the degree of particle coupling and the final optical properties of the
nanoparticles. By engineering these solutions to aggregate under a controllable trigger, they can be used as sensors or switch-able optical systems.
exist for the plasmon frequency’s dependence on nanoparticle size and proximity to other particles, but a truly detailed investigation of the resonance models is outside of the scope for this study. The relationship between nanoparticles size and spectrum was taken
instead from empirical data [21] and the degree of plasmonic shift upon coupling was used only qualitatively based on the principals described in this section.
Application of Nanoparticles
Now that we know what surface plasmon resonances are and how they couple, we can use this information to describe their use in a bio-sensing application. Gold
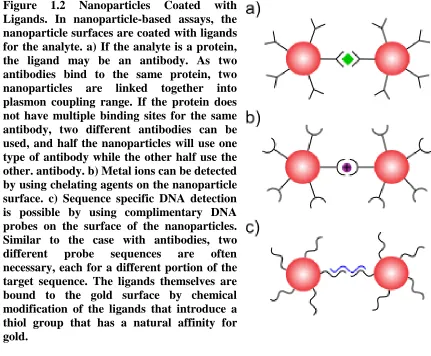
nanoparticles are a popular choice due to their chemical stability and strong extinction coefficient compared to many organic dyes. Gold nanoparticle-based assays work by triggered aggregation. The nanoparticles are coated with ligands for the analyte of interest and, as multiple ligands bind to the same analyte, multiple gold nanoparticles are brought together around the analyte causing plasmon coupling and a visible color change (Figure 1.2). If the target analyte is DNA, the appropriate ligand is a complimentary DNA strand. Such DNA sensors were pioneered by Elghanian et al. [7]. In his seminal design, the probe solution contains a combination of two nanoparticles. Both
Figure 1.2 Nanoparticles Coated with Ligands. In nanoparticle-based assays, the nanoparticle surfaces are coated with ligands for the analyte. a) If the analyte is a protein, the ligand may be an antibody. As two antibodies bind to the same protein, two nanoparticles are linked together into plasmon coupling range. If the protein does not have multiple binding sites for the same antibody, two different antibodies can be used, and half the nanoparticles will use one type of antibody while the other half use the other. antibody. b) Metal ions can be detected by using chelating agents on the nanoparticle surface. c) Sequence specific DNA detection is possible by using complimentary DNA probes on the surface of the nanoparticles. Similar to the case with antibodies, two different probe sequences are often necessary, each for a different portion of the target sequence. The ligands themselves are bound to the gold surface by chemical modification of the ligands that introduce a thiol group that has a natural affinity for gold.
The two different probe strands used are complimentary to a different half of the target DNA sequence. If the target sequence is present in the test, then it will hybridize to both probe sequences by standard Watson-Crick base pairing. Binding the probe strands together means binding two nanoparticles together such that they can couple, provided that the DNA bridge between them is of similar magnitude or smaller than the
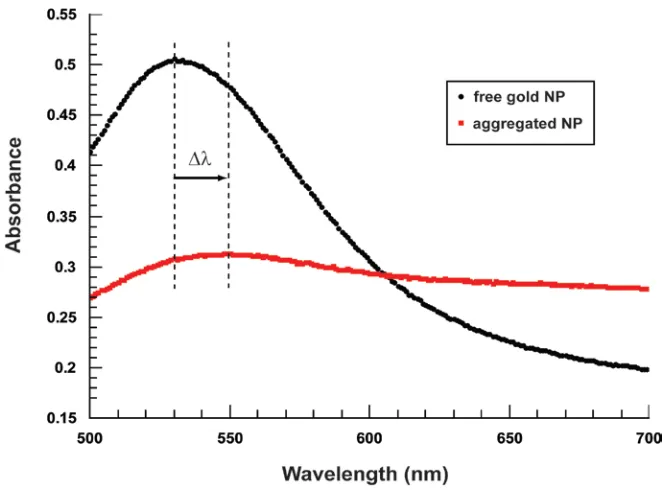
Figure 1.3 Aggregation-Induced Spectrum Shift. As the nanoparticles are brought close together by their mutual hybridization to the same target strand, their plasmons couple and their absorbance spectrum changes in three notable ways. First, the absorbance peak in the visible range shifts towards higher wavelengths since the coupled plasmons have a lower energy oscillation mode. Second, the peak is broadened because there exists a size distribution among the particles, and the opportunity to form different combinations of different sizes provides an even greater range of coupled plasmon frequencies. Finally, the peak is lowered partially due to the broadening and partially due to some aggregates becoming too large to establish plasmons effectively. Any of these three changes can be quantitatively measured as a qualitative metric for extent of aggregation. The combined affect makes the solution's visible color change from red to a more muted purple or blue.
the nanoparticles in order to achieve a reasonable color change. Given this requirement, there may be concern that this would not provide the kind of sensitivity needed to detect the low amounts of DNA that are important in so many clinical scenarios. Ultimately, the detection limit of this method depends on several factors including the size of the
nanoparticle, the affinity of the probe to the analyte, and the degree of plasmon coupling upon binding, which is dependent on the inter-particle distance. Recall, however, that nanoparticles have an extremely high extinction coefficient, and as such can produce a visible color in solution at approximately nM concentrations [12], which would allow for DNA detection at a comparable magnitude.
If, however, the test needed to detect very dilute quantities of nucleic acids that are in the pM range or less, then it would need some way to enhance either the signal coming from the nanoparticle aggregation or the reaction causing nanoparticle
aggregation. Many studies have focused on the former strategy, choosing to increase the intensity of the signal by using sensitive electrosensors or by attaching other reporter molecules to the nanoparticle like fluorophores or catalysts [22-24]. These efforts defeat the original benefit of nanoparticles, which is their innate color intensity and that their color change can be observed without laboratory equipment or extensive procedures. Instead, this study adopts the strategy of enhancing the reaction that causes aggregation. This was achieved by establishing recursive amplification of the basic analyte to
sensitive polymerase enzyme, which again defeats the goal of simplicity. Instead, this study employs enzyme free-DNA reactions, most notably the hybridization chain reaction (HCR) developed by Dirks and Pierce [25]. By incorporating DNA strands capable of undergoing cascading hybridization reactions, multiple NP linkages can be formed from a single target DNA, which can, in turn, lower detection limits compared to conventional colorimetric detection schemes. The next section focuses on the operation of the DNA reaction networks that make this possible.
DNA Reaction Networks
There are many ways to exploit the complimentary hybridization of DNA beyond just storage of genetic information. One of the first, and intuitive, engineered application of DNA was for structural purposes. DNA can be used to create self-assembled, branched structures on the nanoscale including periodic arrays [26, 27]. Such systems are designed by synthesizing short single strands with specific binding domains to other strands. Linkages are formed spontaneously by complimentary hybridization. More tightly folded patterns can produce "DNA origami" of any shape, which is a technique considered for fabrication of nano-scale electronic or optical device scaffolds [28, 29]. For several years, the engineered applications of DNA remained static structures being formed from a pool of components and then resting in a final functional form, but further development yielded dynamic DNA reactions, most of which operate wholly or in part by a process known as toehold-mediated strand displacement [30].
complimentary to the base strand. If the two competing strands have roughly the same degree of thermodynamic complimentarity to the base strand, then either matching is equally favored, resulting in no particular hybridization preferences. This is often the case in genetic recombination events [31]. If, however, the invading strand is more
complimentary, either by having a more correctly matching sequence or by simply being longer and having more complimentary bases than the initial strand, then the
displacement reaction favors the invading strand (Fig 1.4). This can serve as a
programmable driving force for rearranging hybridization partners and thus as a force for detectably changing the state of the system.
It should be noted that the TMSD process does not proceed by complete
spontaneous disassociation of the initial duplex, leaving room for the new hybridization partner. Rather, the invading strand gradually replaces the previous partner base by base in a random branch migration process. The step time for each nucleotide exchange is on the order of milliseconds, so the rate of strand displacement reactions between
oligonucleotides is usually more limited by diffusion and binding to the toehold than it is by branch migration rates [31, 32].
Elwood et al. used untreated soluble analyte to release an immobilized reporter strand and the resulting solution can be easily and sensitively tested for fluorescence. This early technique already possessed the feature of using DNA reactions to switch the chemo-physiological state of the system, but the significance of using DNA's dynamic reaction potential was not immediately realized. This early study presented their mechanism as merely a tricky, indirect form of probing for a DNA sequence.
Eventually, biology offered more inspiration as more active forms of nucleic acids were discovered. Nucleic acids can act directly on compounds in the form of ribozymes [35], or they can interact with each other and regulate activity in the case of siRNAs and riboswitches [36, 37]. It became a regular analogy to describe cellular control
mechanisms as little chemical circuits with feedback controls, and input/output logical components. With this mindset, it's not a far stretch to want to use those simple circuitry elements to build your own circuits for chemical reactions. There are several kinds of logic-performing DNA reaction networks [38-40] and even DNA machines capable of performing mechanical work [41-43], but this study focuses primarily on triggered DNA switches that produce an amplified response. We shall review three examples.
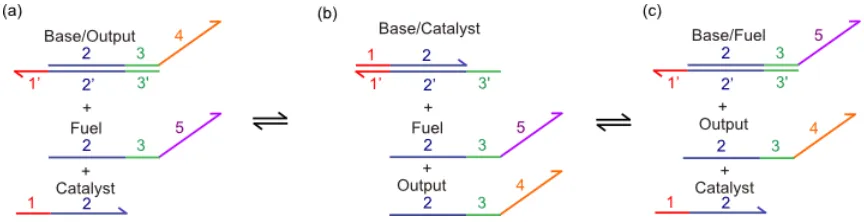
Figure 1.5 Seesaw Switch Mechanism. a) The base/output complex and the fuel strand are metastable in the absence of the catalyst strand. If the catalyst strand is added, it can bind to the base strand and perform TMSD. The toehold hybridizations are transitory and the 2 domain is needed for a more permanent hybridization. Catalyst can displace output strand, but there is no net gain in base pairing once the output strand dissociates, so this step is reversible. b) The removal of the output strand produces an intermediate base/catalyst complex, which has an open 3' toehold that either the fuel strand or output strand can bind to and perform TMSD. c) If the fuel strand invades the base/catalyst complex, it produces a base/fuel complex and regenerates the catalyst. All of these reactions are reversible, so the equilibrium state will have base/output, base/catalyst, and base/fuel in a ratio proportional to the molar ratio between output, catalyst, and fuel strands respectively. Having more fuel than output will favor the production of base/fuel from base/output provided that there is catalyst to form the requisite intermediate. The release of the output strand can then be measured with DNA detection techniques to quantify the amplified response.
allows the system to relax into thermodynamic equilibrium. The release of the output strand is then used as the signal that the reaction has proceeded (Figure 1.5).
which increases the reaction rate as the reaction proceeds. Note also that the reaction is entropically driven by the fact that three species are consumed (the fuel, catalyst, and base/output/catalyst complex), yet four species are produced (output, two catalyst strands, and the base/fuel complex).
The third switch we will examine is the most relevant to our study and, unlike the previous two, is driven by a gain in enthalpy rather than entropy, and this feature will prove useful when attempting to form aggregates of gold NPs. Hybridization Chain Reaction (HCR) is another catalytic switch that requires the addition of a catalyst strand to activate [25]. The HCR system is composed of two hairpin DNA strands, which are kinetically trapped in a metastable state. DNA hairpins are single strands that fold back and hybridize to themselves. The hairpins in this case assume the form shown in Figure 1.7 in that they have a single stranded toehold, a double stranded neck, and a single stranded loop that connects the backbones of the strand segments that are hybridized to each other in the neck region. The HCR system is locked in a metastable state, which means that there exists a lower energy, and thermodynamically preferred state where all the hairpins are hybridized into chains, but the system has a kinetic barrier.
As the name suggests, the HCR system is designed to initiate a recursive hybridization of the metastable hairpins when triggered by the presence of catalytic amounts of the initiator strand. The process, illustrated in Figure 1.8, begins with a solution containing hairpin 1 and hairpin 2. If the initiator strand is added, it binds to the a toehold on hairpin 1 and this anchor mediates strand displacement of the b’ domain from the hairpin, such that, the nucleotides that are paired with the b domain are replaced one by one with the equivalent nucleotides from the initiator strand. Next, the exposed c domain and the displaced b’ domain act similarly to the initiator strand towards hairpin 2. The c domain binds to the c’ on hairpin 2 and this toehold mediates another strand
displacement, which opens up hairpin 2, exposing its loop and a b’. This exposed
sequence is equivalent to the initiator strand, and therefore can bind to and unfold another hairpin 1 strand, thus ensuring the propagation of the cycle.
toehold on hairpin 2 and similarly unfolds that hairpin. When hairpin 2 is unfolded, it exposes a region that is identical in sequence to the target strand and can therefore start another start the cycle again by binding to another hairpin 1.
As an analogy to polymer chemistry, one can view the exposed toehold and b’ region as an active center, which is consumed in each iteration of the cycle but creates a new active center in the next monomer on the growing polymer. The exposed toehold and b’ domain behave in a similar fashion since they constitute a reactive state that gets transferred to each successive hairpin strand in the reaction and enables that strand to perform toehold-mediated strand displacement with the next hairpin strand. The reactive state does not exist in the initial test solution of two hairpins because the hairpins start out in a closed form. The reactive state is introduced in the form of the target strand, which is open and has the exposed toehold and b’ domain. Once introduced, the reactive state can be recursively transferred to the leading end of the polymer of hairpins. Compared to free radical polymerizations, however, HCR does not suffer from a termination analogous to the combination of two radicals, since two b’ sequences cannot hybridize.
Even without fluorophores or other readout strategies, the initiation and
propagation of HCR can be analyzed by gel electrophoresis. As shown in Figure 1.9, the hairpins are stable when mixed together but without any initiator added. When the two hairpins are mixed together, they maintain a state where each hairpin is un-reacted and there is only one size of DNA element present. Once the initiator is added, larger products become evident in the gel as higher bands, and they are produced by chain reaction. The lengths of these DNA multi-mers are inversely proportional to the amount of initiator used, since lower concentrations would cause less initiation sites and
HCR, therefore, does not explicitly need gold nanoparticles in order to be applied for DNA detection, but the technique of gel electrophoresis, while being a fairly simple laboratory technique, is not exactly field deployable. Gold nanoparticles provide a simple readout alternative because a pre-made test solution could be combined with a collected sample, and positive detection could be seen visually as a color change.
Merging Two Methods
CHAPTER TWO: DESIGNING, TESTING, AND ANALYZING CASCADING AGGREGATION NETWORKS
General Approach
Since our goal is to trigger many nanoparticles into aggregating using a small amount of DNA initiator, we chose a DNA amplification network that starts with many isolated strands but collapses into a state with significantly more multi-strand complexes. There are many DNA reaction networks to choose from, but for our first attempt at a catalytic aggregation of gold nanoparticles, we selected Hybridization Chain Reaction (HCR) devised by Dirks and Pierce for its simplicity, stability, and for its formation of long polymers of the DNA reactants [25].
To realize colorimetric HCR tests, we decided to simply attach gold nanoparticles to each of the hairpins, such that polymerization of hairpins would polymerize
nanoparticles into a network that could theoretically accomplish plasmon coupling and result in a color change. To make this strategy work, several design modification had to be made. Each modification was motivated by the performance of the previous design. The subsequent sections in this chapter review those experimental efforts.
Attachment Procedure
thiol-modified synthetic DNA strands [47]. The sulfur in the synthetic DNA's thiol group covalently bonds to gold. Thiolated DNA was purchased from IDT Technologies and gold nanoparticles were synthesized using the sodium citrate method [48]. In brief, a 0.25 mM solution of chloroauric acid was brought to a boil 1 mL of 0.51 mM sodium citrate solution was added and boiling was continued for 10 minutes. The resulting gold colloid was characterized by UV-vis spectrophotometry on a Cary 100 Bio scanning in the wavelength range of 700-400 nm. The size and concentration of the gold nanoparticles was calculated from the absorbance peak and using extinction coefficients and
absorbance peaks for nanoparticles of various sizes found in previous studies [21]. The thiolated DNA strands came with a 6-mecaptohexanol protecting group to be cleaved with a reducing agent prior to incubating with gold nanoparticles. For this we used a 100 mM solution of freshly prepared dithiothreitol (DTT), which was incubated with the DNA for 1 hour. Excess DTT and the protecting alkane thiol were removed by running the DNA solution through a NAP-10 desalting column. The eluate was tested for DNA content using the same spectrophotometer, scanning in the range of 350-200 nm. The DNA concentration was calculated using the strand’s estimated extinction coefficient at 260 nm. Next we took the reduced DNA and mixed it in a 500 to 1 ratio with the gold nanoparticles solution. This solution was then buffered to 10 mM phosphate (pH = 7.4) and 0.01%, by mass, sodium dodecyl sulfate (SDS).
functionalization further by increasing the ionic strength of the solution and decreasing the repulsion between DNA strands [49, 50].
With the salting complete, the particles were then purified three times by
centrifugation to remove excess DNA strands. This was done by spinning the solution at 10,000 rpm for 30 min, removing the clear supernatant, and re-suspending the pelletized NPs in fresh buffer. The particles concentration was again measured by
spectrophotometry, and the particles were then ready for aggregation experiments.
Design One: Conventional Nanoparticle Control
In order to qualify the performance of catalytic aggregation systems, there needs to be a point of reference. For this purpose, a conventional design was used as a
performance standard. The conventional design consists of two nanoparticles with probes complimentary to different halves of the target strand to which they bind and form a single bridge much like in the study by Elghanian (Figure 2.1 a).
For visual simplicity, Figure 2.1 only shows one DNA strand attached to each nanoparticle. A design with just one probe strand per nanoparticle would work if such particles were stable, but you may recall that spherical gold nanoparticles often need many DNA strands in order to infer enough hydrophilicity for the nanoparticles to be stable in solutions of biologically relevant ionic strength. It is difficult to control the exact number of DNA strands attached to the surface of each nanoparticle, but it is often
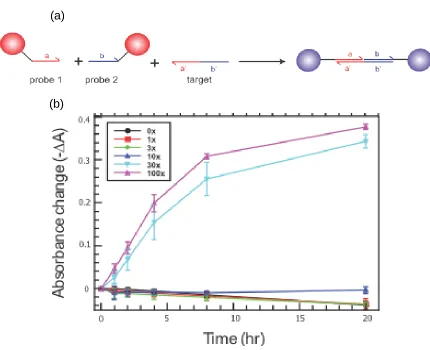
Figure 2.1 Direct Aggregation. a) Two nanoparticle types were used in this assay, each coated with a different DNA probe. The two probes bind to different halves of the target strand through complimentary hybridization. Binding of both NPs to the same target molecule results in a coupling event and thus a color change. b) The absorbance data collected over time. Each data set is a separate reaction. Each reaction contains 1.57 pM of each nanoparticle and the listed multiple of that concentration of target strand. Aggregation is measured as a drop in absorbance (-ΔA). There is a discrete detection limit, where notable aggregation requires that the target concentration be 30 times that of the nanoparticles for good multivalent networking. Some of the reactions triggered with low target concentrations exhibit slightly negative values for –ΔA, potentially due to nanoparticles settling to the bottom of the cuvette, where the detection laser is aimed.
particle [51]. We used an excessive ratio of 500 strands per particles to ensure maximum DNA loading. The exact DNA sequences used for each strand are available in Table A.1 in the appendix.
(a)
A test solution containing the two NPs was subjected to varying concentrations of the target strand to determine a detection limit. The extent of aggregation can be
qualitatively observed with the naked eye, but quantitative study required the use of a spectrophotometer. The test solutions were scanned in a Cary 100 Bio spectrophotometer in the visible spectrum (400-700 nm) both before the introduction of target strand and after an incubation time of 24 hours. The color change manifests in the spectrum as a peak shift, a peak intensity drop and a general broadening of the absorbance peak. The results obtained with this first design can be seen in Figure 2.1 b. Absorbance drop and peak shift were both measured, but only the absorbance drop data is shown because the peak shift values are more variable and become difficult to measure at high degrees of aggregation. The target strand concentrations are listed as multiples of the nanoparticle concentration (157 pM). In order to induce significant aggregation, the target must be present in a concentration that is 30 times that of the nanoparticles. In evaluating the subsequent designs, we used that target/NP ratio (30x) as the detection limit of a direct aggregation design. Also note that aggregation in this design plateaus at about 0.4 A.U. of absorbance drop and it generates up to about 40 nm of peak shift for the 30x and 100x (not shown).
Design Two: Two Hairpins
Our First approach to merge the simple colorimetric readout of gold nanoparticles to the already functioning amplification network of HCR was to simply attach
type on its surface, then each nanoparticle can also act as a bridge between separately nucleated polymers of hairpins, ideally resulting in a branched and tangled aggregation of nanoparticles and DNA.
Figure 2.2 Mechanism of HCR on Nanoparticles. Free target molecule binds to the toehold on hairpin 1, which unfolds the hairpin, allowing its loop domain to bind to a toehold on hairpin 2, which also unfolds. The two nanoparticles are now linked and they have a free tail with the target sequence, which can start another cycle by interacting with another hairpin 1.
fixed, the DNA will not be able to provide enough negative charge to keep the gold particles suspended in salty solutions. Thus we selected nanoparticles of 25 nm in diameter (the same size that was used in the direct aggregation experiment), which we synthesized in our lab using the sodium citrate reduction method described previously.
The functional nanoparticles were produced and a series of aggregation experiments similar to those performed for the direct design, were used to estimate a detection limit. Early attempts showed no signs of any aggregation, and the procedure was modified heavily from that used for the direct aggregation scheme in order to induce aggregation. Due to the modifications used, only the peak shift was measured for this design, not the absorbance drop. The most important modification was the increase in the salt content of the buffer, which was doubled from 0.3M NaCl to 0.6 M. With this
Figure 2.3 Two Hairpin Design Aggregation. Peak shift was measured as increase in peak absorbance wavelength relative to the peak absorbance of the negative control at 0 hours of reaction. The 5x and 25x reactions were considered to have notable aggregation. The 0.2x reaction did not appear to have changed color significantly and the measured peak shift may be an outlier caused by either a scanning error or contamination with the target.
The fact that design 2 required more salt did, however, provide clues to help troubleshoot the design’s limited performance. DNA strands naturally repel each other due to their negative charge. Cations from the buffer help to partially neutralize this charge so that the DNA strands do not repel each other and this process is known as the screening effect [50]. The fact that increased screening helps this reaction proceed implies that it is limited by DNA crowding or even nanoparticle crowding.
are not in the ideal orientation for hybridization because their toeholds are closer to the nanoparticle than the neck and loop regions are. Secondly, the hairpins experience more DNA repulsion as they approach a dense field of hairpins than they would approaching a single hairpin. Finally, and most importantly, the catalytic design must contend with steric hindrance between NPs. The first two NPs that bind together are no more crowded than in the case of direct aggregation, but the third NP must wedge itself between the previous two in order for DNA strands on its surface to hybridize with the growing HCR polymer (Figure 2.4). This was not an issue with the direct aggregation design (design 2) because each new DNA bridge between NPs forms separately and can therefore form where other NPs are not in the way. Our next design sought to partially overcome these crowding effects.
Design Three: Linker/Target Complex
The previous design had issues with DNA crowding that could only be overcome with high salt content. Ideally, the test system operates in buffers of biologically relevant pH and ionic strength so that adding the sample does not interfere with the test reaction. This third design was created with two goals in mind: to fix the crowding issues such that the test can be performed under the same conditions as the direct aggregations design, and to fix the crowding issues so that the test would be even more sensitive.
Figure 2.4 Steric Hindrance Between Nanoparticles. In the catalytic aggregation design (design 2), only two nanoparticles can easily attack to each other per target strand present. The DNA bridge between the nanoparticles has an exposed active sequence that could theoretically bind to a third nanoparticle, but because the DNA strands uses are shorter than the nanoparticle diameter, it is difficult for a third nanoparticle to fit in the inter-particle gap and approach the active sequence at the proper orientation. This flaw in the design doesn't prevent the system from aggregating with sufficient concentrations of the target strand, but it offers no sensitivity advantage over the conventional direct aggregation because it can still only bind two nanoparticles per target strand.
release an active element to trigger the next cycle. This can be achieved by the
Note that the linker strand now has a different orientation with respect to its covalently attached nanoparticle. Whereas hairpin 2 had the spacer and thiol modification on the 3' end of the b domain, the linker strand extends a spacer region from its 5' end. This allows for even more inter-particle distance and allows the particles to bind to each other in the more preferred "tail to tail" fashion [25]. Repositioning the nanoparticle was not necessary for the linker/target adaptation, but was done to help alleviate steric hindrance and is allowed now that there is no longer a loop domain at the 3' end of the b domain.
These design modifications were expected to increase catalytic potential and therefore to increase sensitivity to the target. Once again, the detection limit was
evaluated by subjecting the combined nanoparticles to varied concentrations of the target strand and measuring an absorbance drop, just as design 1 was tested. When thus tested, however, this design was too unstable; to the extent of being self-triggering (Fig. 2.5 b). The negative control solution, which contained nanoparticles with hairpin 1 and
linker/target, respectively, underwent significant aggregation without the introduction of additional target strand. The phrasing "additional target strand" is now necessary since the test solution contains the linker/target complex. One might reasonably ask if there is any excess or residual target strand left over from the production of the nanoparticles coded with linker/target complex.
Figure 2.5 Catalytic Linker Design. a) The test solution in this case contains one nanoparticle type with hairpins attached and one with a linker/target complex attached. The target strand thus already exists in the solution, but is sequestered and not able to initiate the reaction. Reaction mechanism starts when the target strand invades the hairpin. The opened loop domain invades the linker/target complex and displaces the previously sequestered target molecule, which can start the cycle over again. b) The aggregation results of this design exhibit severe instability. Even the negative control (0x target) aggregates rapidly, most likely due to the supposedly sequestered target strand from the linker/target complex.
nanoparticle is completed, excess strands are removed by centrifugation. During each spin, the heavy nanoparticles collect at the bottom of the tube, but unattached DNA
strands remain in solution. After the spin, the majority of the supernatant is removed by pipette with special care not to disturb the viscous, liquid pellet of nanoparticles. This necessitates that a small portion of the supernatant not be removed and thus the purification is not 100% effective. The exact residual volume for each iteration of this purification varied, but was often around 5% or less of the total solution that was centrifuged. Thus we can expect that every repetition of the spinning, removal and re-suspension should effectively remove 95% of the excess DNA strands. By default, each batch of nanoparticles undergoes 3 repetitions of the purification process and should thus achieve a 99.9875% removal of excess strands. Increasing the number of spin cycles to 6 was still not sufficient to prevent self-activation and it is unlikely that further purification would prevent it.
Another possibility for the self-activation is that the linker/target complex, even if present in a perfect 1/1 ratio, can disassociate post-purification, thus releasing the target strand trigger into solution. This is also unlikely based on the thermodynamics of this hybridization. DINAMelt hybridization simulation software estimates the free energy of this complex to be 33.6 kJ/mol, which would make for a disassociation constant on the order of 10-25 [55]. As such, spontaneous disassociation is probably not the culprit.
concealing the toehold in inaccessible loop regions of the hairpins. By effectively cleaving hairpin 2 at its loop region, we inadvertently allowed access to the a' domain. Our next design focuses on remedying this error.
Design Four: Linker/Target with Protecting Group
Our goal with this design was to make the a' domain on the linker/target complex less accessible to hairpin 1 in the un-reacted state, yet still completely accessible once released from the linker strand by an activated hairpin 1. Our strategy was to hybridize part of the a' domain to the linker strand. Specifically, three of the thymines on the 3' end of the b domain were replaced with residues complimentary to a' domain across from them, thus extending the double-stranded region of the linker/target complex. The 3 nucleotides that replaced the thymines are here collectively referred to as the protecting group. The modified linker/target complex is shown in Figure 2.6 a.
This approach has advantages and disadvantages. On one hand, it leaves fewer nucleotides available to be used as a toehold for the premature strand exchange
mechanism, but on the other hand, it hampers the reaction with the target. During the second stage of our aggregation mechanism, the opened hairpin 1 binds to the linker strand via the c domain and proceeds to displace the b' domain of the linker strand. In our previous design, this severs all base pairing between the linker and the target, but in this design, the linker strand is still held by 3 bases. A three-base toehold is far from
Figure 2.6 Protected Linker Design. a) The mechanism is the same as the linker/target design except for the inclusion of an a1 domain on the linker strand, which is only half the length of the a domain. This protecting domain keeps the target strand in the complex from having a full toehold to prematurely interact with hairpin strands. b) The protecting group drastically improved stability. There is still aggregation occurring in the negative control (0x) but it is mild compared to the reactions with moderate levels of target strand added.
gain of 6 base pairs (from the toehold), this modified design has a net gain of only 3 base pairs (gains 6 from the c domain but loses 3 from the protecting group). It may be
somewhat misleading to consider these toeholds in terms of such concrete numbers of (b)
nucleotides. In reality, double-stranded DNA has a certain degree of “breathing” at the ends where the complimentary nucleotides spend some time unhybridized [56]. Because of this, the reduced toehold effectively has more than just three nucleotides for initial binding. We could cover the toehold completely and reduce the false positive reaction considerably, but this would hinder our favorable HCR reaction, so we chose to protect only half of the toehold as a safe middle ground.
Another consequence of the leakage is that it imposes a barrier to lowering the detection limit of our colorimetric test. In the absence of any background aggregation, an arbitrarily small amount of target strand could aggregate every nanoparticle in the
solution if given enough time. In this case, there would be theoretically no detection limit, only a question of how long of a time scale is considered acceptable. With the leakage, however, the analyte concentration must be high enough to produce color
change that is detectibly faster than the rate of leakage. One way to improve the detection limit therefore would be to increase the rate of the desired reaction (open hairpin 1
displacing target on the linker/target complex) relative to the leakage reaction (target strand reacting with hairpin 1 while still attached to linker).
Note that we could theoretically decrease the leakage rate even further by
expanding the protecting group on the linker to include more complimentary bases to the a' domain on the target strand. However, this will also decrease the rate of hairpin 1 displacing the target strand. But as mentioned before, if we made the protecting group hybridize to all 6 bases of a', there would be no thermodynamic advantage for hairpin to displace target. A protecting group of three bases successfully reduced the false positive reaction relative to the activated reaction, but there is still opportunity to try different lengths of protecting group to optimize the reaction rate ratio. Before devoting any more resources to that optimization, our next design priority was to address a more pressing question.
Design Five: Shortening the Bridge
color change as low as 3x target rather than requiring 30x target) but we must be careful drawing conclusions from this comparison. Many of the experimental variables were made equivalent when testing these two designs, such as nanoparticle size, nanoparticle concentrations and target DNA concentrations, but there are several factors either out of our control (with the given procedure) or overlooked that prevent us from definitively declaring an improvement.
First, the average number of DNA strands per particle was not measured for any of the nanoparticles produced. We used what was considered to be an access of DNA for the given surface area of gold based on other studies [27] but the maximum loading may vary in our different designs. The catalytic designs use hairpins or complexes on the nanoparticle surface whereas the conventional strand has linear single-stranded DNA that should theoretically pack more efficiently. A difference in nanoparticle loading would change the effective concentration of reactive DNA elements given the same nanoparticle concentration, which could affect the reaction rates we are trying to compare.
comparing the reaction rates between different detection designs, the target sequence would ideally be the same, but they are not (See Table A.1 in the appendix).
Lastly, the designs cannot be directly compared because the inter-particle distance is not the same. Thus far, the degree of aggregation has been measured indirectly as an absorbance drop, but optical shifts from plasmon coupling are proximity dependent, so the differences in absorbance drop could be attributed to either more linkages being formed or by the particles being closer.
For a better comparison, the next nanoparticle aggregation design uses a
shortened version (nucleotides removed from the sequence) of design 4 (our best catalytic design at that time) to more closely match the spacing in the conventional designs. The spacer regions were reduced by 8 thymines and the b domain in all relevant strands was shortened by the deletion of 6 nucleotides from the center of the domain. The lengths of the inter-particle bridges are shown in Table 2.1. The new design is coined short
linker/target and is, on the domain level, equivalent to the protected linker/target design shown in Figure 2.6 a. Sequence differences (Table A.1).
Table 2.1 Inter-particle Spacing
Design Bridge Length in Nucleotides Estimated Bridge Length in nm
Design 1 48 16
Design 3 72 24
Design 4 75 25
It was expected that bringing the particles closer would increase the optical response given the same aggregation rate, but comparing the data from the last design to this shortened version (Figure 2.6 b and Figure 2.7, respectively), we see relatively similar absorbance drop rates for the higher target concentrations although it should be noted that the peak shift was roughly twice as high at every concentration for design 5 than design 4, which indicates that shortening the bridge has a higher impact on peak shift than it does on absorbance drop. Furthermore, at lower concentrations, the short design performs worse than the previous design in that it required a full 24 hours before the 3x is distinguishable from the leaking negative control. These lower reaction rates
may be due to steric issues around the nanoparticle now that our toeholds are closer to the nanoparticle surface and therefore are theoretically more crowded by their neighboring. strands. The reaction rate may also have been lowered by the closing of the inter-particle distance causing more particle crowding. Despite these limitations, the shortened design is a better comparison to the direct aggregation design, and the lower detection limit observed in the shortened catalytic design supports the claim that nanoparticle-based colorimetric detection can be made more sensitive by incorporating DNA amplification networks, even under spatial engineering constraints. These designs could be further optimized to decrease the rate of the false positive and to increase the rate of the triggered reaction. The next section is concerned with the principals used for optimization, and potential changes to the designs.
Maintaining Metastability
The primary challenge with any DNA-based amplification system is establishing the appropriate level of metastability. There must be a sufficient thermodynamic
advantage to the end state in order to drive the reaction forward, but there must also be sufficient kinetic traps to prevent the transformation into the final state prior to adding the catalyst strand. In the preceding designs, such enthalpic drive was supplied by the
degree of base pairing. Rather, some of the nucleotides of the hairpin are being replaced with those from the target strand. Each step in the mechanism is therefore driven by the toehold hybridization.
The process is thermodynamically spontaneous, but is held in check by the limited availability of the toehold’s compliment on the other strand, which is physically blocked by nature of being in the loop region of the hairpin. This kinetic barrier is sufficient to prevent reaction between the hairpins provided that certain conditions are met. As the length of the loop domain increases, the single-stranded DNA becomes less crowded and strained and more closely resembles a dangling single-stranded end. Increasing the length of the loop region allows for the spontaneous reaction between hairpins and the rate of this spontaneous reaction increases with the size of the loop [57, 58]. For this reason, the loop domain used in the adopted form of HCR and all derivative designs was kept to the optimal length of 6 nucleotides, which literature suggests is not too short to cause excessive physical strain, but is not too long to allow hybridization with the loop region until it is opened [57].
is anticipated that the three-strand exchange would involve invasion via the major groove of B-DNA, which would not permit enough room for an entire double-helix [59]. The four-strand exchange mechanism may therefore require a certain degree of spontaneous strand dissociation, perhaps assisted by the physical strain incurred by binding the toehold in an unfavorable orientation, in order to proceed. With this anchor, the system then relaxes to a lower energy state by exchanging the b’ domain of the hairpin for the b’ domain of the target on the hairpin. In light of this predicted interaction, the design challenge was then to reduce the availability of the a’ domain on the linker/target complex by some other means.
CHAPTER THREE: APTAMER TRANSDUCERS
Expanding the Candidates for Analytes
The previous sections have only addressed using nanoparticle-based assays to detect a nucleic acid target. However, the principal of using gold nanoparticle
aggregation and a DNA reaction network for signal amplification would be valid for a wide variety of analytes as long as there is a way for the analyte to trigger nanoparticle aggregation. The following experiments describe how an aptamer was used to make adenosine a trigger for the nanoparticle-based amplification network.
Aptamers are single-stranded nucleic acids whose sequence is capable of binding to a particular molecule through a complex folding of hydrogen and Van der Waals bonds [60-63]. This behavior is more akin to protein folding and binding sites than the
traditional Watson-Crick base pairing regularly associated with DNA. As such, the exact configuration of binding is difficult to predict, and logically engineering an aptamer sequence for a given analyte is currently prohibitively difficult. Aptamers are instead screened by affinity selection and enrichment from a random pool of sequences. This process is known amongst molecular biologists as SELEX (Systematic Evolution of Ligands by Exponential Enrichment) [64].
synthesizing a given sequence imperfectly. The primer ends were synthesized normally, but each nucleotide to be added to the internal region used a cocktail of nucleotide triphosphates as the reagents, allowing for a controllable “mutation” rate.
This pool of oligonucleotides was run through an ATP-linked agarose column such that those strands capable of binding to ATP stalled longer in the gel. The selected nucleotides were then eluted and amplified by PCR. This selection process was repeated several times. The aptamers created in this study also have a high binding coefficient to ATP derivatives, such as ADP, AMP, and even adenosine. This study is heavily cited and the aptamer sequences have been used in assays for ATP and adenosine for biological applications or simply as a model system for aptamers in general [1, 18, 61, 63, 66].
Such aptamers have already been employed in conjunction with gold nanoparticles to create colorimetric assays for non-nucleic biomolecules [67-69]. However, none of the designs in these previous studies include any means of inherent amplification and therefore can couple, at most, two nanoparticles per aptamer binding event. Furthermore, aptamers have previously been used to trigger catalytic DNA networks, including HCR [25]. Specifically, Dirks and Pierce produced an aptamer construct that undergoes conformational change when binding to the analyte. This
conformational change exposes a region with the HCR initiating sequence (Fig. 3.1). This method used aptamers to trigger HCR, but used high concentrations and gel
Figure 3.1 Aptamer Transducer. The transducer is composed of a hairpin structure and a dangling toehold. It contains an aptamer sequence that takes up the entirety of the tail and part of the neck region. When ATP, or adenosine, starts binding to the aptamer tail, the rest of the aptamer unfolds from the neck to envelop the ATP. This leaves the neck region weak enough to unfold entirely, which exposes the triggering sequence for HCR.
Design Adjustments
Our basic strategy was to use a transducer hairpin similar to Dirk and Pierce's construct in order to initiate our protected linker/target design (design 4 from Chapter 2). Again, the transducer element contains both an aptamer to adenosine and a sequence for triggering the amplification. The transducer is the only element in this system that
contains an aptamer sequence. Previously, we referred to the triggering DNA sequence as the target strand because it was the nucleotide sequence our test was designed to detect, but here our ultimate detection target is adenosine, so we will rename the target strand to signal strand for applications with aptamer. Because the sequence for the aptamer portion of the transducer is determined by the affinity selection and is also partially
complimentary to the initiator sequence, our sequence limitations prevent us from using our previous linker/target amplification design without changing the sequences.
displacing another in a zipper-like fashion. Here we have a small biomolecule with non-Watson-Crick interactions replacing the non-Watson-Crick pairing in the transducer's neck domain. The exact mechanism of this displacement is speculative, but if it is successful, as the study by Dirk and Pierce suggests, it will expose the initiator strand and thus allow adenosine to indirectly trigger the amplification and the subsequent NP aggregation. Having two ways to trigger the reaction allows us to troubleshoot the design more easily by determining whether the amplification network is flawed or the transducer. The overall mechanism for our design is shown in Figure 3.2.
Gel Tests
We decided to try out the new sequences with just the free DNA and no nanoparticles using gel electrophoresis to confirm proper operation of the DNA-level design. The various DNA strands were mixed in several combinations at 1 µM each in reaction buffer (0.3 M NaCL, 10 mM phosphate pH 7.4, 0.1% by mass SDS) and allowed to hybridize for 24 hours (complexes were first annealed at 95°C and cooled for 1 hour). A 3% Agarose gel was made using SB buffer (10 mM NaOH adjusted to a pH of 8.5 using boric acid) and an ethidium bromide concentration of 0.5 µg per mL. After the DNA hybridizations were complete, the samples were mixed with a glycerol and
bromophenol blue loading dye and loaded into gel. The gel was run in SB buffer at 150 V for 25 min.
Figure 3.3 Combinatorial DNA Hybridizations. Each lane contains some combination of the DNA strands hairpin (H), linker/signal (L/S), signal (S), transducer (Trn), and the biomolecule adenosine (Ade). The first three lanes show that the amplification system works as intended when activated by a DNA initiator: the signal strand. Lane 2 serves as a negative control (the un-activated reaction) and Lane 3 represents the positive control (the reaction is activated by the signal strand). Lane 2 shows some evidence of self-triggering in that there appears to be a feint product band matching that of the activated reaction (Lane 3). Lane 4 represents the test system for adenosine, which is stable. Once adenosine is added to the full test system, the reaction proceeds and produces complexes of two sizes. The smaller complex is the H/L/S just as in lane 3, but the larger product is H/L/Trn/Ade, with Trn/Ade taking the place of the S strand. Lanes 6 through 8 are controls to monitor various other possible interactions and smaller steps in the overall mechanism. Note from lane 7 and lane 8 that there are no new bands to indicate the opening of the transducer’s secondary structure. It could be that the binding coefficient is too low to notice, but still enough to trigger HCR, or it could simply be that the electrophoresis buffer and voltage disturbs the transducer/adenosine interaction or that the interaction is transient, allowing the electrophoresis process to separate them. This disturbance would not prevent HCR in the reaction for lane 5 since the components had 24 hours to react prior to being run through the gel.
hybridization between hairpin and linker/target, but is capable of releasing the signal strand for initiating the next cycle of hybridization. To ensure that the larger product was
1 2 3 4 5 6 7 8
Lane 1:H Lane 2: H + L/S Lane 3: H + L/S + S Lane 4: H + L/S + Trn Lane 5: H + L/S + Trn + Ade Lane 6: H + Trn + Ade Lane 7: Trn + Ade Lane 8: Trn
not simply a multimer of transducer strands, a control was included with hairpin, transducer, and adenosine, which would not be able to form the complete complex of hairpin, transducer, linker, and signal (lane 6).
Aggregation
As before, one NP type was coated with hairpin 1 and the other type was coated with a linker/signal complex. Reactions were triggered with varied concentrations and combinations of signal, transducer, and adenosine. The added complexity of this system required the use of more controls. A negative control was used that contains both types of functionalized nanoparticles but was not triggered by either the signal strand or the transducer. A positive control for the amplification network portion consisted of the nanoparticles and a 30x concentration of the signal strand. Another negative control was performed using the nanoparticles and the transducer in the absence of adenosine. The remaining reactions tested the detection limit of the system for adenosine with a fixed transducer concentration of 3μM.
Figure 3.4 Aggregation Results for the Aptamer Detection Design. In each reaction, the two NP concentrations were fixed at 157 pM each, and aggregation was initiated with the listed reagents. This design requires high concentrations of adenosine to trigger aggregation when compared to using the triggering sequence. This may be related to inhibition of the catalytic cycle by the transducer strand. Note that signal-induced aggregation is inhibited by the presence of the transducer.
in NUPACK simulations in an effort to find the mechanism of inhibition, but none of the simulations predicted the transducer to bind with anything other than with hairpin 1 after being opened, as is intended.
Compared to the NP's detection limit for the signal strand (sub-µM range), the detection limit for adenosine is about 30 µM. This decreased sensitivity may be due to a poor binding coefficient of the transducer to the adenosine, as mentioned in the gel discussions above, but there is now evidence of perhaps a different culprit. If the
transducer inhibits the positive control, which consists of the amplification module only, 0 1 2 3 4 5 6 7 8 9 10 9 nM S
9 nM
S, 1
µM
Apt
1 µ
M A
pt, 3 µ
M A
de
1 µ
M A
pt,30
µM
Ade
1 µ
M A
pt, 300 µ
M A
de
1 µ
M A
pt, 3 m
M A
Figure 3.4 Possible Inhibition Mechanism. Each lane contains some combination of the DNA strands Linker (H), signal (S), and transducer (Trn). The "/" indicates species that were thermally annealed to each other. This gel was performed in an effort to discover unintentional hybridizations between the DNA strands in the network. When linker, signal, and transducer were present (Lanes 4 and 5) they exhibited bands that are merely superimposed combinations of the transducer and the linker/signal complex bands. These products were expected. When the linker and transducer were combined in the absence of the signal strand (Lanes 6 and 7), they created a higher band indicating hybridization between linker and transducer. This interaction was not intended.
These optimization experiments are pending, but we have at least proved that the approach of combining an amplification module and an aptamer transducer is valid and can result in detectible responses for the nanoparticle-based colorimetric test.
1 2 3 4 5 6 7 8
Lane 1:Transducer
Lane 2: Linker
Lane 3: Linker/Signal
Lane 4: Linker/Signal + Transducer
Lane 5: Linker/Signal/Transducer
Lane 6: Linker/Transducer
Lane 7: Linker + Transducer
Lane 8: Linker/Signal
CHAPTER FOUR: AN ALTERNATE AMPLIFICATION SCHEME
Catalytic Hairpin Assembly
Many of the difficulties with self-activation seen in Chapter 2 hinge on the presence of the unpurified or self-released catalytic sequence in the test solution. While further modifications to the design or preparation of the nanoparticles might minimize self-activation, the only way to fundamentally solve this problem is to alter the
underlying catalytic DNA network such that it does not contain the entire target sequence in the test solution.
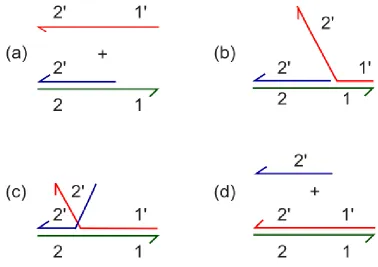
An alternate DNA network for nucleotide detection is Catalytic Hairpin Assembly (CHA) designed by Li et al. [70]. This design also uses two metastable hairpin strands that hybridize together when exposed to a target strand. The primary difference between HCR and CHA is that the second hairpin unfolds towards the existing complex between the first hairpin and the target and actually displaces the target strand, resulting in a hybridization of the two hairpins while releasing the initial target strand (Fig. 4.1). In the original study, the opened hairpin 1 triggers a fluorescence increase, but the fused
Figure 4.1 CHA Mechanism. Catalytic Hairpin Assembly reaction contains a mixture of two hairpins that will dimerize in the presence of a target sequence. The target first binds to Hairpin 1 and undergoes toehold mediated strand displacement to open the hairpin. The exposed region of Hairpin 1 then invades Hairpin 2, which opens and is in the correct orientation to unfurl towards the target, which it competes with and eventually displaces. The target strand is then free to start the cycle again with two more hairpins.