R E S E A R C H
Open Access
Does availability of physical activity and food
outlets differ by race and income? Findings from
an enumeration study in a health disparate
region
Jennie L Hill
1*, Clarice Chau
2, Candice R Luebbering
3, Korine K Kolivras
4and Jamie Zoellner
5Abstract
Background:Low-income, ethnic/racial minorities and rural populations are at increased risk for obesity and related chronic health conditions when compared to white, urban and higher-socio-economic status (SES) peers. Recent systematic reviews highlight the influence of the built environment on obesity, yet very few of these studies consider rural areas or populations. Utilizing a CBPR process, this study advances community-driven causal models to address obesity by exploring the difference in resources for physical activity and food outlets by block group race and income in a small regional city that anchors a rural health disparate region. To guide this inquiry we hypothesized that lower income and racially diverse block groups would have fewer food outlets, including fewer grocery stores and fewer physical activity outlets. We further hypothesized that walkability, as defined by a computed walkability index, would be lower in the lower income block groups.
Methods:Using census data and GIS, base maps of the region were created and block groups categorized by income and race. All food outlets and physical activity resources were enumerated and geocoded and a walkability index computed. Analyses included one-way MANOVA and spatial autocorrelation.
Results:In total, 49 stores, 160 restaurants and 79 physical activity outlets were enumerated. There were no differences in the number of outlets by block group income or race. Further, spatial analyses suggest that the distribution of outlets is dispersed across all block groups.
Conclusions:Under the larger CPBR process, this enumeration study advances the causal models set forth by the community members to address obesity by providing an overview of the food and physical activity environment in this region. This data reflects the food and physical activity resources available to residents in the region and will aid many of the community-academic partners as they pursue intervention strategies targeting obesity.
Keywords:Built environment, Health disparities, Community-based participatory research, Spatial autocorrelation
Background
The prevalence of obesity continues to rise in the United States and is widely recognized as a major public health concern [1]. Low-income, ethnic/racial minorities and rural populations are at increased risk for obesity and related chronic conditions (e.g. diabetes, CVD) when
compared to white, urban and higher-socio-economic status (SES) peers [2-4]. This continued rise in obesity rates and persistent disparities among sub-populations has led to renewed calls for efforts to eliminate dispar-ities and achieve equity in health for all groups [5].
It is increasingly evident that efforts focused on chan-ging individual behavior alone are not enough to reverse the current trends in obesity [6,7]. Recently, terms such as ‘obesogenic’are being used to describe environments in which influences beyond individual behavior are thought to contribute to the rise in obesity [8-10]. Built * Correspondence:[email protected]
1Department of Human Nutrition, Foods and Exercise, Integrated Life Sciences Building 23, Room 1033 (0913), 1981 Kraft Drive, Blacksburg, VA 24061, USA
Full list of author information is available at the end of the article
environments can be defined as the physical or human-made features of a neighborhood, roadways, buildings, food sources and recreation spaces [11,12]. Features of the built environment that facilitate or hinder healthy lifestyles such as physical activity and food choices in-clude land-use, walkability, and available space and resources for activity [13].
In health research, there is a long history and support-ing evidence for the influence of ‘place’ on health [14]. A relevant concept for public health research is that of deprivation amplification. In brief, deprivation amplifica-tion posits that persons who are poor, tend to live in areas that are poor, and are exposed to poor environ-ments that negatively impact health outcomes across the lifespan [14-16]. When applied to the built environment and obesity, deprivation amplification may result in fewer resources such as parks or trails that support physical activity in low-income or racially diverse areas [17-22]. Further, in low-resource areas these facilities may not be safe, may contain poorly maintained equip-ment or amenities or may not be aesthetically appealing for outdoor activity, thereby inhibiting physical activity such as walking or park and trail use [23-27]. In the food environment literature recent reviews find evidence to support a poorer food environment, such as higher con-centration of fast food restaurants and a limited selec-tion of fresh produce in grocery stores and markets in low income areas when compared to higher income areas [28-31].
While there is growing evidence to support the deprivation amplification hypothesis in physical activity resources and food outlets, there is also a great deal of variability across studies [32]. This is highlighted by re-cent systematic reviews of the built environment and obesity, in which the authors conclude that there are few definitive statements to be made when generalizing across studies [9,10,33]. For example, some studies sup-port equal number of resources for physical activity [34] or grocery stores in low-income or black neighborhoods [20] which contrasts other studies that support dep-rivation amplification [29]. Further, the vast majority of these studies occur in large urban environments, par-ticularly those focused on health disparate populations. In fact, in the review by Feng et al., nearly all the studies, 56 out of 63 included studies, focused on large, urban environments [9]. Therefore, much less is known about potential influences that are particular to small cities and towns or rural areas.
Effectively addressing health disparities requires access to vulnerable and often hard to reach populations in rural as well as urban areas. Community Based Participa-tory Research (CBPR) may be an effective approach to reach and address health outcomes in these populations [35-37]. Effective CBPR partnerships leverage the collective
knowledge, expertise, and resources gained through community-academic partnerships to develop and exe-cute culturally-effective interventions, as prioritized by the community [38,39]. A strong community-academic partnership allows for collaborative conceptualization of the project, a mechanism to disseminate results to the community and a forum for feedback from the commu-nity. The inclusion of communities members in built en-vironment assessment research have only recently begun to emerge in the peer-reviewed literature [40], and this study represents one of the first studies to include com-munities in a participatory research structure.
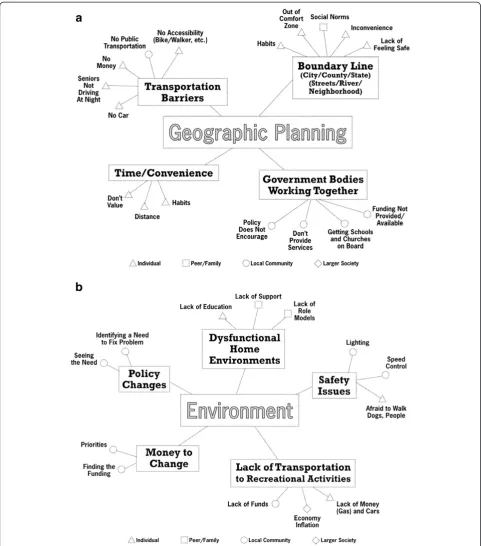
This built environment study emerged from an on-going CBPR partnership in the health disparate Dan River Region of south central Virginia and north central North Carolina [41]. This community-academic partner-ship, formally named the Dan River Partnership for a Healthy Community (DRPHC) initiated in 2009, with a mission to reduce and prevent obesity in the region. In the early stages of this partnership, the community and academic partners hosted a workshop to complete the Comprehensive Participatory Planning and Evaluation (CPPE) process [42,43]. The goal of this workshop was to identify and prioritize obesity and obesity-related causes in the region [41]. The group created 6 causal models for obesity and prioritized immediate action in the form of interventions for 3 causal models (social support for physical activity, nutrition through commu-nity gardens and social marketing). A consistent theme across the causal models was the role of environmental and geographical influences on physical activity and nu-trition in the region. Factors identified by community stakeholders included access to healthy/unhealthy food, lack of places to be physically active and the ability to use non-vehicle modes of transport (e.g. walk or bus) (See Figure 1a, b) [41].
Using the geographic and environmental causal mod-els as a guideline, with input from the DRPHC members, a plan emerged for a series of geographic and built en-vironment assessment efforts to advance the causal models and to provide data to support various intervtion efforts by the DRPHC. Since no comprehensive en-vironmental data was available in the region, the initial step would be to enumerate and geocode the food and physical activity outlets. Following the completion of the enumeration study, phase two would include detailed audits to assess the quality and amenities offered at the outlets. Importantly, under the larger CBPR process, all data collected would be available to the DRPHC mem-bers to support other intervention efforts and shared with the public.
to determine if particular areas and/or populations are indeed at a greater disadvantage when considering ac-cess to these resources. To guide this inquiry we made several hypotheses which were guided by the current lit-erature and informed by the discussions that occurred
outlets, including fewer grocery stores and fewer phys-ical activity outlets. We further hypothesized that walk-ability, as defined by a computed walkability index, would be lower in the lower income block groups.
Methods
Virginia Tech Institutional Review Board has reviewed and approved all study activities.
Study area
The Dan River region is situated in south central Vir-ginia and north central North Carolina and includes Pittsylvania, Henry, and Caswell counties. Historically, this predominately rural area relied largely on agricul-ture, manufacturing, and textile mills for its economic foundation. In recent years, much of the manufacturing and textile jobs have disappeared, creating a dire em-ployment situation with unemem-ployment rates between 12–19% which exceeds the state average and national averages [44]. The city of Danville is the largest city in the region, with a population of about 45,000. Danville is the economic hub of the region, where many of the regions’ services are located (e.g. retail, healthcare, higher education centers). An estimated 20% of the resi-dents in Danville are over the age of 65, 44% are black, and 20% are living below the FPL [45,46]. According to the Virginia Health Equity Report, low socio-economic status (SES), rural, and African American populations in the state consistently experience higher mortality rates and poorer health status across a variety of outcomes (e.g. heart disease, cancer, infant mortality, diabetes mel-litus) when compared to higher SES, urban and non-black Virginians [4,45]. This is one of the most health disparate regions in the Commonwealth [4,45].
Data collection
Census data
Given that the City of Danville is the only regional city; our initial efforts were restricted to within Danville city limits. The 2000 U.S. census divides Danville in 14 cen-sus tracts, and subdivides the tracts into 39 block groups. Socio-demographic and economic characteristics by census tract and block groups were compiled from the 2000 United States Census summary files (SF), in particular, SF1 and SF3 variables. SF1 and SF3 files in-clude variables such as race/ethnicity, the number of female-headed households, education level, and other socio-economic indicators. Census data indicate that the city of Danville is approximately 48% Black and 47% White, therefore race/ethnicities other than black or white were dropped due to empty cells. Given the near even split of race in our study area, we define block group race as predominately Black, predominately White or mixed. After considering the distribution of race
within block groups, we conducted sensitivity analyses to determine the appropriate cut-points to classify the block groups. Block groups with a single race > 55% were classified as predominately Black or White. Block groups with a more equal distribution, >45/<55% were categor-ized as ‘mixed’. Median family income was categorized by deciles. The four lowest deciles for income (1 – 4) were attributed as “low income”, while the four highest deciles (7 – 10) were attributed as “high income”, and the fifth and sixth deciles were attributed as “middle in-come”[47].
Enumeration of food outlets and physical activity resources
To better understand the built environment, a database of food establishments and physical activity resources was created. Retail food outlets and restaurants were identified, enumerated, and classified based on the Nu-trition Environment Measures Survey (NEMS) [48,49]. Lists of city and county food permits were matched against lists of outlets from the City of Danville Office of Economic Development. The establishments on the lists were verified using a variety of sources and methods in-cluding online searches, telephone calls and drive by visualization to ensure that only those still in operation were included. Further, only establishments that were open to the public were included in this study. Stores were classified into two categories (grocery store and convenience store) and restaurants were classified into three categories (fast casual, fast food and sit down) [48,49]. The City of Danville Office of Economic Devel-opment provided initial data on public indoor and out-door recreation sites. Online business directories provided information on private recreation facilities. Addresses for all food and physical activity outlets were geocoded and mapped.
Walkability index
A walkability index was calculated for each block group based on work by Saelens et al. (2003) and Frank et al. (2003) and supported by several empirical studies [12,47,50-54]. This walkability index was well suited for our study as it makes use of publicly available U.S. Cen-sus data and road network files, along with other GIS-based data that is typically available from urban planning or transportation departments, even in smaller munici-palities [12,47]. Further, there are other studies that sup-port the walkability index and its variants based on locally available data [12,50,52-54].
intersections that result from cloverleaf highway inter-sections (interconnecting highway on and off ramps). Residential density is defined as the number of residen-tial buildings per residenresiden-tial acre for a block group [47]. Using available land use data, we calculated the acreage of residentially zoned areas per block group as well as the number of building footprints that fell in these areas to determine residential density. Finally, land use mix consists of a diversity score for the square footage of buildings classified under different uses. The classifica-tions available for land use data in our study area resulted in 4 land use categories: institutional, office, residential and retail/commercial [12,47,54]. Land use data are used to classify building footprints into their respective cat-egories. We then calculated the square footage of build-ings and summarize them by land use category to generate the land use mix score for each block group using this equation:
Land use mix¼1 ðOffice sq:ft:=Total sq:ft:Þ2þ
Institutional sq:ft:=Total sq:ft:
ð Þ2þ
Residential sq:ft:=Total sq:ft:
ð Þ2
All component values (intersection density, residential density, and land use mix) are converted to z-scores be-fore calculating the walkability index for each block group with the formula from Frank et al [47].
Walkability Index¼ð2intersection densityÞþ
residential densityþland use mix
Following the work of Frank et al. [12,47], we devel-oped a geographic information system (GIS) to calculate a walkability index as a continuous score by census block group for our study area. Data layers used for the walkability index calculation include: census block groups, road network, land use, and building footprints. All data are available through either the US Census Bur-eau website (www.census.gov) or the city of Danville website (www.danville-va.gov).
Analyses
Statistical analyses were performed using SPSS 18.0™ ArcGIS 9.3™and GeoDa [55] software. A one-way multi-variate analysis of variance (MANOVA) was used to de-termine if there was a significant difference in the number of food establishments, PA outlets, and walk-ability by block group of low, middle, and high socioeco-nomic status. Subsequently, Cohen’s d was calculated to evaluate the effects sizes between block groups.
In addition to testing for differences in absolute num-bers, we conducted a spatial analysis to determine
patterning among block groups. Spatial autocorrelation describes the distribution of a variable, or the distribu-tion of the reladistribu-tionship between two variables, over space. The pattern of a variable can be clustered, where high (low) values occur near other high (low) values, or dispersed where high (low) values occur near low (high) values, or the pattern could be random [56]. To deter-mine if the spatial patterns of each variable were clus-tered, we measured the spatial autocorrelation using GeoDa software for walkability, income, fast food outlets per acre (FF/acre), grocery stores per acre (GS/acre), convenience stores per acre (CS/acre), and the percent of block group devoted to parks (% parks). To compare the level of a variable in one block group to that of the second variable in neighboring block groups we con-ducted a bivariate analysis. This analysis determines if the spatial patterns are clustered, dispersed or random between income and FF/acre, GS/acre, CS/acre, and% parks [57]. For example, the bivariate analysis deter-mines if block groups with high income are next to block groups with a high or low number of fast food outlets per acre. To determine the statistical significance of each Moran’s I calculation, GeoDa calculates a pseudo p-value based on different permutations of a dataset [57]. We ran a series of 999 different permutations with randomized versions of our dataset, and if the Moran’s I for our observed dataset was higher than the rando-mized Moran’s I calculations 95% of the time, the Mor-an’s I is considered to be statistically significant (α= 0.05) according to the calculated pseudo p-value [57].
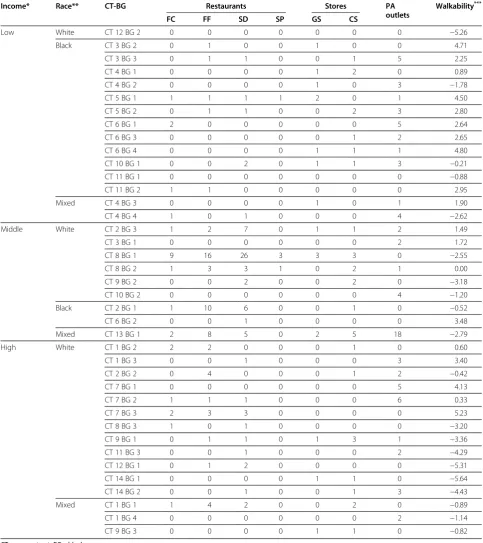
Results Enumeration
Table 1 Enumerated resources by block group
Income* Race** CT-BG Restaurants Stores PA
outlets
Walkability***
FC FF SD SP GS CS
Low White CT 12 BG 2 0 0 0 0 0 0 0 −5.26
Black CT 3 BG 2 0 1 0 0 1 0 0 4.71
CT 3 BG 3 0 1 1 0 0 1 5 2.25
CT 4 BG 1 0 0 0 0 1 2 0 0.89
CT 4 BG 2 0 0 0 0 1 0 3 −1.78
CT 5 BG 1 1 1 1 1 2 0 1 4.50
CT 5 BG 2 0 1 1 0 0 2 3 2.80
CT 6 BG 1 2 0 0 0 0 0 5 2.64
CT 6 BG 3 0 0 0 0 0 1 2 2.65
CT 6 BG 4 0 0 0 0 1 1 1 4.80
CT 10 BG 1 0 0 2 0 1 1 3 −0.21
CT 11 BG 1 0 0 0 0 0 0 0 −0.88
CT 11 BG 2 1 1 0 0 0 0 0 2.95
Mixed CT 4 BG 3 0 0 0 0 1 0 1 1.90
CT 4 BG 4 1 0 1 0 0 0 4 −2.62
Middle White CT 2 BG 3 1 2 7 0 1 1 2 1.49
CT 3 BG 1 0 0 0 0 0 0 2 1.72
CT 8 BG 1 9 16 26 3 3 3 0 −2.55
CT 8 BG 2 1 3 3 1 0 2 1 0.00
CT 9 BG 2 0 0 2 0 0 2 0 −3.18
CT 10 BG 2 0 0 0 0 0 0 4 −1.20
Black CT 2 BG 1 1 10 6 0 0 1 0 −0.52
CT 6 BG 2 0 0 1 0 0 0 0 3.48
Mixed CT 13 BG 1 2 8 5 0 2 5 18 −2.79
High White CT 1 BG 2 2 2 0 0 0 1 0 0.60
CT 1 BG 3 0 0 1 0 0 0 3 3.40
CT 2 BG 2 0 4 0 0 0 1 2 −0.42
CT 7 BG 1 0 0 0 0 0 0 5 4.13
CT 7 BG 2 1 1 1 0 0 0 6 0.33
CT 7 BG 3 2 3 3 0 0 0 0 5.23
CT 8 BG 3 1 0 1 0 0 0 0 −3.20
CT 9 BG 1 0 1 1 0 1 3 1 −3.36
CT 11 BG 3 0 0 1 0 0 0 2 −4.29
CT 12 BG 1 0 1 2 0 0 0 0 −5.31
CT 14 BG 1 0 0 0 0 1 1 0 −5.64
CT 14 BG 2 0 0 1 0 0 1 3 −4.43
Mixed CT 1 BG 1 1 4 2 0 0 2 0 −0.89
CT 1 BG 4 0 0 0 0 0 0 2 −1.14
CT 9 BG 3 0 0 0 0 1 1 0 −0.82
CT = census tract; BG = block group.
*Income: Income was categorized into deciles with the four lowest deciles (1–4) categorized as“Low”, the middle two deciles (5–6) categorized as“Middle”, and the highest four deciles (7–10) categorized as High”.
**Race: Race was categorized by the dominant race for the block group. Any block group with a race >55% was classified based on that race. Any block group with a 45–55% race was classified as“Mixed”.
based on racial composition of block groups (e.g. pre-dominately white, prepre-dominately black, or mixed race; data not shown).
Spatial analyses
The univariate spatial autocorrelation analysis indicated that the spatial pattern of three variables, walkability, in-come, and the percentage of convenience stores per acres are statistically significant (Table 3). Since the Moran’s I value is positive in each case, a clustered spatial pattern of each variable is suggested by the ana-lysis, where block groups with high walkability, income, and percentage of convenience stores per acre are clus-tered near other block groups with high values of those variables.
According to the bivariate spatial autocorrelation ana-lysis (Table 4), the relationship between income and two
variables, percentage of grocery stores per acre and per-centage of convenience stores per acre, in neighboring block groups has a statistically significant spatial pattern. Moran’s I in both cases is negative, suggesting that the spatial pattern is dispersed. Block groups with high incomes are next to block groups with a low percentage of grocery stores per acre and a low percentage of con-venience stores per acre.
Discussion
While there is growing evidence that living in disadvan-taged areas is associated with environments that include reduced access to healthful and affordable food and places to be physically active [8,32,58,59], recent reviews also point out that there is variability across studies which limits the extent to which definitive conclusions may be drawn [9,10,33]. Supporting deprivation amplifi-cation in food environments, Morland and colleagues [60,61] found that low income and racially diverse neighborhoods have lower quality and higher priced pro-duce. Other research demonstrates increased density of fast food outlets and higher availability of poor food choices (e.g. fast food) in low income areas [28,62,63]. However, we did not find differences in resource avail-ability for food outlets by block group income. Based on the analyses conducted here, the number of outlets is equally distributed between high and low income block groups. While we found no differences in the absolute number of food outlets between the block groups, there could be variability in the quality and price of food options available to residents.
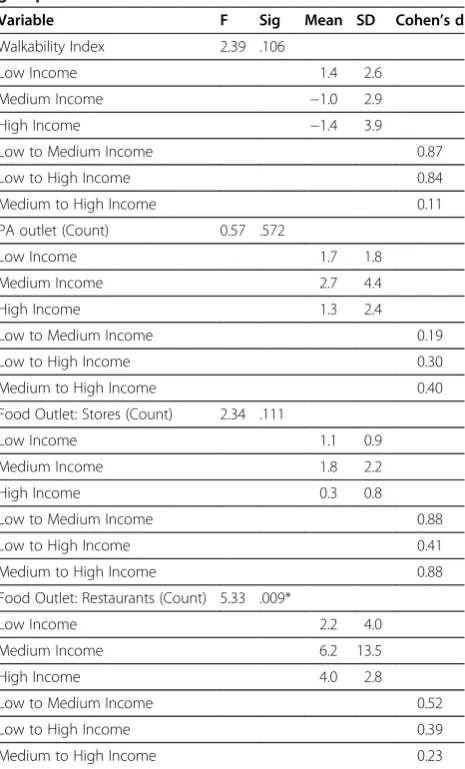
Table 2 Results from MANOVA and effect sizes by block group income
Variable F Sig Mean SD Cohen’s d
Walkability Index 2.39 .106
Low Income 1.4 2.6
Medium Income −1.0 2.9
High Income −1.4 3.9
Low to Medium Income 0.87
Low to High Income 0.84
Medium to High Income 0.11
PA outlet (Count) 0.57 .572
Low Income 1.7 1.8
Medium Income 2.7 4.4
High Income 1.3 2.4
Low to Medium Income 0.19
Low to High Income 0.30
Medium to High Income 0.40
Food Outlet: Stores (Count) 2.34 .111
Low Income 1.1 0.9
Medium Income 1.8 2.2
High Income 0.3 0.8
Low to Medium Income 0.88
Low to High Income 0.41
Medium to High Income 0.88
Food Outlet: Restaurants (Count) 5.33 .009*
Low Income 2.2 4.0
Medium Income 6.2 13.5
High Income 4.0 2.8
Low to Medium Income 0.52
Low to High Income 0.39
Medium to High Income 0.23
*While the MANOVA is significant for this variable, the post-hoc tests were not significant based on Levene’s test for equality of variance.
Table 3 Results of the univariate spatial autocorrelation analysis,italics= statistically significant (α= 0.05)
Variable* Moran’s I Pseudo p-value
Walkability 0.50 0.001
Income 0.21 0.010-0.017
Fast Food per acre 0.11 0.067-0.082
Grocery Stores per acre −0.04 0.459-0.488
Convenience Store per acre 0.19 0.014-0.023
% parks −0.03 0.519-0.564
*% parks = percent of block group devoted to parks.
Table 4 Results of the bivariate spatial autocorrelation analysis, comparing each variable with income,
italics= statistically significant (α= 0.05)
Variable* Moran’s I Pseudo p-value
Fast Food per acre and income 0.08 0.101-0.137
Grocery Store per acre and income −0.19 0.001-0.003
Convenience Store per acre and income −0.23 0.002-0.007
% parks and income 0.08 0.080-0.108
Similarly, many research studies find support for deprivation amplification related to physical activity resources such that fewer physical activity resources exist in low-income minority communities [8,17,34,59,64]. When considering outlets and opportunities for physical activity, we again found no statistically significant differ-ences in the number available to residents. Estabrooks et al. (2003) found that although the number of facilities was equal, there were fewer low-cost or free resources available in low income areas [34]. Therefore, it may be important to determine if the resources for physical ac-tivity in these block groups are equitable in terms of cost and services offered. Additionally, there may be issues related to safety and aesthetics of a space that reduce the likelihood of outdoor activity [13,22,31,59,65-67]. Moore and colleagues [20] found that outside, public areas con-ducive to physical activity (e.g. parks and trails) are of lower quality, lower perceived safety, broken or inad-equate equipment in low income areas [20]. Assessing the quality, condition, safety and general amenities of public parks and trail systems available to residents would be important as well to determine if resources are equitably dispersed. Safety and aesthetics are key deter-minants for walking behavior and assessing this could provide information for potential strategies to increase walking for fitness, transportation and on short trips.
It is important to note the limitations of this study. This is a small regional city set in a rural health dispar-ate region; therefore, the results found here may not be generalizable to other areas. The fact that we find no dif-ferences between block groups could be due to statistical power as there are only 39 block groups in the city. However, this analysis includes all available block groups and all available outlets within the city, not a sample; therefore it represents what is truly available to the resi-dents. Given that fewer studies in the built environment literature are focused in rural environments [9], our methods may be important for other researchers consi-dering rural populations or small to mid-size cities. For the outlets identified in this study, systematic audits to assess features such as quality and prices are currently underway. Further, efforts to enumerate food outlets and physical activity resources in the outlying counties and smaller towns in the region will begin in early 2012, im-portantly allowing us to explore possible differences between residents of Danville and those in the outlying rural areas. Since our work occurs under a larger CBPR process, this enumeration study represents a critical first phase in building a contextual overview to support on-going efforts to reduce obesity by the DRPHC. To honor the CBPR process, a subcommittee of the DRPHC will be established to assist in deter-mining additional avenues for dissemination of these findings to the region and to determine the overall
utility of the data. It is anticipated that the results from this and future geographic and built environment studies in the region will assist the DRPHC in engaging local planning officials to inform policy decisions to positively impact health of all residents in the region.
Conclusions
As the body of literature on obesogenic environments continues to evolve there is not a‘typical’profile that fits all low-income or health disparate populations. Further, conclusions differ across settings, populations and beha-viors (e.g. physical activity or food environments). Therefore, efforts to understand and explore the poten-tial influence of the built environment on food availabil-ity and choice or physical activavailabil-ity in a given population need to be locally generated. While this smaller lens is not typical for public health, it allows for the creation of a contextual reality regarding food and physical activity environments that is relevant to the population under study. Other community coalitions could consider start-ing with a similar enumeration approach, as this type of contextual information can inform local stakeholders, policy makers and residents to determine next steps as well as which types of interventions may be most effect-ive in their region. Under the larger CBPR process, this enumeration study advances the causal models set forth by community members to address obesity by providing an overview of the food and physical activity environ-ment in the Dan River Region. This will aid many community-academic partners as they pursue interven-tion strategies targeting obesity. In light of the CBPR process, the lack of statistical significance of these find-ings is really a moot point. This data reflects the context of available resources from which to plan and implement future health promotion activities in the region for this group of community stakeholders.
Competing interests
The authors declare that they have no competing interests.
Authors’contributions
JH, KK and JZ conceptualized and drafted the paper. Each author contributed to further development and revisions of the paper, and approved the final submission. Each author assumed a unique role in execution of this research including: JH and JZ secured grant funding for the project and conceptualized the study design; CL and CC each participated in data acquisition and analysis; KK and CL provide GIS and spatial expertise; CC provided project and data management support. All authors read and approved the final manuscript.
Acknowledgements
Author details
1
Department of Human Nutrition, Foods and Exercise, Integrated Life Sciences Building 23, Room 1033 (0913), 1981 Kraft Drive, Blacksburg, VA 24061, USA.2Department of Human Nutrition, Foods and Exercise, Integrated Life Sciences Building 23 (0913), 1981 Kraft Drive, Blacksburg, VA 24061, USA. 3
Department of Geography, 115 Major Williams Hall, Blacksburg, VA 24061, USA.4Department of Geography, 123 Major Williams Hall, Blacksburg, VA 24061, USA.5Department of Human Nutrition, Foods and Exercise, Integrated Life Sciences Building 23, Room 1034 (0913), 1981 Kraft Drive, Blacksburg, VA 24061, USA.
Received: 4 February 2012 Accepted: 30 August 2012 Published: 6 September 2012
References
1. Flegal KM, Carroll MD, Ogden CL, Curtin LR:Prevalence and trends in obesity among US adults, 1999–2008.J Am Med Assoc2010,303:235–241. 2. Cooper R, Cutler J, Desvigne-Nickens P, Fortmann SP, Friedman L, Havlik R,
Hogelin JM, McGovern P, Morosco G, Mosca L, Pearson T, Stamler J, Stryer D, Thom T:Trends and disparities in coronary heart disease, stroke, and other cardiovascular diseases in the United States: findings of the National Conference on Cardiovascular Disease Prevention.Circulation 2000,102:3137–3147.
3. Wang Y, Beydoun MA:The obesity epidemic in the United States— gender, age, socioeconomic, racial/ethnic, and geographic characteristics: a systematic review and meta-regression analysis. Epidemiol Rev2007,2007(29):6–28.
4. Woolf SH, Jones RM, Johnson RE, Phillips RL Jr, Oliver MN, Bazemore A: Avertable deaths associated with household income in Virginia.Am J Public Health2010,100:750–755.
5. Healthy People 2020.http://www.healthypeople.gov/2020/default.aspx. 6. Stokols D:Translating social ecological theory into guidlelines for
community health promotion.Am J Health Prom1996,10:282–298. 7. Sallis JF, Owen N:Ecological models of health behavior. InHealth Behavior
and Health Education: Theory, Research and Practice 3rdedition. Edited by
Glanz K, Rimer BK, Lewis FM. San Francisco: Jossey-Bass; 2002:462–484. 8. Booth KM, Pinkston MM, Poston WS:Obesity and the built environment.
J Am Diet Assoc2005,105:S110–S117.
9. Feng J, Glass TA, Curriero FC, Stewart WF, Schwartz BS:The built environment and obesity: a systematic review of the epidemiologic evidence.Health Place2010,16:175–190.
10. Leal C, Chaix B:The influence of geographic life environments on cardiometabolic risk factors: a systematic review, a methodological assessment and a research agenda.Obes Rev2011,12:217–230. 11. Handy SL, Boarnet MG, Ewing R, Killingsworth RE:How the built
environment affects physical activity: view from urban planning.Am J Prev Med2002,23:64–73.
12. Frank LD, Schmid TL, Sallis JF, Chapman J, Saelens BE:Linking objectively measured physical activity with objectively measured urban form: findings from SMARTRAQ.Am J Prev Med2005,28:117–125.
13. Brownson RC, Hoehner CM, Day K, Forsyth A, Sallis JF:Measuring the built environment for physical activity: state of the science.Am J Prev Med 2009,36:S99–S123.
14. Kawachi I, Berkman L:Neighbourhoods and Health. Oxford: Oxford University Press; 2003.
15. Kawachi I:Income inequality and health. InSocial Epidemiology. Edited by Berkman LF, Kawachi I. New York: Oxford University Press; 2000:76–94. 16. Macintyre S, Ellaway A:Neighborhoods and health: An overview. In
Neighbourhoods and Health. Edited by Kawachi I, Berkman LF. New York: Oxford University Press; 2003:20–44.
17. Gordon-Larsen P, Nelson MC, Page P, Popkin BM:Inequality in the built environment underlies key health disparities in physical activity and obesity.Pediatrics2006,117:417–424.
18. Powell LM, Slater S, Chaloupka FJ, Harper D:Availability of physical activity-related facilities and neighborhood demographics and socioeconomic characteristics: a national study.Am J Public Health2006, 96:1676–1680.
19. Taylor WC, Floyd MF, Whitt-Glover MC, Brooks J:Environmental justice: a framework for collaboration between the public health and parks and recreation fields to study disparities in physical activity.J Phys Act Health 2007,4:50–63.
20. Moore LV, Diez-Roux AV, Evenson KR, McGinn AP, Brines SJ:Availability of recreational resources in minority and low socioeconomic status areas. Am J Prev Med2008,34:16–22.
21. Abercrombie LC, Sallis JF, Conway TL, Frank LD, Saelens BE, Chapman JE: Income and racial disparities in access to public parks and private recreation facilities.Am J Prev Med2008,34:9–15.
22. Floyd MF, Spengler JO, Maddock JE, Gobster PH, Suau L:Environmental and social correlates of physical activity in neighborhood parks: an observational study in Tampa and Chicago.Leisure Sci2008, 30:360–375.
23. Kaczynski AT, Henderson KA:Environmental correlates of physical activity: a review of evidence about parks and recreation.Leisure Sci2007, 29:315–354.
24. Giles-Corti B, Donovan RJ:Relative influences of individual, social environmental, and physical environmental correlates of walking.Am J Public Health2003,93:583–1589.
25. Brownson RC, Baker EA, Housemann RA, Brennan LK, Bacak SJ:
Environmental and policy determinants of physical activity in the United States.Am J Public Health2001,91:1995–2003.
26. Lee RE, Cubbin C, Winkleby M:Contribution of neighbourhood socioeconomic status and physical activity resources to physical activity among women.J Epid Comm Health2007,61:882–890.
27. Nasar JL:Asesssing percetions of envrionmnets for active living.Am J Prev Med2008,34:357–363.
28. Raja S, Ma CX, Yadav P:Beyond food deserts - measuring and mapping racial disparities in neighborhood food environments.J Plan Educ Res 2008,27:469–482.
29. Franco M, Diez-Roux AV, Nettleton JA, Lazo M, Brancati F, Caballero B, Glass T, Moore LV:Availability of healthy foods and dietary patterns: the Multi-Ethnic Study of Atherosclerosis.Am J Clin Nutr2009, 89:897–904.
30. Larson NI, Story MT, Nelson MC:Neighborhood environments: disparities in access to healthy foods in the U.S.Am J Prev Med2009, 36:74–81.
31. Sallis JF, Saelens BE, Frank LD, Conway TL, Slymen DJ, Cain KL, Chapman JE, Kerr J:Neighborhood built environment and income: examining multiple health outcomes.Soc Sci Med2009,68:1285–1293.
32. Macintyre S:Deprivation amplification revisited; or, is it always true that poorer places have poorer access to resources for healthy diets and physical activity?Int J Behav Nutr Phys Act2007,4:32.
33. Lovasi GS, Hutson MA, Guerra M, Neckerman KM:Built environments and obesity in disadvantaged populations.Epidemiol Rev2009, 31:7–20.
34. Estabrooks PA, Lee RE, Gyurcsik NC:Resources for physical activity participation: does availability and accessibility differ by neighborhood socioeconomic status?Ann Beh Med2003,25:100–104.
35. Israel BA, Eng E, Schulz AJ, Parker EA:Methods in Community-Based Participatory Research for Health 1stedition. San Francisco: Jossey-Bass; 2005. 36. Minkler M:Community-based participatory research for health. San Francisco:
Jossey-Bass; 2008.
37. Greenwood DJ, Levin M:Introduction to Action Research: Social Research for Social Change 2ndedition. Thousand Oaks: Sage Publications; 2007. 38. Israel BA, Schultz A, Parker EA, Becker AB:Review of community based
research: assessing partnership approaches to improve public health. Annu Rev Public Health1998,19:173–202.
39. Wallerstein N, Duran B:Community-based participatory research contributions to intervention research: the intersection of science and practice to improve health equity.Am J Public Health2010,
100:S40–S46.
40. Ohri-Vachaspati P, Leviton L, Bors P, Brennan L, Brownson RC, Strunk S: Strategies proposed by Healthy Kids, Healthy Communities partnerships to prevent childhood obesity. [Erratum appears in Prev Chronic Dis 2010, 8(6).http://www.cdc.gov/pcd/issues/2012/11_0337.htm.].Prev Chronic Dis2012,9:100292. doi:http://dx.doi.org/10.5888/pcd9.100292. 41. Zoellner JM, Motley MM, Wilkinson M, Jackman B, barlow ML, Hill JL:
Engaging the Dan River Region to reduce obesity: application of the comprehensive participatory planning and evaluation process.Fam Community Health2012,35:44–56.
nutrition and physical activity interventions in a rural community in the Mississippi Delta.Progr in Community Health Partnersh2007,1:41–48. 43. Lefevre P, Kolsteren P, De Wael M, Byekwaso F, Beghin I:Comprehensive
participatory planning and evaluation.http://www.ifad.org/pub/bsf/cppe/ cppe.pdf.
44. U.S. Department of Labor:Regional and state unemployment.http://www. bls.gov/news.release/pdf/laus.pdf.
45. Virginia Department of Health:Virginia health equity report: unequal health across the commonwealth: a snapshot.http://www.vdh.state.va.us/ healthpolicy/documents/health-equity-report-summary.pdf.
46. U.S. Census Bureau State & County.http://quickfacts.census.gov/qfd/ states/51000.html.
47. Frank LD, Sallis JF, Saelens BE, Leary L, Cain K, Conway TL, Hess PM:The development of a walkability index: application to the Neighborhood Quality of Life Study.Br J Sports Med2010,44:924–933.
48. Glanz K, Sallis JF, Saelens BE, Frank LD:Nutrition Environment Measures Survey in stores (NEMS-S): development and evaluation.Am J Prev Med 2007,32:282–289.
49. Saelens BE, Glanz K, Sallis JF, Frank LD:Nutrition Environment Measures Study in restaurants (NEMS-R): development and evaluation.Am J Prev Med2007,32:273–281.
50. Saelens BE, Sallis JF, Black JB, Chen D:Neighborhood-based differences in physical activity: an environment scale evaluation.Am J Public Health 2003,93(9):1552–1558.
51. Frank LD, Engelke PO, Schmid TL:Health and community design: The impact of the built environment on physical activity. Island: Washington D.C; 2003. 52. Leslie E, Coffee N, Frank L, Owen N, Bauman A, Hugo G:Walkability of local
communities: using geographic information systems to objectively assess relevant environmental attributes.Health Place2007, 13(1):111–122.
53. Sallis JF, Saelens BE, Frank LD, Conway TL, Slymen DJ, Cain KL, Chapman JE, Kerr J:Neighborhood built environment and income: Examining multiple health outcomes.Social Sci & Med2009,68(7):1285–1293.
54. King AC, Sallis JF, Frank LD, Saelens BE, Cain K, Conway TL, Chapman JE, Ahn D, Kerr J:Aging in neighborhoods differing in walkability and income: Associations with physical activity and obesity in older adults. Soc Sci & Med2011,73(10):1525–1533.
55. Anselin L, Ibnu S, Youngihn K:An introduction to spatial data analysis. Geogrl Anal2006,38:5–22.
56. Burt JE, Barber GM:Elementary Statistics for Geographers. New York: The Guilford Press; 1996.
57. Anselin L:An Introduction to Spatial Autocorrelation Analysis with GeoDa.http://www.ggr.ulaval.ca/Cours/GGR-7025/Fichiers7025/Cours/ GeoDa/Intro%20ACS%20with%20GeoDa.pdf.
58. Moore LV, Diez-Roux AV:Associations of neighborhood characteristics with the location and type of food stores.Am J Public Health2006, 96:325–331.
59. Sallis JF, Glanz K:Physical activity and food environments: solutions to the obesity epidemic.Milbank Q2009,87:123–154.
60. Morland K, Wing S, Diez-Roux AV:The contextual effect of the local food environment on residents’diets: the atherosclerosis risk in communities study.Am J Public Health2002,92:1761–1768.
61. Morland K, Diez-Roux AV, Wing S:Supermarkets, other food stores and obesity: the atherosclerosis risk in communities study.Am J Prev Med 2006,30:333–339.
62. Li F, Harmer P, Cardinal BJ, Bosworth M, Johnson-Shleton D:Obesity and the built environment: does the density of neighborhood fast-food outlets matter?Am J Health Promot2009,23:203–209.
63. Mehta NK, Chang VW:Weight status and restaurant availability: a multilevel analysis.Am J Prev Med2008,34:127–133.
64. Lee RE, Booth KM, Reese-Smith JY, Regan G, Howard HH:The Physical Activity Resource Assessment (PARA) instrument: evaluating features, amenities, and incivilities of physical activity resources in urban neighborhoods.Int J Behav Nutr Phys Act2005,2:13.
65. Floyd MF, Taylor WC, Whitt-Glover M:Measurement of park and recreation environments that support physical activity in low-income communities of color: highlights of challenges and recommendations.Am J Prev Med 2009,36:S156–S160.
66. Gebel K, Bauman AE, Petticrew M:The physical environment and physical activity - a critical appraisal of review articles.Am J Prev Med2007, 32:361–369.
67. Handy S, Clifton K:Planning and the built enviornment: implications for obesity prevention. InHandbook of Obesity Prevention: A Resource for Health Professionals. Edited by Kumanyika S, Brownson RC. New York: Springer; 2007:167–188.
doi:10.1186/1479-5868-9-105
Cite this article as:Hillet al.:Does availability of physical activity and food outlets differ by race and income? Findings from an enumeration study in a health disparate region.International Journal of Behavioral Nutrition and Physical Activity20129:105.
Submit your next manuscript to BioMed Central and take full advantage of:
• Convenient online submission
• Thorough peer review
• No space constraints or color figure charges
• Immediate publication on acceptance
• Inclusion in PubMed, CAS, Scopus and Google Scholar
• Research which is freely available for redistribution