R E S E A R C H
Open Access
Effects of prescribed aerobic exercise
volume on physical activity and sedentary
time in postmenopausal women: a
randomized controlled trial
Jessica McNeil
1, Megan S. Farris
1, Yibing Ruan
1, Heather Merry
1, Brigid M. Lynch
2,3, Charles E. Matthews
4,
Kerry S. Courneya
5and Christine M. Friedenreich
1,6*Abstract
Background:Physical activity has emerged as an important lifestyle factor for primary prevention of numerous diseases, including postmenopausal breast cancer. No study to date has assessed the acute and long-term effects of year-long aerobic exercise programs differing in prescribed exercise volume on physical activity and sedentary time in postmenopausal women. Therefore, we aimed to examine the effects of two moderate-vigorous intensity exercise doses on total, light and moderate-vigorous intensity physical activity times, and sedentary time in postmenopausal women during the year-long intervention and one year later.
Methods:The Breast Cancer and Exercise Trial in Alberta (BETA) was a two-center, two-arm, 12-month randomized controlled trial that included 400 previously inactive postmenopausal women randomized to either 150
(MODERATE) or 300 (HIGH) minutes/week of aerobic exercise. Physical activity and sedentary time were assessed at baseline, 6- (intervention mid-point), 12- (prior to end of intervention) and 24-months (follow-up) with waist-mounted accelerometers (Actigraph GTX3®). Self-reported activity and sedentary time at baseline, 12- and 24-months was also assessed (Past Year Total Physical Activity Questionnaire and SIT-Q). Intention-to-treat analyses were conducted using linear mixed models and adjusted for baseline variables.
Results:Both physical activity interventions led to increases in objective and subjective measures of total and moderate-vigorous intensity/recreational physical activity time, coupled with decreases in sedentary time, at 6- and 12-months compared to baseline. Additionally, greater increases in accelerometry-derived total physical activity time at 6- and 12-months, and self-reported recreational activity time at 12-months, compared to baseline were noted in the HIGH versus MODERATE groups. Decreases in total, light and moderate-vigorous intensity physical activity time, and an increase in sedentary time, in both groups were noted at 24-months compared to 12-months. A decrease in light intensity physical activity time in both groups at 24-months compared to baseline was also noted.
Conclusion:These findings have important health implications, suggesting that total physical activity time can be increased with greater volumes of prescribed exercise, but that additional support and resources could be used to promote the maintenance of these high levels of aerobic exercise participation following study completion.
(Continued on next page)
* Correspondence:[email protected]
1Department of Cancer Epidemiology and Prevention Research,
CancerControl Alberta, Alberta Health Services, Holy Cross Center, Room 514, Box ACB, 2210 2nd Street SW, Calgary, Alberta T2S 3C3, Canada
6Departments of Oncology and Community Health Sciences, Cumming
School of Medicine, University of Calgary, Calgary, AB, Canada Full list of author information is available at the end of the article
(Continued from previous page)
Trial registration:clinicaltrials.gov identifier:NCT01435005(BETA Trial). Registred September 15th 2011 (retrospectively registered).
Keywords:Exercise intervention, Exercise dose, Follow-up, Sedentary behavior
Background
Physical activity has emerged as an important lifestyle factor for primary prevention of numerous diseases in-cluding but not limited to: cardiovascular disease [1,2], type 2 diabetes [3, 4] and certain types of cancers [5]. More recently, greater sedentary time has been identified as a risk factor for developing obesity and other adverse health outcomes [6, 7]. The menopausal transition in particular is associated with weight and fat mass gains [8, 9], which may partly result from decreased physical activity time [10, 11], hence leaving postmenopausal women at a heightened risk for developing adverse health outcomes.
The Canadian Society for Exercise Physiology recom-mends that adults should engage in at least 150 min of moderate-vigorous intensity aerobic physical activity/ week to achieve health benefits [12]. However, findings from a Canadian nationally representative sample
com-pleted in 2007–2009 with objective measurements of
physical activity time indicated that 85% of adults do not meet these guidelines [13]. Furthermore, this report noted a decline in total physical activity time coupled with an increase in sedentary time with age [13]. There-fore, the implementation of interventions and resources promoting increases in total physical activity time and lower sedentary time are needed, especially in older adults.
A modest number of intervention studies have exam-ined the effects of an exercise and/or diet intervention on objectively-assessed physical activity time in post-menopausal women [14–20]. It still remains uncertain
whether higher volumes of prescribed exercise
(300 min/week) would lead to greater increases in phys-ical activity time and better maintenance of this increase over the long term. Two studies have used pedometers as an objective measurement of physical activity time
[19, 20]. The Women On the Move through Activity
and Nutrition (WOMAN) study found that pedometer steps were significantly higher in the lifestyle interven-tion compared to the health educainterven-tion group [19]. The Dose Response to Exercise in Women (DREW) Trial found a statistically significant linear trend between the lowest and highest volume of exercise prescribed using pedometer data [20]. Two more recent studies used ac-celerometer devices [14,18]. Specifically, The Diet, Exer-cise, Metablism, and Obesity in Older Women (DEMO) Trial randomized 36 postmenopausal women to caloric
restriction interventions combined with either a moder-ate- or vigorous-intensity aerobic exercise component [18]. This study found that participants had greater physical activity time on days when they did not perform center-based/supervised exercises, and that this differ-ence was especially greater for participants randomized to the vigorous-intensity aerobic exercise group. Add-itionally, in the Sex Hormones and Physical Exercise (SHAPE)-2 study, women randomized to the exercise intervention were more physically active and less seden-tary at follow-up (12-months post intervention) [14].
The Breast Cancer and Exercise Trial in Alberta (BETA) assessed the dose-response effects of a year-long prescribed aerobic exercise intervention on biomarkers related to breast cancer risk in postmenopausal women [21]. We collected objective measurements of physical activity and sedentary time before, during and just prior to the end of the intervention (baseline, 6- and 12-months), as well as at follow-up (24-months). We also collected self-reported, domain-specific measures of physical activity and sedentary time at baseline, 12- and 24-months. The objective of the present analysis was to examine the effects of prescribed aerobic exercise vol-ume on physical activity and sedentary time at 6-, 12-and 24-months.
Methods
Setting and participants
The design and methods for BETA are described in de-tail elsewhere [21–23]. This two-center, two-arm ran-domized controlled exercise intervention trial and follow-up assessments were conducted in Calgary and Edmonton (Alberta, Canada) between June 2010 and June 2014. A total of 400 women were randomized to the MODERATE (150 min of exercise/week) or HIGH (300 min of exercise/week) volumes of aerobic exercise interventions. Eligibility criteria included: age 50– 74 years, postmenopausal, no previous cancer diagnosis, inactive (< 90 min/week of exercise or if between 90 and 120 min/week, a VO2peak< 34 ml/kg/min as measured
the Health Research Ethics Board of the University of Alberta. Informed consent was provided by all partici-pants prior to study participation. This study followed the CONSORT guidelines for reporting [24].
Exercise interventions
All participants were asked to exercise five days/week accomplishing 65–75% of heart rate reserve for either 30 min (MODERATE) or 60 min (HIGH)/session. All participants wore heart rate monitors to ensure that the exercise was completed within the prescribed target heart rate zones. Exercise sessions were supervised by certified exercise trainers at fitness facilities in Calgary and Edmonton on at least three days/week. Exercise on the other two days/week could be unsupervised and completed at a location of the participants choosing. Participants could choose to exercise at the fitness facil-ities on five days/week. Initially, exercise volume in-creased gradually over a 12-week ramp-up period [21,
22, 25]. Exercise adherence was monitored with weekly exercise logs completed by the exercise trainers. The ex-ercise trainers also recorded information collected by the heart rate monitors (exercise time, continuous heart rate, time spent in the pre-determined heart rate zones and the type of aerobic activities completed) during su-pervised and unsusu-pervised exercise sessions into a data-base that was maintained at the recreational facilities in Edmonton and Calgary during the year-long interven-tion. Participants were aware that all outcome assess-ments would be repeated at the 24-month time-point. However, physical activity time was not monitored, nor did participants receive an exercise prescription or had access to the training facilities and exercise trainers dur-ing the 12- to 24-month period.
Outcome measures
All outcomes were assessed at baseline, intervention mid-point (6-months), just prior to the end of intervention (12-months) and at follow-up (24-(12-months). Total, moderate-vigorous and light intensity physical activity times, and sed-entary time were objectively-assessed with the ActiGraph® GT3X+ device (ActiGraph LLC, Pensacola, Florida, USA). Participants were asked to wear the activity monitor around their waist during all waking hours (i.e. monitors were re-moved during sleep), except for water-based activities, for seven consecutive days at each time-point. A daily activity monitor log was completed by each participant to record the time when the accelerometer was worn and the types of activities done during any “non-wear” time throughout the day. Accelerometry data were collected from the Acti-Graph® GT3X+ device at a sampling rate of 80 Hz and were aggregated to 60-s epoch files for analysis by the ActiLife® software (v6.10.2). For accelerometer data to be deemed valid at each time-point, at least four days of 10 h of wear
time/day were needed. This amount of valid data was veri-fied first with graphical displays computed by the ActiLife® software and the participants’daily activity monitor logs at data collection and then through data processing. For cases of invalid data at the collection phase, study staff asked par-ticipants to wear the device for another seven consecutive days. We used the Actigraph® Vertical Axis (VT) calcula-tions [26,27] to derive physical activity and sedentary time
outcomes from the accelerometry-measured activity
counts. First, total physical activity time (Metabolic Equiva-lents of Task, METs) was calculated with the following re-gression equation proposed by Freedson et al. [27]: METs/ min = 1.439008 + (0.000795 x vertical axis counts/min). These values per minute were then summed and divided by 60 to obtain total physical activity time values in MET-hours/day. Second, the following cut-points were used to define physical activity time according to intensity and sed-entary time for the VT calculations: < 100 counts per
mi-nute (sedentary), 100–760 counts per minute (light
intensity) and > 760 counts per minute (moderate-vigorous intensity). We applied the Choi algorithm to remove non-wear time [28]. To account for potentially influential non-wear time during activities captured in the activity monitor logs filled out by participants, we first assigned a specific MET value to the activity reported in the monitor logs ac-cording to the values presented in the Compendium of Physical Activities [29]. However, these values were not compatible with the accelerometry-collected data. There-fore, we attempted to apply a mean imputation value of three METs for every hour of non-wear activity that was documented [30], independently of the reported activity that was performed during non-wear time. This mean im-putation was only applied when an activity (e.g. cycling, jog-ging) was reported by the participants in the activity logs during non-wear time. No statistically significant differ-ences were noted between mean imputed and non-imputed total physical activity time (results not shown). Hence, we decided not to include imputed non-wear activity values into our estimates of physical activity time.
Self-reported activity and sedentary time were assessed with the Past Year Total Physical Activity Questionnaire (PYTPAQ) [31] and the SIT-Q [32] at baseline, 12- and 24-months. These questionnaires assessed usual activity and sed-entary time within the last 12 months. All activities reported on the PYTPAQ were converted into MET-hours/week using the Compendium of Physical Activities [29]. The derived variables from the PYTPAQ included: total, occupational, recreational, household and transportation activities. The derived variables from the SIT-Q included: total, occupational and leisure sedentary time, all reported as hours/day.
Statistical analyses
estimated an initial sample size of 165 participants/ group at 12-months. We expected a < 15% loss at 24-months, suggesting that at least 140 participants would
be included in the 24-month analyses [23]. For the
present analyses, it is estimated that the final sample
sizes of 140–170 participants per group with a
pre-determined power of 0.80 and a two-tailedα= 0.05 pro-vided an effect size of Cohen’s d= 0.30–0.34 (small-medium effect) to detect differences in total physical ac-tivity and sedentary time outcomes between groups at 6-, 12- and 24-months compared to baseline.
Differences in baseline participant characteristics be-tween the MODERATE and HIGH groups were assessed with a two-sample t-test for continuous variables or aχ2 test for categorical variables. An intention-to-treat ana-lysis that included all participants with complete accel-erometry data at baseline, 6-, 12- and/or 24-months regardless of protocol adherence was used. This same approach was used for the PYTPAQ and SIT-Q outcome data at baseline, 12- and 24-months. Generalized linear
models estimated least-squares mean differences
(LSMD) in the change of physical activity and sedentary time outcomes between the MODERATE and HIGH groups for each time-point comparison. These models were a priori adjusted for baseline values of age (years),
body mass index (BMI; kg/m2) and VO2peak
(submaxi-mal cardiorespiratory test; ml/kg/min), as well as differ-ences in wear time (hours/day) between time-point comparisons (for accelerometry data only). Full-time employment status (work ≥ 35 h/week or < 35 h/week) was also added as a covariate in the SIT-Q data analysis. Potential effect modification for accelerometry-derived total physical activity and sedentary time in the baseline to 12 months and baseline to 24 months analyses were assessed for the following variables based on their scien-tific plausibility and support in previous research [33– 35]: age (years), marital status (married/common law or other), study site (Calgary or Edmonton), education
(≤ high school or≥post-secondary school), ethnicity
(Caucasian or other), baseline VO2peak(ml/kg/min) and
baseline BMI (kg/m2). Since no evidence of effect modi-fication was noted (results not shown), stratified analyses were not conducted. Potential confounding was assessed on the remaining variables not adjusted for a priori using backwards elimination. All analyses were per-formed using SAS (SAS 9.2 for Linux, SAS Institute Inc.) [36]. Statistical significance was set atα< 0.05.
Results
The number of referred/invited and eligible participants, as well as reasons for exclusion from randomization, were previously reported [22]. Of the 400 participants randomized at baseline, 331 and 283 participants had complete and valid accelerometry data at baseline to
12-months and baseline to 24-12-months, respectively (Fig. 1; Study Flow Chart). A total of 321 and 272 participants had complete and valid accelerometry data at baseline to 6-months and 12- to 24-months, respectively. Baseline participant characteristics for those who had valid and complete accelerometry data at baseline to 12-months (n= 331) are presented in Table1. There were no group differences in accelerometer wear time at baseline (15.0 ± 1.1 versus 15.1 ± 1.1 h/day; P= 0.7), 6-months (14.7 ± 1.1 versus 14.9 ± 1.1 h/day; P= 0.2), 12-months (14.9 ± 1.1 versus 14.9 ± 1.1 h/day;P= 0.6) and 24-months (14.9 ± 1.1 versus 14.8 ± 1.1 h/day;P= 0.8).
Data on exercise adherence obtained from the exercise logs maintained by the BETA Exercise Trainers are pre-sented elsewhere [37–39]. There was no statistical differ-ence in the number of completed supervised (2.2 ± 0.7 versus 2.1 ± 0.7 sessions/week;P= 0.4) and unsupervised (1.6 ± 0.6 versus 1.5 ± 0.6 sessions/week; P= 0.8) sessions between groups. For participants included in the accel-erometry analyses, the HIGH group recorded greater ex-ercise time during the intervention (two-samplet-test;P
< 0.0001), with 12-month median (quartiles 1, 3) adher-ence values of 239 (193, 264) and 132 (115, 139) mi-nutes/week. The median adherence rates for the HIGH
and MODERATE groups for weeks 13–52 (full exercise
prescription following the ramp-up period) were 262 (203, 292) and 140 (121, 150) minutes/week, respectively (two-samplet-test;P< 0.0001).
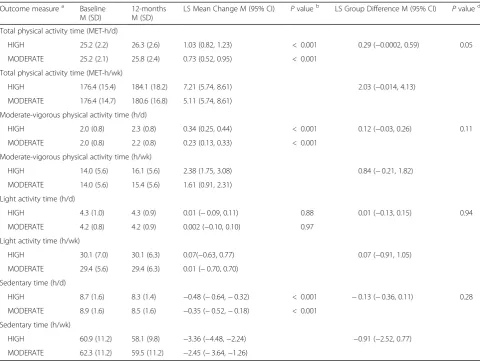
Statistically significant increases in total and
moderate-vigorous intensity physical activity time, and a decrease in sedentary time, were noted in both groups at 12-months compared to baseline (Table 2). Similar re-sults were noted for changes in accelerometry-derived outcomes between baseline and 6-months (Additional file1). However, only the increase in total physical activ-ity time was greater in the HIGH versus MODERATE group at 6-months, and borderline significant at 12-months, compared to baseline. A statistically significant increase in self-reported total and recreational activity time, and a decrease in leisure sedentary time, were noted in both groups at 12-months compared to base-line (Additional file 2). This increase in self-reported recreational activity time was also greater in the HIGH vs. MODERATE group between these time points.
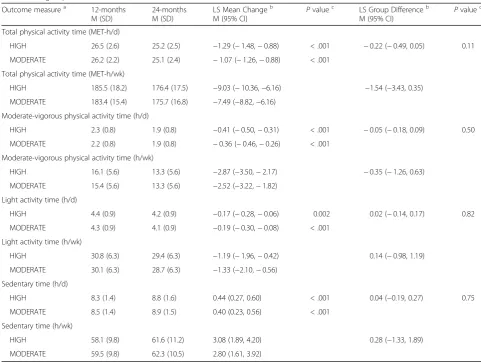
A statistically significant decrease in total, light and moderate-vigorous intensity physical activity time, and an increase in sedentary time, in both groups were noted
at 24-months compared to 12-months (Table 3).
How-ever, no differences in accelerometry-derived variables were noted between groups between these time points. A statistically significant decrease in self-reported total and recreational activity were noted in both groups at
24-months compared to 12-months (Additional file 3).
Fig. 1CONSORT diagram; the flow of participants through the BETA study, Alberta, Canada, 2010–2014. *Accelerometers were not given to participants who had low adherence throughout the intervention or refused to wear the accelerometer a second time following invalid data (e.g. device malfunction, did not wear the accelerometer for at least four days for 10 or more hours/day). **Participants who refused to wear the accelerometer and/or wanted only to complete the study questionnaires at the 24-month time-point
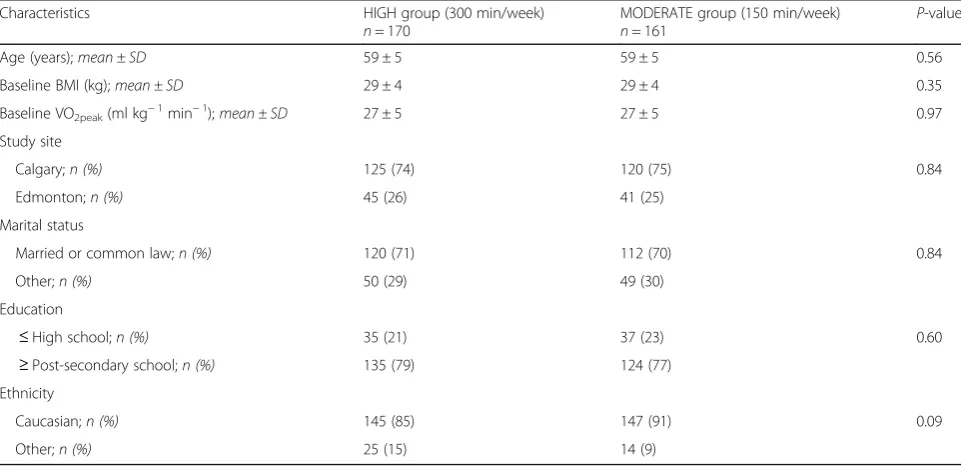
Table 1Baseline covariates for the participants randomized to the HIGH and MODERATE exercise groups in the Breast Cancer and Exercise Trial in Alberta (BETA) (n= 331)
Characteristics HIGH group (300 min/week)
n= 170
MODERATE group (150 min/week)
n= 161 P
-value
Age (years);mean ± SD 59 ± 5 59 ± 5 0.56
Baseline BMI (kg);mean ± SD 29 ± 4 29 ± 4 0.35
Baseline VO2peak(ml kg− 1
min−1);mean ± SD 27 ± 5 27 ± 5 0.97
Study site
Calgary;n (%) 125 (74) 120 (75) 0.84
Edmonton;n (%) 45 (26) 41 (25)
Marital status
Married or common law;n (%) 120 (71) 112 (70) 0.84
Other;n (%) 50 (29) 49 (30)
Education
≤High school;n (%) 35 (21) 37 (23) 0.60
≥Post-secondary school;n (%) 135 (79) 124 (77)
Ethnicity
Caucasian;n (%) 145 (85) 147 (91) 0.09
Other;n (%) 25 (15) 14 (9)
activity was greater in the HIGH versus MODERATE group between these time points.
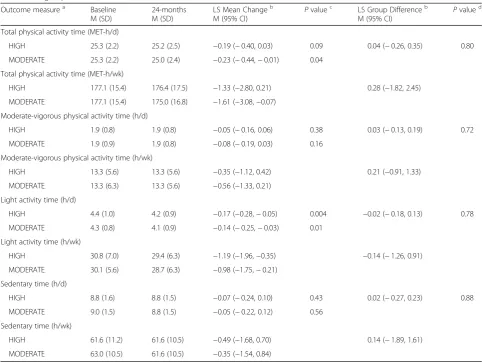
A statistically significant decrease in total physical activ-ity time in the MODERATE group only and light intensactiv-ity activity time in both groups at 24-months compared to baseline was observed (Table4). No between-group differ-ences in accelerometry-derived outcomes were noted be-tween these time points. A statistically significant increase in self-reported total and recreational activity, and a de-crease in leisure sedentary time, in both groups at 24-months compared to baseline was noted (Additional file
4). A decrease in self-reported total sedentary time at 24-months compared to baseline was also noted in the HIGH group only. There were no between-group differences in self-reported activity and sedentary time measurements between these time points.
Discussion
To our knowledge, this is the first study to assess the ef-fects of different volumes of prescribed aerobic exercise on total physical activity and sedentary time in postmen-opausal women during a 12-month intervention and at 24-month follow-up. We noted increases in objective and subjective measures of total and moderate-vigorous intensity/recreational physical activity time, coupled with decreases in sedentary time, in response to both volumes of prescribed physical activity at 6- and 12-months. These results are consistent with findings from a six-week randomized controlled trial by Gomersall et al. that prescribed 300 min/week versus 150 min/week of aerobic physical activity versus no additional activity (control) in previously inactive adults [40]. That study
reported statistically significant increases in total
Table 2Changes in accelerometry-derived physical activity and sedentary time variables (baseline to 12-months) between HIGH and MODERATE groups in BETA, Alberta, Canada, 2010–2014
Outcome measurea Baseline M (SD)
12-months M (SD)
LS Mean Change M (95% CI) Pvalueb LS Group Difference M (95% CI)
Pvalued
Total physical activity time (MET-h/d)
HIGH 25.2 (2.2) 26.3 (2.6) 1.03 (0.82, 1.23) < 0.001 0.29 (−0.0002, 0.59) 0.05
MODERATE 25.2 (2.1) 25.8 (2.4) 0.73 (0.52, 0.95) < 0.001
Total physical activity time (MET-h/wk)
HIGH 176.4 (15.4) 184.1 (18.2) 7.21 (5.74, 8.61) 2.03 (−0.014, 4.13)
MODERATE 176.4 (14.7) 180.6 (16.8) 5.11 (5.74, 8.61)
Moderate-vigorous physical activity time (h/d)
HIGH 2.0 (0.8) 2.3 (0.8) 0.34 (0.25, 0.44) < 0.001 0.12 (−0.03, 0.26) 0.11
MODERATE 2.0 (0.8) 2.2 (0.8) 0.23 (0.13, 0.33) < 0.001
Moderate-vigorous physical activity time (h/wk)
HIGH 14.0 (5.6) 16.1 (5.6) 2.38 (1.75, 3.08) 0.84 (−0.21, 1.82)
MODERATE 14.0 (5.6) 15.4 (5.6) 1.61 (0.91, 2.31)
Light activity time (h/d)
HIGH 4.3 (1.0) 4.3 (0.9) 0.01 (−0.09, 0.11) 0.88 0.01 (−0.13, 0.15) 0.94
MODERATE 4.2 (0.8) 4.2 (0.9) 0.002 (−0.10, 0.10) 0.97
Light activity time (h/wk)
HIGH 30.1 (7.0) 30.1 (6.3) 0.07(−0.63, 0.77) 0.07 (−0.91, 1.05)
MODERATE 29.4 (5.6) 29.4 (6.3) 0.01 (−0.70, 0.70)
Sedentary time (h/d)
HIGH 8.7 (1.6) 8.3 (1.4) −0.48 (−0.64,−0.32) < 0.001 −0.13 (−0.36, 0.11) 0.28
MODERATE 8.9 (1.6) 8.5 (1.6) −0.35 (−0.52,−0.18) < 0.001
Sedentary time (h/wk)
HIGH 60.9 (11.2) 58.1 (9.8) −3.36 (−4.48,−2.24) −0.91 (−2.52, 0.77)
MODERATE 62.3 (11.2) 59.5 (11.2) −2.45 (−3.64,−1.26)
CIConfidence interval,dDay,hHours,LSLeast-squares,MMean,METMetabolic equivalent of task,SDStandard deviation,wkWeek
a
n = 170 and 161 for the HIGH and MODERATE groups, respectively
b
Pvalue for the test of significance for the null hypothesis that the LS mean difference across time equals 0
c
Least-square group mean of the High and Moderate exercise groups and their within- and between-group differences were estimated from general linear models specified as: physical activity and sedentary time changes from baseline to 12-months =β0 +β1 (intervention group) +β2 (baseline outcome value) +β3 (age) +β4 (study site) +β5 (baseline BMI) +β6 (baseline VO2peak) +β7 (difference in accelerometer wear time between time-points)
d
physical activity time in both exercise interventions compared to control [40]. Additionally, our results con-firmed that greater volumes of prescribed exercise led to greater increases in total physical activity time at 6- and 12-months compared to baseline. The smaller difference in total physical activity time change observed between groups at 12- compared to 6-months (i.e. difference of 0.46 versus 0.29 MET-hours/day between groups at 6-and 12-months) may be partly explained by slight differ-ences in the completion rates of prescribed exercise ses-sions following the ramp-up period between groups (91% and 84% in the MODERATE and HIGH exercise groups) and/or greater improvements in exercise econ-omy/efficiency over time with higher training volumes [41]. Data on self-reported activity that we obtained via the PYTPAQ corroborate these findings, indicating that
recreational activity was significantly greater at 12-months compared to baseline in the HIGH versus MODERATE exercise groups. As previously reported [22], mean reductions in total body fat, abdominal fat, BMI, waist circumference and waist to hip ratio were greater in the HIGH vs. MODERATE groups at 12-months compared to baseline, with the greatest reduc-tions in adiposity occurring in participants reporting more than 250 min/week of exercise. It is therefore sug-gested that greater volumes of aerobic exercise led to greater decreases in adiposity measures in these participants.
Decreases in total, light and moderate-vigorous inten-sity physical activity time, and an increase in sedentary time, in both groups were noted at 24-months compared to 12-months. Additionally, decreases in self-reported
Table 3Changes in accelerometry-derived physical activity and sedentary time variables (12- to 24-months) between HIGH and MODERATE groups in BETA, Alberta, Canada, 2010–2014
Outcome measurea 12-months
M (SD)
24-months M (SD)
LS Mean Changeb M (95% CI)
Pvaluec LS Group Differenceb M (95% CI)
Pvalued
Total physical activity time (MET-h/d)
HIGH 26.5 (2.6) 25.2 (2.5) −1.29 (−1.48,−0.88) < .001 −0.22 (−0.49, 0.05) 0.11
MODERATE 26.2 (2.2) 25.1 (2.4) −1.07 (−1.26,−0.88) < .001
Total physical activity time (MET-h/wk)
HIGH 185.5 (18.2) 176.4 (17.5) −9.03 (−10.36,−6.16) −1.54 (−3.43, 0.35)
MODERATE 183.4 (15.4) 175.7 (16.8) −7.49 (−8.82,−6.16)
Moderate-vigorous physical activity time (h/d)
HIGH 2.3 (0.8) 1.9 (0.8) −0.41 (−0.50,−0.31) < .001 −0.05 (−0.18, 0.09) 0.50
MODERATE 2.2 (0.8) 1.9 (0.8) −0.36 (−0.46,−0.26) < .001
Moderate-vigorous physical activity time (h/wk)
HIGH 16.1 (5.6) 13.3 (5.6) −2.87 (−3.50,−2.17) −0.35 (−1.26, 0.63)
MODERATE 15.4 (5.6) 13.3 (5.6) −2.52 (−3.22,−1.82)
Light activity time (h/d)
HIGH 4.4 (0.9) 4.2 (0.9) −0.17 (−0.28,−0.06) 0.002 0.02 (−0.14, 0.17) 0.82
MODERATE 4.3 (0.9) 4.1 (0.9) −0.19 (−0.30,−0.08) < .001
Light activity time (h/wk)
HIGH 30.8 (6.3) 29.4 (6.3) −1.19 (−1.96,−0.42) 0.14 (−0.98, 1.19)
MODERATE 30.1 (6.3) 28.7 (6.3) −1.33 (−2.10,−0.56)
Sedentary time (h/d)
HIGH 8.3 (1.4) 8.8 (1.6) 0.44 (0.27, 0.60) < .001 0.04 (−0.19, 0.27) 0.75
MODERATE 8.5 (1.4) 8.9 (1.5) 0.40 (0.23, 0.56) < .001
Sedentary time (h/wk)
HIGH 58.1 (9.8) 61.6 (11.2) 3.08 (1.89, 4.20) 0.28 (−1.33, 1.89)
MODERATE 59.5 (9.8) 62.3 (10.5) 2.80 (1.61, 3.92)
CIConfidence interval,dDay,hHours,LSLeast-squares,MMean,METMetabolic equivalent of task,SDStandard deviation,wkWeek
a
n= 138 and 134 for the HIGH and MODERATE groups, respectively
b
Least-square group mean of the High and Moderate exercise groups and their within- and between-group differences were estimated from general linear models specified as: physical activity and sedentary time changes from 12- to 24-months =β0 +β1 (intervention group) +β2 (12-month outcome value) +β3 (age) +β4 (study site) +β5 (baseline BMI) +β6 (baseline VO2peak) +β7 (difference in wear time between time-points)
c
Pvalue for the test of significance for the null hypothesis that the LS mean difference across time equals 0
d
total and recreational activity were observed in both groups at 24-months compared to 12-months, with sig-nificantly greater reductions in self-reported recreational activity in the HIGH versus MODERATE groups at 24-months compared to 12-24-months. A decrease in light in-tensity physical activity time in both groups and a de-crease in total physical activity time in the MODERATE group only were also noted at 24-months compared to baseline. Our recent paper examining the changes in adiposity measurements in BETA at follow-up reported increases in total body fat between 12 and 24 months in both groups [23], which may be partially explained by this decrease in total physical activity time following study completion. Gomersall et al. [40] reported similar findings, indicating that total physical activity time returned to baseline levels in all groups (300 min/week
versus 150 min/week versus control) six months follow-ing the end of the six-week intervention. Conversely, other studies reported an increase in moderate-vigorous intensity physical activity time and/or lower sedentary time at follow-up versus baseline [14, 42]. A meta-analysis indicated that the degree of energy compensa-tion (i.e. amount of weight loss below what is expected for the amount of exercise energy expenditure) is highly variable for exercise interventions of short durations (< 20 weeks), but approaches 100% (i.e. no changes in body weight, despite increased exercise participation) in exer-cise interventions > 40 weeks in duration [43]. It is pos-sible that delayed compensatory responses in total physical activity time and/or sedentary time may be greater in BETA as a result of the length of the interven-tion and follow-up periods.
Table 4Changes in accelerometry-derived physical activity and sedentary time variables (baseline to 24-months) between HIGH and MODERATE groups in BETA, Alberta, Canada, 2010–2014
Outcome measurea Baseline
M (SD)
24-months M (SD)
LS Mean Changeb M (95% CI)
Pvaluec LS Group Differenceb M (95% CI)
Pvalued
Total physical activity time (MET-h/d)
HIGH 25.3 (2.2) 25.2 (2.5) −0.19 (−0.40, 0.03) 0.09 0.04 (−0.26, 0.35) 0.80
MODERATE 25.3 (2.2) 25.0 (2.4) −0.23 (−0.44,−0.01) 0.04
Total physical activity time (MET-h/wk)
HIGH 177.1 (15.4) 176.4 (17.5) −1.33 (−2.80, 0.21) 0.28 (−1.82, 2.45)
MODERATE 177.1 (15.4) 175.0 (16.8) −1.61 (−3.08,−0.07)
Moderate-vigorous physical activity time (h/d)
HIGH 1.9 (0.8) 1.9 (0.8) −0.05 (−0.16, 0.06) 0.38 0.03 (−0.13, 0.19) 0.72
MODERATE 1.9 (0.9) 1.9 (0.8) −0.08 (−0.19, 0.03) 0.16
Moderate-vigorous physical activity time (h/wk)
HIGH 13.3 (5.6) 13.3 (5.6) −0.35 (−1.12, 0.42) 0.21 (−0.91, 1.33)
MODERATE 13.3 (6.3) 13.3 (5.6) −0.56 (−1.33, 0.21)
Light activity time (h/d)
HIGH 4.4 (1.0) 4.2 (0.9) −0.17 (−0.28,−0.05) 0.004 −0.02 (−0.18, 0.13) 0.78
MODERATE 4.3 (0.8) 4.1 (0.9) −0.14 (−0.25,−0.03) 0.01
Light activity time (h/wk)
HIGH 30.8 (7.0) 29.4 (6.3) −1.19 (−1.96,−0.35) −0.14 (−1.26, 0.91)
MODERATE 30.1 (5.6) 28.7 (6.3) −0.98 (−1.75,−0.21)
Sedentary time (h/d)
HIGH 8.8 (1.6) 8.8 (1.5) −0.07 (−0.24, 0.10) 0.43 0.02 (−0.27, 0.23) 0.88
MODERATE 9.0 (1.5) 8.8 (1.5) −0.05 (−0.22, 0.12) 0.56
Sedentary time (h/wk)
HIGH 61.6 (11.2) 61.6 (10.5) −0.49 (−1.68, 0.70) 0.14 (−1.89, 1.61)
MODERATE 63.0 (10.5) 61.6 (10.5) −0.35 (−1.54, 0.84)
CIConfidence interval,dDay,hHours,LSLeast-squares,MMean,METMetabolic equivalent of task,SDStandard deviation,wkWeek
a
n= 140 and 143 for the HIGH and MODERATE groups, respectively
b
Least-square group mean of the High and Moderate exercise groups and their within- and between-group differences were estimated from general linear models specified as: physical activity and sedentary time changes from baseline to 24-months =β0 +β1 (intervention group) +β2 (baseline outcome value) +β3 (age) +β4 (study site) +β5 (baseline BMI) +β6 (baseline VO2peak) +β7 (difference in wear time between time-points)
c
Pvalue for the test of significance for the null hypothesis that the LS mean difference across time equals 0
d
It is very likely that decreases in total physical activity time and/or increases in sedentary time are expected to occur following the end of an exercise intervention (i.e. the changes in our outcome measures reflect the re-moval of the intervention rather than the maintenance of an intervention), thus highlighting the challenges of implementing these types of exercise interventions or recommendations into the real world. Indeed, one study speculated that it may be difficult for participants in a structured exercise intervention group to find new ways/ settings to maintain their physical activity routine fol-lowing study completion, compared to those randomized to a home-based physical activity program [44]. Recent studies have tried to implement strategies to prevent re-versions in total physical activity time following the completion of exercise interventions. More specifically, a two-arm intervention by Niklas et al. [45] investigated the effects of adding a self-monitoring intervention with accelerometry to a traditional diet and exercise trial, ver-sus diet and exercise alone, on total physical activity time and anthropometrics during a five-month weight maintenance period in older overweight adults. The au-thors reported a positive trend towards greater light in-tensity activity time in the group with the added self-monitoring intervention compared to diet and exercise alone. Cadmus-Bertram et al. [46, 47] also recently re-ported an increase in moderate-vigorous intensity phys-ical activity time following a 16-week self-monitoring exercise intervention with a Fitbit® activity tracker in postmenopausal women. Additionally, 96% of partici-pants found the Fitbit® activity tracker to be “somewhat or very helpful” for increasing total physical activity time. Therefore, the addition of self-monitoring tools in conjunction with a structured exercise program may contribute to maintaining increased total physical activ-ity and reduced sedentary time following study comple-tion. Future studies evaluating the use of self-monitoring tools to promote the maintainance of increased physical activity and reduced sedentary time following an exercise intervention are needed to corroborate the abovemen-tioned findings.
Our results are mostly generalizable to healthy, post-menopausal women. Strengths of BETA include the
im-plementation of a year-long exercise intervention
including supervised exercise sessions, a high adherence rate in both exercise groups, a large sample size and the inclusion of both objective and subjective assessments of physical activity and sedentary time during the interven-tion, at study completion and follow-up. Our limitations include the large number of analyses conducted, which may increase the chances of spurious findings. Addition-ally, there were missing accelerometry data in all
ana-lyses. The most common reasons for missing
accelerometer data included refusal to wear the device
and lack of adherence to the trial, which may be evi-dence of selection bias, since women who refused to wear the devices may be more inactive than those who did not. However, when comparing participants with valid accelerometry data at baseline and 12-months (n= 331) versus participants without valid accelerometry data (n= 69), age, BMI, VO2peakand measures of physical
ac-tivity and sedentary time did not differ between com-pleters and non-comcom-pleters, with the exception of light intensity activity time (P= 0.01). Thus, the magnitude of selection bias is minimal and may not influence our overall results.
These findings suggest that total physical activity time can be increased with greater volumes of prescribed ex-ercise. However, physical activity and sedentary time returned to baseline levels following study completion, thus highlighting the challenges in implementing these types of exercise interventions or recommendations into the real world. Additional support and resources (e.g. use of self-monitoring activity trackers) may be benefi-cial to promote the maintenance of increased physical activity and reduced sedentary time over the long-term following study completion. Future studies should also include qualitative and/or quantitative assessments of common barriers to maintaining achieved increases in physical activity participation and reduced sedentary time following an exercise intervention.
Additional files
Additional file 1Changes in accelerometry-derived physical activity and sedentary time variables (baseline to 6-months) between HIGH and MOD-ERATE groups in BETA, Alberta, Canada, 2010–2014. (DOCX 18 kb)
Additional file 2Changes in self-reported physical activity and seden-tary time variables (baseline to 12-months) between HIGH and MODER-ATE groups in BETA, Alberta, Canada, 2010–2014. (DOCX 23 kb)
Additional file 3Changes in self-reported physical activity and seden-tary time variables (12- to 24-months) between HIGH and MODERATE groups in BETA, Alberta, Canada, 2010–2014. (DOCX 22 kb)
Additional file 4Changes in self-reported physical activity and seden-tary time variables (baseline to 24-months) between HIGH and MODER-ATE groups in BETA, Alberta, Canada, 2010–2014. (DOCX 23 kb)
Abbreviations
BETA:Breast Cancer and Exercise Trial in Alberta; BMI: Body Mass Index; CI: Confidence Interval; LSMD: Least-Squares Mean Difference;
MET: Metabolic Equivalent of Task; PYTPAQ: Past Year Total Physical Activity Questionnaire; VT: Vertical Axis
Acknowledgements
Quesnel and Trisha Kelly. Data management, including database creation, questionnaire design, data integrity and quality control, was done by: Dr Steven Szarka, Farit Vakhetov, and Wendy Walroth. Qinggang Wang was responsible for the randomization procedures, sample size calculations and some data verification.
Funding
The BETA Trial was funded by a research grant from the Alberta Cancer Foundation (#24404). Dr Jessica McNeil is a recipient of Postdoctoral Fellowship Awards from the Canadian Institutes of Health Research and Alberta Innovates-Health Solutions. Dr Kerry Courneya holds a Tier I Canada Research Chair. Dr Christine Friedenreich held a Health Senior Scholar Award from Alberta Innovates-Health Solutions and the Alberta Cancer Foundation Weekend to End Women’s Cancers Breast Cancer Chair. Dr. Charles E. Mat-thews’effort was supported by the National Institutes of Health Intramural Research Program. Dr Brigid M. Lynch was supported by a Fellowship from the National Breast Cancer Foundation (ECF-15-012).
Availability of data and materials
The datasets used and/or analyzed during the current study are available from the corresponding author on reasonable request.
Authors’contributions
CMF, KSC, BML and CM were involved in the conception and design of the study. CMF, KSC and MF acquired the data. JM drafted the manuscript. HM and YR conducted the data processing and statistical analysis. JM and MF interpreted the data. All authors critically revised the manuscript for intellectual content, approved the final version of the manuscript and agreed to be accountable for all aspects of the work ensuring that questions related to the accuracy or integrity of any part of the work at appropriately investigated and resolved.
Ethics approval and consent to participate
The study protocol was approved by the Alberta Cancer Research Ethics Committee, the Conjoint Health Research Ethics Board of the University of Calgary and the Health Research Ethics Board of the University of Alberta. Informed consent was provided by all participants prior to study participation.
Consent for publication Not applicable.
Competing interests
The authors declare that they have no competing interests.
Publisher’s Note
Springer Nature remains neutral with regard to jurisdictional claims in published maps and institutional affiliations.
Author details
1Department of Cancer Epidemiology and Prevention Research,
CancerControl Alberta, Alberta Health Services, Holy Cross Center, Room 514, Box ACB, 2210 2nd Street SW, Calgary, Alberta T2S 3C3, Canada.2Cancer Epidemiology and Intelligence Division, Cancer Council Victoria, Melbourne, VIC, Australia.3Centre for Epidemiology and Biostatistics, Melbourne School of Population and Global Health, The University of Melbourne, Melbourne, VIC, Australia.4Metabolic Epidemiology Branch, Division of Cancer Epidemiology and Genetics, National Cancer Institute, Bethesda, MD, USA. 5Faculty of Physical Education and Recreation, University of Alberta,
Edmonton, AB, Canada.6Departments of Oncology and Community Health Sciences, Cumming School of Medicine, University of Calgary, Calgary, AB, Canada.
Received: 24 November 2017 Accepted: 12 March 2018
References
1. Perk J, De Backer G, Gohlke H, Graham I, Reiner Z, Verschuren M, Albus C, Benlian P, Boysen G, Cifkova R, et al. European guidelines on cardiovascular disease prevention in clinical practice (version 2012). The fifth joint task force of the European Society of Cardiology and Other Societies on
cardiovascular disease prevention in clinical practice (constituted by representatives of nine societies and by invited experts). Eur Heart J. 2012; 33:1635–701.
2. Alves AJ, Viana JL, Cavalcante SL, Oliveira NL, Duarte JA, Mota J, Oliveira J, Ribeiro F. Physical activity in primary and secondary prevention of cardiovascular disease: overview updated. World J Cardiol. 2016;8:575–83. 3. Wahid A, Manek N, Nichols M, Kelly P, Foster C, Webster P, Kaur A,
Friedemann Smith C, Wilkins E, Rayner M, et al. Quantifying the association between physical activity and cardiovascular disease and diabetes: a systematic review and meta-analysis. J Am Heart Assoc. 2016;5 4. Smith AD, Crippa A, Woodcock J, Brage S. Physical activity and incident
type 2 diabetes mellitus: a systematic review and dose-response meta-analysis of prospective cohort studies. Diabetologia. 2016;59:2527–45. 5. Moore SC, Lee IM, Weiderpass E, Campbell PT, Sampson JN, Kitahara CM,
Keadle SK, Arem H, Berrington de Gonzalez A, Hartge P, et al. Association of leisure-time physical activity with risk of 26 types of cancer in 1.44 million adults. JAMA Intern Med. 2016;176:816–25.
6. Biswas A, Oh PI, Faulkner GE, Bajaj RR, Silver MA, Mitchell MS, Alter DA. Sedentary time and its association with risk for disease incidence, mortality, and hospitalization in adults: a systematic review and meta-analysis. Ann Intern Med. 2015;162:123–32.
7. de Rezende LF, Rey-Lopez JP, Matsudo VK, do Carmo Luiz O. Sedentary behavior and health outcomes among older adults: a systematic review. BMC Public Health. 2014;14:333.
8. Abdulnour J, Doucet E, Brochu M, Lavoie JM, Strychar I, Rabasa-Lhoret R, Prud'homme D. The effect of the menopausal transition on body composition and cardiometabolic risk factors: a Montreal-Ottawa new emerging team group study. Menopause. 2012;19:760–7.
9. Guthrie JR, Dennerstein L, Dudley EC. Weight gain and the menopause: a 5-year prospective study. Climacteric. 1999;2:205–11.
10. Hodson L, Harnden K, Banerjee R, Real B, Marinou K, Karpe F, Fielding BA. Lower resting and total energy expenditure in postmenopausal compared with premenopausal women matched for abdominal obesity. J Nutr Sci. 2014;3:e3.
11. Duval K, Prud'homme D, Rabasa-Lhoret R, Strychar I, Brochu M, Lavoie JM, Doucet E. Effects of the menopausal transition on energy expenditure: a MONET group study. Eur J Clin Nutr. 2013;67:407–11.
12. Canadian Society for Exercise Physiology: Canadian physical activity guidelines for adults - 18-64 years.Canadian society for exercise Physiology; 2011.
13. Colley RC, Garriquet D, Janssen I, Craig J, Tremblay MS. Physical activity of Canadian adults: accelerometer results from the 2007 to 2009 Canadian health measures survey. Health Rep. 2011;22:15–23.
14. de Roon M, van Gemert WA, Peeters PH, Schuit AJ, Monninkhof EM. Long-term effects of a weight loss intervention with or without exercise component in postmenopausal women: a randomized trial. Prev Med Rep. 2017;5:118–23.
15. Friedenreich CM, Woolcott CG, McTiernan A, Ballard-Barbash R, Brant RF, Stanczyk FZ, Terry T, Boyd NF, Yaffe MJ, Irwin ML, et al. Alberta physical activity and breast Cancer prevention trial: sex hormone changes in a year-long exercise intervention among postmenopausal women. J Clin Oncol. 2010;28:1458–66.
16. Liu-Ambrose TY, Khan KM, Eng JJ, Gillies GL, Lord SR, McKay HA. The beneficial effects of group-based exercises on fall risk profile and physical activity persist 1 year postintervention in older women with low bone mass: follow-up after withdrawal of exercise. J Am Geriatr Soc. 2005;53:1767–73. 17. Hertogh EM, Vergouwe Y, Schuit AJ, Peeters PH, Monninkhof EM. Behavioral
changes after a 1-yr exercise program and predictors of maintenance. Med Sci Sports Exerc. 2010;42:886–92.
18. Wang X, Nicklas BJ. Acute impact of moderate-intensity and vigorous-intensity exercise bouts on daily physical activity energy expenditure in postmenopausal women. J Obes. 2011;2011
19. Newman MA, Pettee KK, Storti KL, Richardson CR, Kuller LH, Kriska AM. Monthly variation in physical activity levels in postmenopausal women. Med Sci Sports Exerc. 2009;41:322–7.
20. Jordan AN, Jurca GM, Locke CT, Church TS, Blair SN. Pedometer indices for weekly physical activity recommendations in postmenopausal women. Med Sci Sports Exerc. 2005;37:1627–32.
22. Friedenreich CM, Neilson HK, O'Reilly R, Duha A, Yasui Y, Morielli AR, Adams SC, Courneya KS. Effects of a high vs moderate volume of aerobic exercise on adiposity outcomes in postmenopausal women: a randomized clinical trial. JAMA Oncol. 2015;1:766–76.
23. Friedenreich CM, Neilson HK, Ruan Y, Duha A, Courneya KS: Exercise dose effects on adiposity 12 months after an exercise intervention: follow-up from a randomized trial.BMC Obesity 2017,(Submitted).
24. Eaton LA. CONSORT Guidelines. In: Gellman MD, Turner JR, editors. Encyclopedia of behavioral medicine. New York, NY: Springer New York; 2013. p. 486–7.
25. Friedenreich CM, Neilson HK, Wang Q, Stancyzk FZ, Yasui Y, Duha A, MacLaughlin S, Kallal C, Forbes CC, Courneya KS. Effects of exercise dose on endogenous estrogens in postmenopausal women: a randomized trial. Endocr Relat Cancer. 2015;22:863–76.
26. Sasaki JE, John D, Freedson PS. Validation and comparison of ActiGraph activity monitors. J Sci Med Sport. 2011;14:411–6.
27. Freedson PS, Melanson E, Sirard J. Calibration of the computer science and applications, Inc. accelerometer. Med Sci Sports Exerc. 1998;30:777–81. 28. Choi L, Liu Z, Matthews CE, Buchowski MS. Validation of accelerometer wear
and nonwear time classification algorithm. Med Sci Sports Exerc. 2011;43: 357–64.
29. Ainsworth BE, Haskell WL, Herrmann SD, Meckes N, Bassett DR, Jr., Tudor-Locke C, Greer JL, Vezina J, Whitt-Glover MC, Leon AS: 2011 compendium of physical activities: a second update of codes and MET values.Med Sci Sports Exerc 2011, 43:1575–1581.
30. Lee JA, Gill J: Missing value imputation for physical activity data measured by accelerometer.Stat Methods Med Res 2016.
31. Friedenreich CM, Courneya KS, Neilson HK, Matthews CE, Willis G, Irwin M, Troiano R, Ballard-Barbash R. Reliability and validity of the past year Total physical activity questionnaire. Am J Epidemiol. 2006;163:959–70. 32. Lynch BM, Friedenreich CM, Khandwala F, Liu A, Nicholas J, Csizmadi I.
Development and testing of a past year measure of sedentary behavior: the SIT-Q. BMC Public Health. 2013;14:899.
33. Courneya KS, McKenzie DC, Mackey JR, Gelmon K, Friedenreich CM, Yasui Y, Reid RD, Vallerand JR, Adams SC, Proulx C, et al. Subgroup effects in a randomised trial of different types and doses of exercise during breast cancer chemotherapy. Br J Cancer. 2014;111:1718–25.
34. Kulinski JP, Khera A, Ayers CR, Das SR, de Lemos JA, Blair SN, Berry JD. Association between cardiorespiratory fitness and accelerometer-derived physical activity and sedentary time in the general population. Mayo Clin Proc. 2014;89:1063–71.
35. Drenowatz C, Gribben N, Wirth MD, Hand GA, Shook RP, Burgess S, Blair SN. The Association of Physical Activity during weekdays and weekend with body composition in young adults. J Obes. 2016;2016:8236439.
36. SAS software for Linux.Version 9.2 edition. Cary NC: SAS Institute Inc.; 2011. 37. Aparicio-Ting FE, Farris M, Courneya KS, Schiller A, Friedenreich CM.
Predictors of physical activity at 12 month follow-up after a supervised exercise intervention in postmenopausal women. Int J Behav Nutr Phys Act. 2015;12:55.
38. Courneya KS, McNeil J, O'Reilly R, Morielli AR, Friedenreich CM. Dose-response effects of aerobic exercise on quality of life in postmenopausal women: results from the breast Cancer and exercise trial in Alberta (BETA). Ann Behav Med. 2016;
39. Stone CR, Friedenreich CM, O'Reilly R, Farris MS, Vallerand JR, Kang D-W, Courneya KS: Predictors of adherence to different volumes of exercise in the breast Cancer and exercise trial in Alberta.Ann Behav Med2018, Submitted.
40. Gomersall SR, Maher C, English C, Rowlands AV, Dollman J, Norton K, Olds T. Testing the activitystat hypothesis: a randomised controlled trial. BMC Public Health. 2016;16:900.
41. Barnes KR, Kilding AE. Strategies to improve running economy. Sports Med. 2015;45:37–56.
42. Rogers LQ, Hopkins-Price P, Vicari S, Markwell S, Pamenter R, Courneya KS, Hoelzer K, Naritoku C, Edson B, Jones L, et al. Physical activity and health outcomes three months after completing a physical activity behavior change intervention: persistent and delayed effects. Cancer Epidemiol Biomark Prev. 2009;18:1410–8.
43. Riou ME, Jomphe-Tremblay S, Lamothe G, Stacey D, Szczotka A, Doucet E. Predictors of energy compensation during exercise interventions: a systematic review. Nutrients. 2015;7:3677–704.
44. Opdenacker J, Delecluse C, Boen F. A 2-year follow-up of a lifestyle physical activity versus a structured exercise intervention in older adults. J Am Geriatr Soc. 2011;59:1602–11.
45. Nicklas BJ, Gaukstern JE, Beavers KM, Newman JC, Leng X, Rejeski WJ. Self-monitoring of spontaneous physical activity and sedentary behavior to prevent weight regain in older adults. Obesity (Silver Spring). 2014;22:1406– 12.
46. Cadmus-Bertram L, Marcus BH, Patterson RE, Parker BA, Morey BL. Use of the Fitbit to measure adherence to a physical activity intervention among overweight or obese, postmenopausal women: self-monitoring trajectory during 16 weeks. JMIR Mhealth Uhealth. 2015;3:e96.
47. Cadmus-Bertram LA, Marcus BH, Patterson RE, Parker BA, Morey BL. Randomized trial of a Fitbit-based physical activity intervention for women. Am J Prev Med. 2015;49:414–8.
• We accept pre-submission inquiries
• Our selector tool helps you to find the most relevant journal • We provide round the clock customer support
• Convenient online submission • Thorough peer review
• Inclusion in PubMed and all major indexing services • Maximum visibility for your research
Submit your manuscript at www.biomedcentral.com/submit