R E S E A R C H
Open Access
Can insurance provide the US dairy farm safety
net?
Christopher A Wolf
1,3*and Nicole J Widmar
2* Correspondence:wolfch@msu.edu 1
Department of Agricultural, Food and Resource Economics, Michigan State University, East Lansing, MI 48824, USA
3
317A Morrill Hall of Agriculture, 446 West Circle Drive, East Lansing, MI 48824-1039, USA
Full list of author information is available at the end of the article
Abstract
US farm programs have been moving towards using insurance to provide the farm safety net for many years but this policy transformation has not been realized for dairy farms. Historically, support for dairy farmers focused on milk price but has been declining in real terms for decades. Dairy policy in the US has been in flux because of the recent increases in feed price levels and increases in export markets that have made historic milk price supports essentially irrelevant. Recently a program of subsidized insurance for the margin between milk and feed price has met with limited success. We analyze the potential demand for margin insurance using estimates from a survey of US dairy farmers. Dairy farmers with larger herds and more education were willing to pay more for the insurance. In addition, those dairy farm operators who had used milk and feed price risk instruments in the past were willing to pay more for margin insurance than those who had not. However, the willingness-to-pay for these contracts by farmers who had not used risk management tools was low, calling into question the feasibility of using margin insurance as the foundation of policies intended to support all dairy farms.
Keywords:Dairy farms; Dairy policy; Margin insurance; Price support; Willingness-to-pay
Introduction
U.S. agricultural policy has been experiencing a long-term shift towards insurance and away from traditional commodity programs with price supports and deficiency payments. Total government spending on farm safety net programs which include both commodity programs and crop insurance fell by two-thirds from fiscal years 2000 to 2012 (Crop Insurance in America, 2013). This reduction took place as spending on commodity programs was replaced by crop insurance. Acknowledging this shift the U.S. Secretary of Agriculture stated that“…at the end of the day crop insurance is going to be the lynchpin of the safety net” (Vilsack, 2013). This sentiment was echoed by the Administrator of the U.S. Department of Agriculture Risk Management Agency who noted that in the 2014 farm bill insurance would be“…the only title that will see a significant increase in spending”(Willis, 2014).
Congress first authorized crop insurance in the 1930’s in the period after the Great Depression that was the beginning of many agricultural policies that still exist today (Glauber, 2013). Crop insurance was mostly limited to major crops (e.g., corn) in the primary producing areas until the Federal Crop Insurance Act of 1980 (U.S. Department of Agriculture, Risk Management Agency USDA-RMA 2013c). The 1980 Act expanded crops and areas eligible for insurance and authorized a 30 percent subsidy of the
crop insurance premium. Even though crop insurance expanded, ad hoc disaster pay-ments remained common. In 2000 legislation was enacted which expanded the role of the private sector in developing new contracts, premium subsidies were increased, and re-strictions on the development of livestock (and dairy) insurance products were removed. The result is that acres covered by crop insurance increased from 45 million in 1981 to 272 million in 2008 (Goodwin and Smith, 2013). The majority of U.S. corn, soybeans and wheat acres have been insured in recent years. Thus, the largest crops by acres cultivated and sales have been largely covered by crop insurance policies. The same cannot be said, however, for specialty crops, livestock, and dairy production.
With respect to livestock and dairy enterprises, the development and adoption of in-surance following the easing of restrictions in 2000 has been slow. An effort was made following the 2008 Farm Bill to increase availability of insurance instruments for live-stock and dairy to provide a foundation for the safety net policies. Livelive-stock Gross Margin Insurance for Dairy (LGM-Dairy) was introduced to a limited set of states in 2008 and expanded broadly in 2010 (Gould and Cabrera, 2011). Dairy farmer participa-tion has been limited and calls into quesparticipa-tion the ability of this type of voluntary insur-ance tool to be the foundation of US dairy safety net programs. Key considerations include whether dairy farmers would purchase margin insurance broadly, how much dairy farmers would pay for margin insurance, and what socio-economic factors relate to those farm operators who would purchase margin insurance.
In order to answer these questions a survey of dairy farmers was conducted in five states that together accounted for more than 40% of US production. In addition to collecting farm and operator demographic data, contingent valuation questions were employed to allow estimation of producer willingness-to-pay for dairy margin insur-ance. The next section briefly reviews major US dairy policies and the trend away from government support. The third section discusses the survey and data, respondent demographics, estimation of willingness-to-pay for margin insurance, and examines estimation results and policy implications. The final section summarizes our findings and draws conclusions relevant for dairy producers, policy makers, and agricultural industries more broadly.
Background
U.S. federal dairy policies in large part originated in Farm Bill legislation of the 1930’s as part of the New Deal (Manchester, 1983; Chouinard, et al., 2010). While there are many policies that relate to the dairy industry, the policies that most directly supported the farm milk price include the dairy price support program and the Milk Income Loss Contract (MILC) programa.
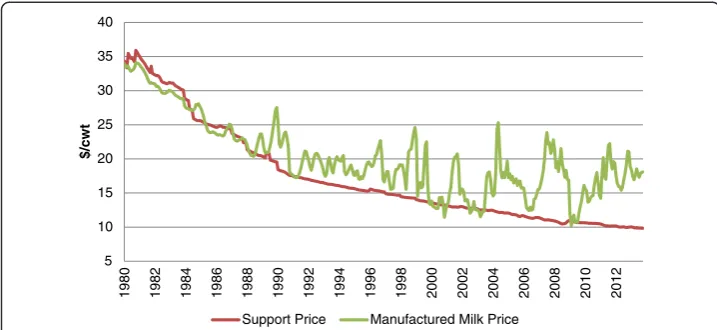
farm milk prices at a floor—$9.80 per hundredweight for 3.5% butterfat milk in recent years—by purchasing the aforementioned dairy products. Chavas and Kim (2004) con-cluded that the Dairy Price Support Program reduced milk price volatility and affected milk price levels even during periods when the support prices were not binding. The DPSP was criticized in recent years for curbing product diversity and innovation, sup-porting world dairy product prices, and being generally insufficient for U.S. farm prices at current feed costs (Shields, 2011; Food and Agricultural Policy Research Institute Dairy Policy Alliance, 2010). Increased farm milk price volatility and higher feed costs are primary drivers of the recent efforts to support dairy margins between milk and feed prices rather than only milk price.
The Milk Income Loss Contract (MILC) program originated in the 2002 Farm Security and Rural Investment Act (2002 Farm Bill). The MILC program was a counter-cyclical dairy income support that paid producers a proportion (45 or 34 percent depending on the year) of the difference between the reference and actual milk prices (i.e., a deficiency payment). Farm payments were initially capped at 2.4 million pounds annually. The MILC program was renewed in the 2008 Farm Bill when payments limits were increased to 2.985 million pounds per farm and an adjuster was added that increased payments when feed costs were above a trigger level (U.S. Department of Agriculture, Farm Service Agency, 2013). The financial assistance provided by the program meant that total milk production would not decline as much when milk prices were depressed as herds would have less incentive to cut back production (Jesse, 2005).
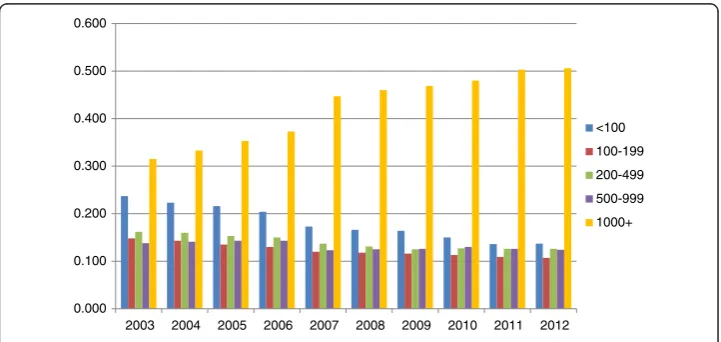
Payment limits meant that the MILC program disproportionately assisted smaller herds as they could receive payments on most (or all) of their production. Additionally, increasing herd sizes and concentration of farm-level milk production made the MILC program less relevant to total milk production over time. The average U.S. milk cow produces approximately 20,000 pounds of milk per year, thus the 2.4 million pound annual cap translated to 120 milk cows and the 2.985 million pounds translated to approximately 150 milk cows. As Figure 2 demonstrates, the percent of operations that likely had all milk production covered in the period the MILC program existed has declined over time but still constitute a majority. That is, operations with less than 100
5 10 15 20 25 30 35 40
1980 1982 1984 1986 1988 1990 1992 1994 1996 1998 2000 2002 2004 2006 2008 2010 2012
$/cwt
Support Price Manufactured Milk Price
milk cows represented 78.3 percent of all operations with milk cows in 2003 and de-clined to 74.1 percent of production by 2012. Meanwhile, large operations (with 1,000 or more milk cows) represented only 1.5 percent of all operations with milk cows in 2003 and doubled to 3.0 percent in 2012 (U.S. Department of Agriculture and National Agricultural Statistics Service USDA-NASS 2013b). The amount of milk production from the herds completely covered by MILC, however, is a different story. As illustrated by Figure 3, operations with less than 100 milk cows produced 23.7 percent of all milk production in 2003 and only 13.7 percent in 2012 (U.S. Department of Agriculture, National Agricultural Statistics Service, 2013a). Operations with 1,000 or more milk cows produced only 31.5 percent of all milk production in 2003 but a majority, 50.6 percent, in 2012. Thus, for operations producing a majority of U.S. milk production, the income protection offered by the MILC program covered only a fraction of farm-level production. The MILC program was repealed in the 2014 Farm Bill.
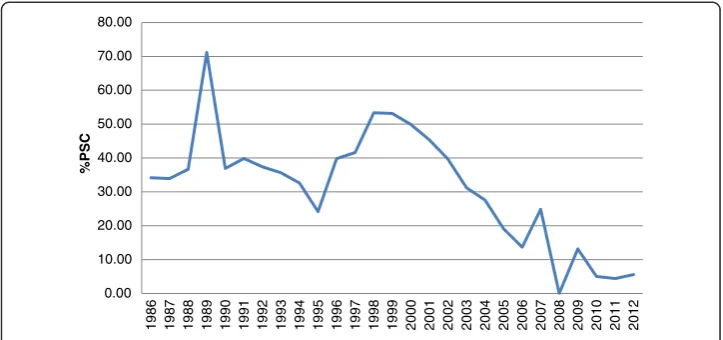
As can be surmised by the declines in the real price of the dairy price support pro-gram and percent of milk production covered by the deficiency payments in the MILC program, government support for U.S. dairy farms has declined in recent years. Using OECD data, we can measure how much this support declined. Figure 4 displays the percent of producer single commodity transfers to U.S. milk producers relative to gross
0.000 0.100 0.200 0.300 0.400 0.500 0.600 0.700 0.800 0.900
2003 2004 2005 2006 2007 2008 2009 2010 2011 2012 <100
100-199
200-499
500-999
1000+
Figure 2Percent of operations with milk cows by herd size, 2003–2012.
0.000 0.100 0.200 0.300 0.400 0.500 0.600
2003 2004 2005 2006 2007 2008 2009 2010 2011 2012 <100
100-199
200-499
500-999
1000+
farm milk receipts from 1986 through 2012 (OECD, 2013). Producer Single Commodity Transfers are defined as the annual monetary value of gross transfers from consumers and taxpayers to agricultural producers, measured at the farm gate level, arising from policies linked to the production of a single commodity such that the producer must produce the designated commodity in order to receive the transfer (OECD, 2013). Percentage Producer Single Commodity Transfers (%PSC) are the commodity transfers as a share of gross receipts for the specific commodity. For U.S. milk producers, the %PSC declined to zero in 2008 and has been below 10 percent in recent years. This decline in price support and direct payments fits the general movement in U.S. agricul-ture policy to move away from or end direct payments.
Coinciding with this decrease in support was an increase in milk and feed price vola-tility. One measure of the variation of milk and feed prices at the farm level is income over feed cost, a commonly used proxy for dairy farm profitability. The margin between milk price and feed cost is the amount available to pay for all other expenses, including labor and returns to management, capital, and unpaid labor. Measuring income over feed cost as the US all milk price less a weighted cost for corn and soybeans from 1990 through 2012, this monthly income over feed cost measure averaged $11 per hundred-weight. From 1990 through 1999 the monthly coefficient of variation—the standard deviation divided by the mean as a measure of percent variation—of this margin was 13.6%. From 2000 through 2012 the coefficient of variation increased to 20.4%. This variation in profit margin occurred because variation increased in both the milk and feed prices. Increased volatility in milk and feed prices in recent years has financially stressed many dairy farms and led to calls for government programs to assist them. Dairy margin insurance has been proposed as one option to hold the dairy farm safety netc.
Dairy margin insurance
In 2007, the Federal Crop Insurance Corporation approved the establishment of the Livestock Gross Margin insurance program for dairy farms (LGM-Dairy). This program became available in August 2008 for dairy producers in 31 states. In July 2010, LGM-Dairy availability was expanded to all of the lower 48 states (Gould and Cabrera, 2011). LGM-Dairy allows dairy farm operators to purchase insurance to protect against
0.00 10.00 20.00 30.00 40.00 50.00 60.00 70.00 80.00 19 86 19 87 19 88 19 89 19 90 19 91 19 92 19 93 19 94 19 95 19 96 19 97 19 98 19 99 20 00 20 01 20 02 20 03 20 04 20 05 20 06 20 07 20 08 20 09 20 10 20 11 20 12 % PSC
unanticipated low gross milk margins defined as the difference between estimated milk revenue and feed costs. Under this insurance policy, an indemnity at the end of coverage period is the difference, if positive, between the market anticipated gross margins at con-tract purchase and actual gross margins. The milk revenues and feed costs protected are based on current futures contract settle prices that exist at insurance sign-up. Chicago Mercantile Exchange (CME) Class III milk, corn, and soybean meal futures and options markets are used as an information source in the setting of premiums and to determine insurance indemnities at the end of the contract. The contract premiums are estab-lished to be actuarially sound in the sense that over the long-run, the expected in-demnities paid equal premiums before subsidy is applied (Gould and Cabrera, 2011). Past research has highlighted the importance of premium subsidies for dairy margin insurance (Valvekar et al., 2011).
Advantages of LGM-Dairy over traditional milk price supports and deficiency pay-ments include that the insurance program: protects margin between milk and feed; has premiums which mean that farmers share in the cost which should help align behav-ioral incentives; the premiums are set by milk and feed futures and options market which incorporate current market information; allows for the amounts of milk and feed protected to change over time as the farmer desires; allows dairy farmers to scale it to their needs rather than the contract sizes at the exchanges, and this insurance instru-ment is expected to have no more than minimal effects on production decisions. In addition, from the farmer’s perspective as there are no actual futures market transac-tions there are no corresponding futures market margin calls.
Disadvantages of LGM-Dairy in holding the dairy farm safety net include: limited availability and funding for premium subsidy; lack of knowledge and understanding in the dairy farm industry regarding the insurance instrument; lack of institutional experi-ence in dairy markets using such instrument products; and the local milk and feed prices can vary substantially from the national benchmarks used (basis risk).
LGM-Dairy sales summary statistics are available since the 2008 market year. Over this period the peak sales year was 2010 when the 46.2 million hundredweight of cover-age sold represented 2.4% of the amount of milk produced in the U.S. that year (U.S. Department of Agriculture, Risk Management Agency 2014). Part of the low participa-tion was due to lack of funding levels in some periods. Other reasons farmers have not used LGM-Dairy include lack of knowledge and perceived difficulty of use (Wolf and Widmar, 2014). Given this relatively low level of participation, can this instrument hold the safety net? Would this insurance be widely purchased? What are the characteristics of the farms that would be willing to pay for it? And how much would they be willing to pay? In order to answer these questions, we surveyed dairy farms in five major milk producing states.
Methods
of licensed operations), 410 from Indiana (25% of licensed operations), 450 from Michigan (25% of licensed operations), and 984 from Wisconsin (10% of licensed op-erations). Together these states accounted for 40.9% of U.S. milk production in 2012 (U.S. Department of Agriculture and National Agricultural Statistics Service USDA-NASS 2013b). The tailored survey method was employed with an initial survey in May 2012 followed by a reminder card two weeks later and a second survey two weeks after the reminder (Dillman et al. 2009).
Respondents identified dairy farm operator characteristics (age, education, experi-ence), and operation characteristics including herd size, crop acreage, percent of feed purchased, farm business organization, cooperative membership, and farm financial solvency situation. Dairy producer respondents were also asked whether they had utilized milk or feed price instruments at any point in the past. Of the 2,419 farms surveyed, 662 were returned for a 27.4% response rate. By state the response rate ranged from 16.5% in California to 34.1% in Indiana.
The survey also included basic information on margin insurance and a question to elicit willingness-to-pay for margin insurance as follows:
“Currently, there exists insurance to protect the margin between milk and feed price. In this section, we are interested in whether you would purchase an insurance policy that protects a margin between Class III milk price and corn and soybean meal prices.
There are many ways that the margin between milk and feed price can be calculated. LGM-Dairy, for example, uses the Class III milk price futures from the Chicago
Mercantile Exchange as well as corn and soybean meal futures from the Chicago Board of Trade to create a margin.
Consider an insurance policy similar to LGM-Dairy that establishes a minimum income over feed cost for the next 12 months using Class III milk, corn, and soybean meal futures. The margin guarantee is the floor for the difference between milk and feed prices given the quantity of feed protected. That is, if the actual margin between closing futures milk and feed prices falls below the margin guarantee, you will be paid the difference.
The premium rate is the amount that you will pay—per hundredweight of milk protected—for the insurance regardless of whether you end up collecting an indemnity or not.
Experience from previous similar surveys is that people often agree to pay more in hypothetical questions than they would actually pay. It is important that you answer as if you were actually facing these choices in your farm management decisions.
If an insurance policy is offered with a margin guarantee between milk price and feed cost of$X/cwtand the premium (price) is$Y/cwton covered milk production, would you be willing to purchase the insurance?”
Because the survey offers a hypothetical decision without the exchange of goods or money, the following cheap talk statement was provided to respondents, “Experience from previous similar surveys is that people often agree to pay more in hypothetical questions than they would actually pay. It is important that you answer as if you were actually facing these choices in your farm management decisions.” This statement is part of a“cheap-talk strategy”to attempt to reduce hypothetical bias by simply inform-ing participants of the bias before their participation in the experiment (Lusk, 2003).
Using information for LGM-Dairy insurance that was available at the time the survey was conducted (April 2012), the relevant range of margins and premiums offered by the market at that time was derived—plus an allowance on each side to encompass reasonable possibilities. The result was that the margin (X) varied from $2 to $14 per hundredweight of milk production in $2 increments. The premium (Y) varied from $0.10 to $1.30 per hundredweight of milk in $0.30 increments. With seven margins and five premiums, there were 35 potential combinations which were assigned randomly across the surveys.
The probability of a“Yes”response to the single-bound question depends on the probabil-ity that the willingness-to-pay (WTP) with random error is greater than the premium given
Pr Yesð Þ ¼ Pr WTPð þe> $y=cwtÞ: ð1Þ
Wheneis distributed normally the discrete choice estimation is performed using a probit model. All else equal (i.e., margin), the probability of a“Yes”response is expected to vary inversely with the premium cost. The probit model is defined as Pr(y≠0|x) =Φ(xb) where
Φ is the standard cumulative normal distribution. The probit model has the estimation form y = b’x + e, where y= 0 for farmers who answered “No” to the insurance purchase question;y= 1 for farmers who answered“Yes”to the insurance purchase question;xis a vector of explanatory variables; andbis a vector of coefficients.
Results and discussion
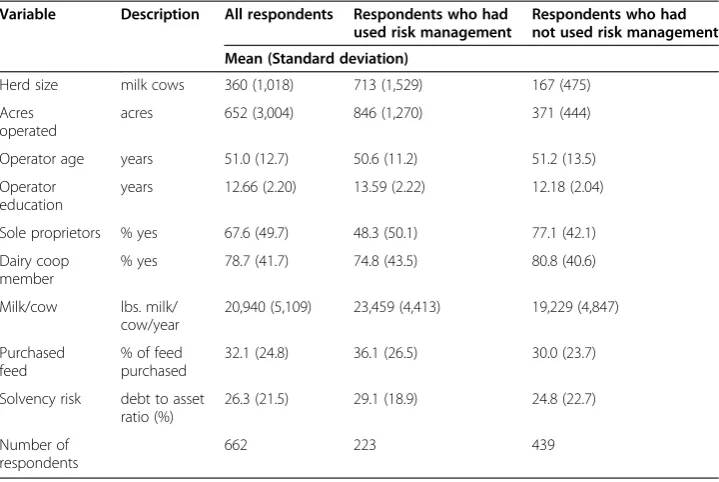
Summary characteristics of the sample farms are displayed in Table 1. These statistics reflect expected patterns in operation and operator characteristics consistent with national summaries from USDA. For example, the largest herds on average were managed by re-spondents in California and Florida. Indiana rere-spondents had the smallest average herd size and youngest average operator age. Operator education was, on average, higher in California and Florida respondents. The percent of sole proprietors (as opposed to partnerships, limited liability companies, and incorporated operations) were higher in the Upper Midwest states than in California and Florida. California and Florida also purchased a larger percent of their feed requirements and had higher debt to asset ratios on average. The operation and operator characteristics summarized in Table 1 are used below as explanatory variables in the estimations to explain margin insurance purchase decisions.
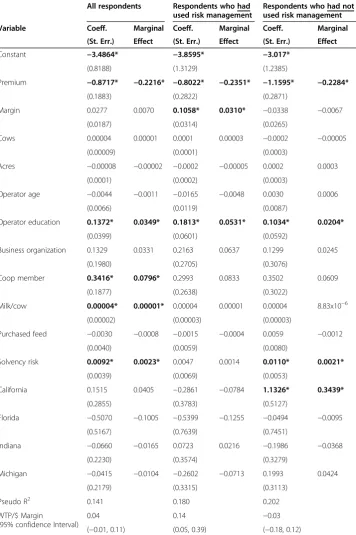
organized as a sole proprietorship, purchased a higher percent of their feed, and had a slightly higher debt to asset ratio.
The results of the probit estimation are displayed in Table 2. As the probit coeffi-cients are not particularly intuitive, marginal effects of the explanatory variables are also provided in Table 2. The first pair of results columns contain estimates across all respondents while the final two pairs of columns display conditional results for those farms that had and had not used risk management tools. With respect to all respon-dents, the premium charged had a significant, negative sign. The margin offered between milk and feed price (a proxy for profit margin protected) was not significant. Operator education, milk marketing cooperative membership, milk production per cow, and solvency risk (i.e., a high debt-to-asset) ratio all had positive effects on the likelihood that respondents would purchase the margin insurance offered.
The second and third pairs of columns are the same estimation with the sample di-vided into those farm managers who had utilized risk management tools and those who had not. Respondents who had used price risk management tools were more likely to purchase the offered margin insurance if they had more years of operator education. In contrast to the group of respondents who had not used risk management tools, how-ever, the margin level for those who had used price risk management tools was positive and significant. All else constant, a higher margin offers more profit protection. Respondents who had not used risk management tools were more likely to purchase the offered insurance as operator education increased and as they were closer to insolv-ency. Further, California respondents who had not used risk management tools were more likely to purchase the offered insurance than were Wisconsin respondents (the omitted State category).
Willingness-to-pay (WTP) per dollar of margin offered was calculated as
W T PMargin¼− ββMargin
Premium
; where the coefficient on the margin variable is divided by the Table 1 Summary statistics
Variable Description All respondents Respondents who had used risk management
Respondents who had not used risk management
Mean (Standard deviation)
Herd size milk cows 360 (1,018) 713 (1,529) 167 (475)
Acres operated
acres 652 (3,004) 846 (1,270) 371 (444)
Operator age years 51.0 (12.7) 50.6 (11.2) 51.2 (13.5)
Operator education
years 12.66 (2.20) 13.59 (2.22) 12.18 (2.04)
Sole proprietors % yes 67.6 (49.7) 48.3 (50.1) 77.1 (42.1)
Dairy coop member
% yes 78.7 (41.7) 74.8 (43.5) 80.8 (40.6)
Milk/cow lbs. milk/ cow/year
20,940 (5,109) 23,459 (4,413) 19,229 (4,847)
Purchased feed
% of feed purchased
32.1 (24.8) 36.1 (26.5) 30.0 (23.7)
Solvency risk debt to asset ratio (%)
26.3 (21.5) 29.1 (18.9) 24.8 (22.7)
Number of respondents
coefficient on the premiums (i.e., the price). Across all respondents the mean WTP was $0.04 per dollar of margin offered (e.g., $0.40/cwt for a $10/cwt margin). Respon-dents who had used price risk tools had a mean WTP of $0.13/cwt margin while those who had not used risk tools had a negative WTP. A negative WTP indicates that they would need to be compensated to take the margin insurance. That is, they Table 2 Probit estimates of margin insurance purchase and WTP/$ Margin
All respondents Respondents who had used risk management
Respondents who had not used risk management
Variable Coeff. Marginal Coeff. Marginal Coeff. Marginal
(St. Err.) Effect (St. Err.) Effect (St. Err.) Effect
Constant −3.4864* −3.8595* −3.017*
(0.8188) (1.3129) (1.2385)
Premium −0.8717* −0.2216* −0.8022* −0.2351* −1.1595* −0.2284*
(0.1883) (0.2822) (0.2871)
Margin 0.0277 0.0070 0.1058* 0.0310* −0.0338 −0.0067
(0.0187) (0.0314) (0.0265)
Cows 0.00004 0.00001 0.0001 0.00003 −0.0002 −0.00005
(0.00009) (0.0001) (0.0003)
Acres −0.00008 −0.00002 −0.0002 −0.00005 0.0002 0.0003
(0.0001) (0.0002) (0.0003)
Operator age −0.0044 −0.0011 −0.0165 −0.0048 0.0030 0.0006
(0.0066) (0.0119) (0.0087)
Operator education 0.1372* 0.0349* 0.1813* 0.0531* 0.1034* 0.0204*
(0.0399) (0.0601) (0.0592)
Business organization 0.1329 0.0331 0.2163 0.0637 0.1299 0.0245
(0.1980) (0.2705) (0.3076)
Coop member 0.3416* 0.0796* 0.2993 0.0833 0.3502 0.0609
(0.1877) (0.2638) (0.3022)
Milk/cow 0.00004* 0.00001* 0.00004 0.00001 0.00004 8.83x10⁻⁶
(0.00002) (0.00003) (0.00003)
Purchased feed −0.0030 −0.0008 −0.0015 −0.0004 0.0059 −0.0012
(0.0040) (0.0059) (0.0080)
Solvency risk 0.0092* 0.0023* 0.0047 0.0014 0.0110* 0.0021*
(0.0039) (0.0069) (0.0053)
California 0.1515 0.0405 −0.2861 −0.0784 1.1326* 0.3439*
(0.2855) (0.3783) (0.5127)
Florida −0.5070 −0.1005 −0.5399 −0.1255 −0.0494 −0.0095
(0.5167) (0.7639) (0.7451)
Indiana −0.0660 −0.0165 0.0723 0.0216 −0.1986 −0.0368
(0.2230) (0.3574) (0.3279)
Michigan −0.0415 −0.0104 −0.2602 −0.0713 0.1993 0.0424
(0.2179) (0.3315) (0.3113)
Pseudo R2 0.141 0.180 0.202
WTP/$ Margin
(95% confidence Interval)
0.04 0.14 −0.03
(−0.01, 0.11) (0.05, 0.39) (−0.18, 0.12)
had an aversion to purchasing margin insurance. For comparison, the average margin paid from 2009 through 2012 for LGM-Dairy insurance varied from $0.42 to $0.71/ cwt (U.S. Department of Agriculture and Risk Management Agency USDA-RMA 2014). Thus, those with previous experience with risk management tools were willing to pay reasonable premiums for insurance. However, they constituted a minority of respondents.
To calculate confidence intervals we employed the method of Krinsky and Robb (1986). One thousand observations were drawn from a multivariate normal distribution which was parameterized with the coefficients and variance-covariance matrix from the respective probit estimations. The resulting 95 percent confidence intervals indicate that only those respondents who had previously used risk management tools had a strictly positive WTP—about 5 cents to 39 cents per hundredweight of margin offered.
With the long-term movement towards insurance rather than direct payments in US agricultural policy, the question of whether this can work in areas not traditionally cov-ered by crop insurance instruments such as milk production must be answcov-ered. Past research has indicated that the most significant impediment to the use of crop insur-ance is the complexity of the instruments and lack of understanding on the part of farm operators (Coble et al. 2013). Dairy margin insurance is a complex risk manage-ment tool that may substitute for or complemanage-ment existing risk managemanage-ment efforts. Thus, should margin insurance be utilized as the primary dairy farm safety policy, educational programs would be critical to achieve wide-spread dairy farmer adoption.
Further, it might take considerable subsidies—perhaps up to 100 percent—to get many of the smaller herds that had not previously used risk management tools to pur-chase this margin insurance. Recall from Figure 3 that while the majority of the milk production comes from herds with 1,000 or more milk cows, those herds comprise only three percent of total herds. Thus, the majority of the herds represent a minority of the actual milk production. The previously discussed MILC program was intentionally slanted towards smaller dairy herds. In contrast, a subsidized insurance program with no production limit will help larger herds more than the MILC program.
Conclusions
U.S. dairy policy has a long history of intervention with the aim of supporting farm income. Historically, these policies have focused on milk price but the price support has been irrelevant in recent years and—along with the MILC program—recently was repealed. At the same time, feed price increases and volatility have caused the focus for dairy farm protection to shift to the margin between milk and feed prices. The long-run movement towards insurance for major US field crops has until recently excluded dairy. This research examined whether margin insurance could be the primary policy that provides income protection to dairy farms.
historically accustomed to receiving protection in the form of milk price support and deficiency payments were less likely to be willing to pay for their own insurance. Con-sistent with past research that uses hypothetical questions, we must be cognizant that the stated preference approach can suffer from bias. Thus, it would be appropriate to consider these willingness-to-pay estimates to be upper bound values.
The recently passed 2014 Farm Bill created a new Margin Protection Program that has similarities to the margin protection offered in the survey and some comparison is enlightening. While some refer to the new margin protection program as“insurance”it actually is not a true insurance program. The premiums are fixed rather than based on market assessments of risk. The fixed premiums range in price from free for a $4/cwt margin to $1.36/cwt for coverage of production over 4 million pounds at an $8/cwt margin. The existence of this margin protection program will likely diminish the demand for private risk management tools and margin insurance.
The LGM-Dairy program was also continued and dairy farmers will choose between the Margin Protection and LGM-Dairy Programs. At the time of the survey we analyze here, there was no margin protection program so this new program did not influence farmer response to our survey. Further, the Margin Protection Program is currently scheduled to terminate at the end of 2018. If the program is expensive, inef-fective, or unpopular, it may not be continued. The long-term movement towards more market oriented insurance instruments remains the dominant trend in US agri-cultural policy. Our results indicate a bifurcated response to dairy margin insurance across herd size and the need for more education to implement this policy as a foundation of the safety net.
Endnotes
a
At the time the survey and analysis were performed, the 2014 Farm Bill had not passed into law and there was a great deal of uncertainty about the future direction of US dairy policy. The 2014 Farm Bill created the Margin Protection Program for Dairy Producers (MPP-Dairy) which provides margin protection at subsidized rates. Livestock Gross Margin Insurance for Dairy continues to exist.
b
The Dairy Product Price Support Program was renamed the Dairy Product Price Support Program in 2008 and repealed as part of the 2014 Farm Bill. The Price Support Program remains part of the permanent law which will take effect in 2019 unless the current law is extended or new legislation is passed.
c
Dairy producers could also manage their own profit margin risk using bundles of milk and feed futures and options but this has disadvantages including lumpy contracts, thin markets and basis risk (Bozic et al. 2012).
Competing interests
The authors declare that they have no competing interests.
Authors’contributions
CW conceived the study, performed the survey, and drafted the manuscript; NW participated in the design of the study, performed statistical analysis, and edited the manuscript. All authors read and approved the final manuscript.
Acknowledgements
Author details
1
Department of Agricultural, Food and Resource Economics, Michigan State University, East Lansing, MI 48824, USA.
2Department of Agricultural Economics, Purdue University, 403 West State Street, West Lafayette, IN 47907, USA.3317A
Morrill Hall of Agriculture, 446 West Circle Drive, East Lansing, MI 48824-1039, USA.
Received: 21 November 2014 Accepted: 11 March 2015
References
Bozic M, Newton J, Thraen C, Gould B (2012) Mean Reversion in Income over Feed Cost Margins: Evidence and Implications for Managing Margin Risk by U.S. Dairy Producers. Staff Paper P12-6. Department of Applied Economics, University of Minnesota
Chavas J, Kim K (2004) A heteroskedastic multivariate Tobit analysis of price dynamics in the presence of price floors. Am J Agric Econ 86:576–593
Chouinard H, Davis D, LaFrance J, Perloff J (2010) Milk Marketing Order Winners and Losers. Applied Economic Perspectives and Policy 32:59–76
Coble K, Barnett B, Riley J (2013) Challenging Belief in the Law of Small Numbers. Paper presented at Agricultural and Applied Economics Association 2013 Crop Insurance and the Farm Bill Symposium, Louisville Oct 2013. Agricultural and Applied Economics Association, Milwaukee WI, USA. Paper available at: http://ageconsearch.umn.edu/handle/ 156958
Crop Insurance America (2013) Total Farm Safety Net Spending Drops by Two-Thirds as More Farmers Purchase Crop Insurance. http://www.cropinsuranceinamerica.org/total-farm-safety-net-spending-drops-by-two-thirds-as-more-farmers-purchase-crop-insurance/#.VRwQ4U03OCQ Accessed 19 March 2014
Dillman D, Smyth J, Christian L (2009) Internet, Mail and Mixed-Mode Surveys: The Tailored Design Method. John Wiley & Sons, Hoboken
Food and Agricultural Policy Research Institute: Dairy Policy Alliance (2010) Dairy Policy Issues for the 2012 Farm Bill. https://mospace.umsystem.edu/xmlui/handle/10355/8784 Accessed 20 December 2013
Glauber J (2013) The Growth of the Federal Crop Insurance Program, 1990–2011. Am J Agric Econ 95:482–488 Goodwin B, Smith V (2013) What Harm is Done by Subsidizing Crop Insurance? Am J Agric Econ 95:489–497 Gould B, Cabrera V (2011) USDA’s Livestock Gross Margin Insurance for Dairy: What is it and How Can it be Used for
Risk Management? Department of Agricultural and Applied Economics, University of Wisconsin-Madison, Madison, WI, USA. Paper available at: http://future.aae.wisc.edu/lgm-dairy/lgmdairymanual.pdf
Helmberger P, Chen Y (1994) Economic effects of U.S. dairy programs. J Agric Resour Econ 19:225–238 Jesse E (2005) Dairy policy in the next farm bill: An early assessment. Marketing and Policy Briefing Paper No. 89,
University of Wisconsin Extension, Madison, WI, USA
Krinsky I, Robb A (1986) On Approximating the Statistical Properties of Elasticities. Review of Economics and Statistics 64:715–719
Lusk J (2003) Effects of cheap talk on consumer willingness-to-pay for golden rice. Am J Agric Econ 85:840–856 Manchester A (1983) The Public Role in the Dairy Economy. Westview, Boulder
Organization for Economic Cooperation and Development (OECD) (2013) Producer and Consumer Support Estimates Database. http://www.oecd.org/tad/agricultural-policies/producerandconsumersupportestimatesdatabase.htm Accessed 17 March 2014
Shields D (2011) Dairy Farm Support: Legislative Proposals in the 112thCongress. Congressional Research Service Report R42065, Washington DC
U.S. Department of Agriculture, Farm Service Agency (USDA-FSA) (2013). Milk Income Loss Contract Program Fact Sheet. Washington DC, USA
U.S. Department of Agriculture, National Agricultural Statistics Service (USDA-NASS). 2013a. Agricultural Prices. Annual Issues 1993–2012. http://usda.mannlib.cornell.edu/MannUsda/viewDocumentInfo.do?documentID=1002 Accessed 18 December 2013
U.S. Department of Agriculture, National Agricultural Statistics Service (USDA-NASS). 2013b. Milk Production. http:// usda.mannlib.cornell.edu/MannUsda/viewDocumentInfo.do?documentID=1103 Accessed 19 December 2013 U.S. Department of Agriculture, Risk Management Agency (USDA-RMA). 2013c. History of the Crop Insurance Program.
http://www.rma.usda.gov/aboutrma/what/history.html Accessed 17 March 2014
U.S. Department of Agriculture, Risk Management Agency (USDA-RMA). 2014. Federal Crop Insurance Corporation Summary of Business. Dairy-Livestock Gross Margin Insurance. http://prodwebnlb.rma.usda.gov/apps/SummaryOf-Business Accessed 17 March 2014
Valvekar M, Chavas J, Gould B, Cabrera V (2011) Revenue risk management, risk aversion, and the use of Livestock Gross Margin for Dairy Cattle insurance. Agr Syst 104:671–678
Vilsack T (2013) U.S. Department of Agriculture Tele-Conference. November 21. U.S. Department of Agriculture, Washington DC, USA
Willis B (2014) Lynch Pin of the Safety Net. Red River Farm Network. Available online: http://www.rrfn.com/news.php Accessed 17 March 2014