R E S E A R C H
Open Access
Improving diffusion in agriculture: an
agent-based model to find the predictors
for efficient early adopters
Angela Barbuto, Antonio Lopolito and Fabio Gaetano Santeramo
** Correspondence:
Department of the Sciences of Agriculture, Food and Environment, University of Foggia, Via Napoli n.25, 71122 Foggia, Italy
Abstract
Proven that the adoption rate of a new product is influenced by the network characteristics of the early adopters, the aim of this paper is to find the network features of the early adopters associated with high adoption rates of a specific new practice: the use of biodegradable mulching films containing soluble bio-based substances derived from municipal solid wastes. We simulated the diffusion process by means of an agent-based model calibrated on real-world data. Closeness and clusterization emerged as the most important network characteristics for early adopters to be successful. The results achieved represent the basis for the breaking down of a tailored diffusion strategy to overcome the psychological and socio-economic barriers of this kind of innovation within an environmental and sustainability-oriented transition policy in a rural context.
Introduction
The bio-waste valorization is becoming an increasingly urgent priority for governments and environmental and social organizations (Morone et al.2015). In this respect, the atten-tion is mainly focused on the organic fracatten-tion of municipal and agricultural waste that can be used as raw material for biodegradable products (e.g., detergents, fuels, textile auxiliaries, plastic, fertilizers) (Motoneri et al.2014, Scaringelli et al.2016). Among these, a promising sustainable innovation is represented by biodegradable mulching films derived from soluble bio-based substances (SBOs) (Motoneri et al.2014). This technology is at a development stage (TRL14/5), and its future adoption by farmers can improve both the sustainability of agricultural practices and the waste management process. This introduces the issue of innovation diffusion, proven that the achievement of the abovementioned benefits strictly depends on the spread of the novelty among a critical mass of users.
Here, we stress that, at the core of the diffusion process, there are operation and functioning of the social networks (i.e., the set and pattern of support, friendship, and communication relations) connecting people (Valente1995). In fact, in its straightfor-ward definition, the diffusion of innovation can be intended as“a special type of com-munication, in that the messages are concerned with new ideas” (Rogers 2003: 5). Communication implies the mobilization of social ties among people to create and share information and reach a reciprocal understanding (Rogers2003). This process is fundamental in overcoming the innovation resistance that is the agents’ normal re-sponse against uncertainty and the costly readjustment activity imposed by the
innovation (Ram 1987). To put differently, the learning-from-others mechanism is likely to enhance the diffusion of innovation: this is true not only for innovations but also for farming strategies (Santeramo2018).
More in-depth, social networks can influence diffusion providing (1) the medium for the circulation of informationthat is crucial to make the agents aware about the nov-elty and its real costs and benefits; (2) a certain level of redundancy of the information, deriving from social reinforcement, that is useful in overcoming uncertainty; (3) a cer-tain level ofhomophilyamong actors (defined as the overlap degree of some agents at-tributes, such as education, socioeconomic status, and preferences) that favors common meanings, beliefs sharing, and mutual understandings (Rogers2003).
As a consequence, the ability of the agents to affect their neighbors’(i.e., the others with whom they are connected) adoption decision is closely related to their role and lo-cation in the network. The social network analysis (SNA) has developed various cen-trality measures to capture network characteristics of the agents. These cencen-trality measures can be considered by market operators and policymakers as a key driver to build effective promotional strategies. With this regard, the literature demonstrates that diffusion rates can vary greatly depending on the injection points (IPs) (i.e., the agents where the innovation is first injected, which are “early adopters”) used, according to their network centrality (Banerjee et al. 2013). This is particularly true in the case of diffusion of new sustainable practices in agriculture (Tey and Brindal2012).
In this perspective, this work represents a preliminary analysis of the network fea-tures which best predict effective IPs (i.e., those able to reach the highest adoption rates) in the case of a specific sustainable novelty, the SBO mulching films, in a rural context. The aim is to find those individual centrality measures that can be used as a rational criterion to select the best spreaders. The focus is on a community of farmers located in the north of Apulia (Italy) specialized in the production of vegetables. By means of an agent-based model (ABM), we simulated the effects of different IPs on the diffusion rates into an artificial community representing the one studied. In order to evaluate the robustness of our findings, we conduct a sensitivity analysis accounting for the possibility that the novelty disappoints a fraction of consumers. Moreover, we ap-plied the SNA to obtain measures of IPs’network characteristics. Finally, we adopted a multiple linear regression model to estimate the effect of the various centrality mea-sures of the IPs on the final adoption rates.
1999, Delre et al. 2007a, Goldenberg et al. 2009, Delre et al. 2010, Bohlmann et al.
2010, van Eck et al. 2011). Some of these models (Alkemande and Castaldi 2005,
Goldenberg et al. 2000, Delre et al.2007b; Bohlmann et al.2010) explicitly include an adoption threshold to represent the different propensity of potential consumers of a new product to adopt (Kiesling2012). Another type of models is devoted to simulating informational cascade (Banerjee 1992, Watts2002). These models depict the graduation of the diffusion dynamic where different classes of consumer gradually adopt the novelty according to a progressive fashion distinguishing early adopters, followers, and laggards. When the novelty spreads in the largest part of the network, it occurs as a cascade.
The paper is structured as follows: the “The diffusion model” section describes the model employed, its basic assumption, its construction, and internal dynamics; the
“Simulation and results” section reports the main results; and the “Concluding re
marks” section concludes with some discussion and policy implications, including also
suggestion for further research and some concluding remarks.
The diffusion model
For the sake of clarity, in what follows, we shall describe the model according to the “guidelines for model development”outlined in Rand and Rust (2011) aimed at setting a rigorous procedure for AB modeling. The logical basis of the model is provided by the following assumptions that cover all the relevant elements of the model inferences; moreover, the references after each statement provide the empirical basis for the as-sumptions (East et al.2016): (A1) Each agent has a specific innovation resistance, rep-resented by an individual adoption threshold (Nisbet and Collins 1978). (A2) For the adoption to occur, the agent’s preference toward the innovation must overcome its innovation threshold. (A3) To form a preference, the agent must be aware of the innovation existence and its advantages (Chen 1996; Daberkow and McBride 2003). (A4) The agent grasps relevant information to become aware of the preferences of his neighbors (agents connected with it) (Molina-Morales and Martinez-Fernandez 2010; Narayan and Pritchett 1999; Van Rijn et al. 2012). (A5) The more homophilous the neighbor is, the more pieces of information the agent will grasp from it (Centola 2010,
2011). (A6) The higher the agent’s education, the higher its capacity to grasp
informa-tion from its neighborhood as a whole (Gellynck et al. 2014; Tepic et al.2012).
Model design
model run, we have one IP, being the rest of the agent ordinaries. They are character-ized by different behaviors: The ordinaries represent farmers that have to decide whether to adopt or not. The IP represents a farmer which has already adopted the novelty and uses it over all the model time span since the initialization phase. Concern-ing the set of propertiesof the model’s elements, each link has a property representing the level of homophily between the agents connected [h], and each agent has a prefer-ence toward the new technology [p], an adoption threshold [θ], a level of education [e], and the innovation status [novelty?]. These properties represent also the basicinputsof the model, while the model fundamentaloutput is the number of ordinaries that have adopted at each time step.
Model construction
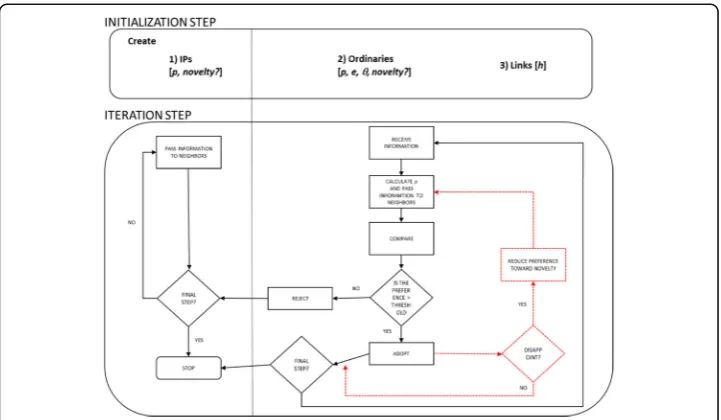
The model is structured into two phases: the initialization and the iteration. At the
initialization step,nagents andmlinks are created. At this phase,pis set at 0 for or-dinaries and 1 for IPs andθand eare set at specific values (see below). The innovation status is setfalsefor ordinaries andtruefor the IP. At eachiterationtime step, each or-dinary (1) reconsiders its preference after having received information from its neigh-bors,2(2) pass information to neighbors,3and (3) decides to adopt (i.e.,novelty?is set
true) ifp≥θ. This sequence is repeated until the model time span reaches the valuet. Concerning step 1, it is worth noting that the sole factor influencing the preference of an ordinary agent is the preferences of its neighbors. Specifically, at each timet, each ordinary i calculates its preference pit as the sum of its preference in the previous
period pit−1and the average of the preferences of itsjneighborspjtweighted with the
homophily degree with its neighbors hji. This sum is then corrected multiplying it by
the level of education ofi ei. Formally, the calculation ofpitis:
pit¼pit−1þ Xpjt−1hji n
CwithC¼ ei
maxe: ð
1Þ
It is worth noting that the time dimension in this process acts as an accumulator of the preference level allowing to unravel the interaction between network features and preference formation.
To augment the model reality, we developed also a disappointment extension, which introduces a common issue in the innovation adoption process, that is the probability that the novelty disappoints a fraction of users. To simulate this behavior, the disap-point version includes the possibility that the innovation disapdisap-points the adopter. When this case occurs, the model provides a possible third action for the ordinary agent, to reduce its preference of a variable % (between 25 and 75%) toward the novelty. In this version of the model, the disappointment is modeled as a random event which affects a variable fraction of the population (between 0 and 25%).
Model verification
The code flow was analyzed, and each piece of the code was tested to verify its correct functioning. In this phase, we also employed corner cases (extreme values of the inputs) to verify that the implemented model does not show aberrant behaviors (e.g., no adop-tion is realized without any IP).
Model calibration
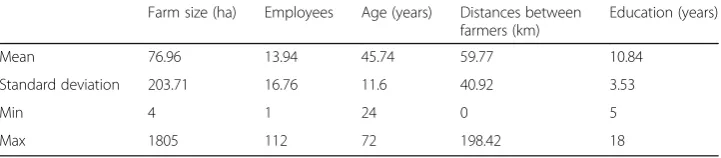
The identification of model parameters was based on a case from South Italy, located in the Province of Foggia. It relates to a group of specialized vegetable farmers (N= 80) which already use conventional or biodegradable mulching technique and are therefore potentially interested in the innovative use of SBO-derived films (Scaringelli et al. 2016). Sample size covers 2% of the population. This is a reasonable sample extension to obtain enough real-world data for the calibration of the model parameters. This case study is suitable to this end, prove that it offers a cross-section of the social and profes-sional interactions of vegetable crop farmers in this territory. Being the technology under investigation still at a development stage, no real adoption rate already exists. This is exactly what the ABM model addresses: to simulate the effect of various IPs on the final adoption rate. Thus, we used the case study with the sole purpose to calibrate the following model parameters: (i) the network structure, which is defined by the number of agents, the number of links connecting the agents, and the links distribution among agents; (ii) the agent parameterseandθ; and (iii) the link parameterh. We ob-tained the information on the network structure by means of deep face-to-face inter-views with two experts which live and work within the context of the case study and can be considered direct observers. These interviews were directed at recognizing the social and professional relations connecting the web by means of a participatory social network observation.5To this end, the experts were asked to trace the who-knows-who relations and to identify the affiliations to local cooperatives. To obtain the other infor-mation needed to calibrate the reminder of model parameters, we performed a ques-tionnaire survey on the actors forming the network asking for age, years of education,
cropping patterns, willingness to adopt SBO mulching films, farm size, and number of employees. We also calculated the distance between the farmers based on their loca-tion. Some descriptive statistics are reported in Table1.
The relational data were used to build the network of firms that form the interaction arrangement of the agents. This network is formed of a single component, not frag-mented, with a medium level of density (21%). Within this network, two randomly chosen nodes have an average distance of 2.42, and the maximum distance observed is 6. On the whole, the network results are very clustered (clustering coefficient 0.78). The demographic data were employed in the validation of agents’properties. Specific-ally, we used the following parameters:n= 80, as the number of respondent farmers. In each simulation, we split this number in 79 ordinaries and 1 IP; m= 1296 that is the number of links observed in the real farmers’network. Moreover, in the construction of the simulated network, the links have not been evenly distributed among the agents. Instead, the agents in the model reproduce exactly the relational profile of each farmer interviewed, with the same number of relations with the same neighbors; h varies in the range [0.1]. Rather than using a single dimension, we set this property on the base of four socioeconomic attributes (farm size, number of employees, age, and distances between farmers), as in Blau et al. 1984, Mc Pherson et al. 2001; Centola et al.
2007; p is 0 for ordinaries and 1 for IPs; novelty? is false for ordinaries and true
for IPs; θ reflects the willingness to adopt SBO mulching films declared by respon-dents and is set on a six-degree scale ranging between −1 (completely adverse to adop-tion) and 1 (completely favorable to adopadop-tion); e is various and reflects the year of education of each farmer. For the estimation oft(i.e., the model time span), we matched a 5-year time horizon (representing a rational span to allow the innovation to became ma-ture) with 45 model periods, that is the time needed by the most part of the IPs to reach a stable adoption rate. As a consequence, in our model, a time step is equal to 40 days.
Simulation and results
The procedure adopted to find those centrality measures that can be used as rational criterion to select effective IPs can be broken down in three main phases: (1) calcula-tion of the centrality measures for each agent in the network, (2) simulacalcula-tion of the IP’s effect in terms of final adoption rate using the ABM model, and (3) estimation of the effect of centrality measures on the simulated adoption rates employing the multiple linear regression.
Phase 1
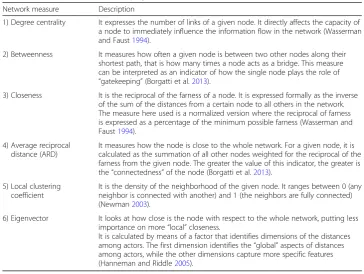
By means of the SNA, we calculated six network measures for each agent (Table2).
Table 1The descriptive statics of observations of our case study
Farm size (ha) Employees Age (years) Distances between farmers (km)
Education (years)
Mean 76.96 13.94 45.74 59.77 10.84
Standard deviation 203.71 16.76 11.6 40.92 3.53
Min 4 1 24 0 5
Max 1805 112 72 198.42 18
Table 3 contains the descriptive analysis of the abovementioned network measures. All the measures used were standardized over a range of 0.1 to facilitate the interpret-ation of the results. The table shows that each node (1) is connected to 21% of the rest of the network in mean, (2) intercepts 2% of the shortest path length among others, (3) is rather close to others, (4) has a medium level of ARD, (5) is characterized by a high local clustering coefficient, (6) and has a relatively low eigenvector.
Phase 2
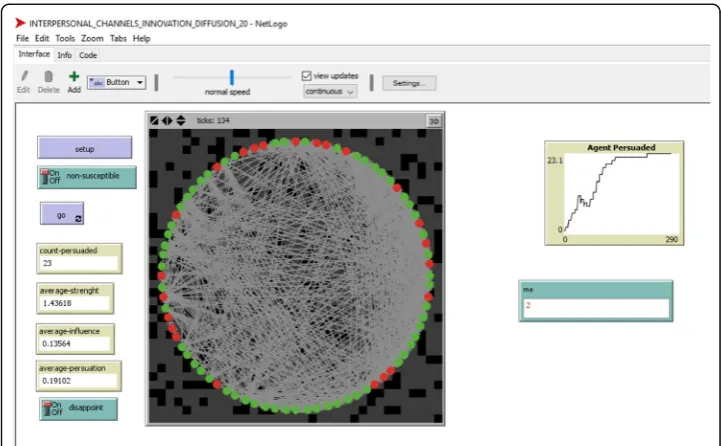
We used the NetLogo platform to code and run the ABM model. Figure 2 depicts the interface of the model implemented. In the simulation, each one of the 80 agents is used as IP alternatively; moreover, the robustness of the results is proved simulating the diffusion process repeatedly using each IP many times (batches of 20 runs) and tak-ing the means of the simulated data.
Table 2The network measures employed to characterize the IPs
Network measure Description
1) Degree centrality It expresses the number of links of a given node. It directly affects the capacity of a node to immediately influence the information flow in the network (Wasserman and Faust1994).
2) Betweenness It measures how often a given node is between two other nodes along their shortest path, that is how many times a node acts as a bridge. This measure can be interpreted as an indicator of how the single node plays the role of
“gatekeeping”(Borgatti et al.2013).
3) Closeness It is the reciprocal of the farness of a node. It is expressed formally as the inverse of the sum of the distances from a certain node to all others in the network. The measure here used is a normalized version where the reciprocal of farness is expressed as a percentage of the minimum possible farness (Wasserman and Faust1994).
4) Average reciprocal distance (ARD)
It measures how the node is close to the whole network. For a given node, it is calculated as the summation of all other nodes weighted for the reciprocal of the farness from the given node. The greater the value of this indicator, the greater is the“connectedness”of the node (Borgatti et al.2013).
5) Local clustering coefficient
It is the density of the neighborhood of the given node. It ranges between 0 (any neighbor is connected with another) and 1 (the neighbors are fully connected) (Newman2003).
6) Eigenvector It looks at how close is the node with respect to the whole network, putting less importance on more“local”closeness.
It is calculated by means of a factor that identifies dimensions of the distances among actors. The first dimension identifies the“global”aspects of distances among actors, while the other dimensions capture more specific features (Hanneman and Riddle2005).
Source: our elaboration
Table 3The table synthesizes the descriptive statistics of the SNA network variables
Network measure Abbreviation Mean St.dev Min Max
1) Degree centrality DEGREE 0.21 0.13 0.01 0.57
2) Average reciprocal distance (ARD) ARD 0.40 0.09 0.00 0.54
3) Eigenvector EIGENV. 0.13 0.09 0.00 0.33
4) Betweenness BETWEEN. 0.02 0.03 0.00 0.10
5) Local clustering coefficient CLUST.COEF. 0.76 0.27 0.00 1.00
6) Closeness CLOSEN. 0.43 0.09 0.22 0.60
Since the main output of the simulation is the number of adopters at the final time, we simulated the number and rate of adopters for each IP at t= 45 (Table4) for both versions of the model (basic and disappointment).
We also performed a robustness check of results, simulating the number of adopters and calculating the adoption rates also att= 68 and 90. The variation is negligible. This means that att= 45, the process is at its climax with a little part of the dynamic already working. We used the adoption rate att= 68 and 90 in the estimation of centrality ef-fect (see the “Phase 3”section below) with no variation in the sign and significativeness of coefficients and with almost the same values. We verified also that the threshold att
= 45 is the best end for the model simulation proven that the adoption rate at this time step displays a little more variability thant= 68 and 90 magnifying the difference in the variables estimations.
The number of adopters is around 19 for the base model and 11 for the disap-pointment version. For both versions, the level of dispersion is very low, that is, excepting little variation, the IPs work in a rather same manner. The maximum rate of adoption is 25% for the basic model and 17% for the disappointment model.
At least for this case study, these results indicate that the individual characteristics of the IPs are not primarily responsible for the diffusion process. Instead, the density and clusterization of the network do the most part of the diffusion work.
Fig. 2The NetLogo interface running the model described. The circles represent the agents (red circles are
adopting agents)
Table 4The table shows the number and rate of adopters at the final step of our simulation
Model specification Mean (%) St.dev (%) Min (%) Max (%)
Base 19.40 (0.23) 2.34 (0.03) 9.30 (0.10) 20.90 (0.25)
Disappointment 10.85 (0.12) 1.57 (0.02) 5.70 (0.06) 14.30 (0.17)
Phase 3
In this phase, we estimated the effect of the centrality measures calculated in phase 1 on the adoption rates (AR) simulated in phase 2, by means of a simple model of linear regression, specified as follows:
AR¼αþβ1Centralityþβ2ARDþβ3Eigenvectorþβ4Betweennessþβ5LCCþβ6Closenessþε
where AR is the adoption rate in the base and disappointment models (cfr. Table 4), and the regressors are those specified in Table3, with ARD standing for average recip-rocal distance and LCC standing for local clustering coefficients.
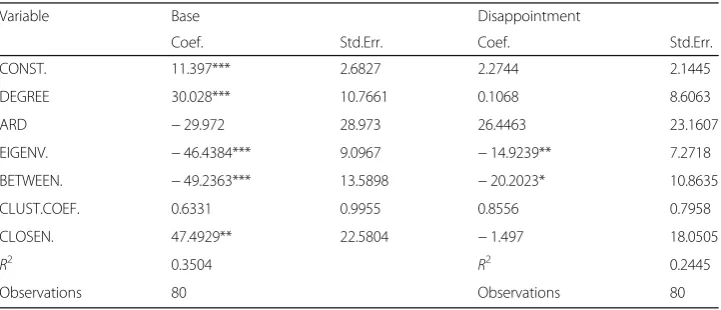
Table 5 reports the results of the regression. What we can firstly observe is that the positive influence of a dense network on the innovation diffusion is confirmed by a high intercept in the base model. The analysis of this model also highlights degree and closeness centralities as the best indicators for effective IPs. Both these measures have in fact a positive effect on the adoption rate and are highly significant. Moreover, their impact is remarkable; an augment of 1% of degree and closeness centrality produces an increase of 30% and 47%, respectively, in the adoption rate. On the contrary, between-ness and eigenvector centralities exhibit a negative. This is a surprising result, proven that betweenness is a measure of how many times an agent acts as a bridge and is con-sidered an important indicator of how the single agent plays the role of broker, while eigenvector is a measure of how central the neighbors of the agent are. High levels of these centralities are supposed to reflect into a great influence on the network with a potential crucial role in passing information and innovation spread dynamics (Borgatti et al.2013; Hanneman and Riddle2005). Finally, despite the average reciprocal distance and the clustering coefficient in particular are important network measure capable of providing social reinforce in the new behavior diffusion (Centola2011) in this case re-sulted not statistically significant.
These partly counterintuitive results are probably due to the specific structure of the real network analyzed. Most part of the literature, indeed, analyzed the effectiveness of the centrality measures on a completely theoretical network (i.e., regular lattice, ran-dom, small world), but the morphology of the network is clearly responsible for the
Table 5The table synthesizes the results of the econometric analysis
Variable Base Disappointment
Coef. Std.Err. Coef. Std.Err.
CONST. 11.397*** 2.6827 2.2744 2.1445
DEGREE 30.028*** 10.7661 0.1068 8.6063
ARD −29.972 28.973 26.4463 23.1607
EIGENV. −46.4384*** 9.0967 −14.9239** 7.2718
BETWEEN. −49.2363*** 13.5898 −20.2023* 10.8635
CLUST.COEF. 0.6331 0.9955 0.8556 0.7958
CLOSEN. 47.4929** 22.5804 −1.497 18.0505
R2 0.3504 R2 0.2445
Observations 80 Observations 80
whole diffusion dynamic and of the actual power of the single positions. In the network under investigation, the agents with the highest betweenness act as bridges between two major components of the network. These two components differs in size and struc-ture, being the greater (60 nodes) 3.75 times the size of the smaller (16 nodes). More-over, the former has a pretty random structure highly centralized with many long ties, while the latter is a very clustered network with a highly regular structure. In this con-text, the most part of the diffusion dynamics happens in the greater component, mak-ing relatively more important role of central and close IPs in its core than the role of brokers with the minor component. The supremacy of the network structure over the diffusion dynamics is also confirmed by the results from the disappointment model: when harsher conditions to innovation adoption emerge with disappointment possibil-ity, the positive influence of IPs centrality on adoption rates ceases, while the negative operation of betweenness and eigenvector remains, though reduced.
Being the model we used for the estimation a multiple regression, the findings related to each single centrality measure should not be intended as separate and self-contained but as parts of a comprehensive frame capable of leading to a multifaceted and clear profile of the ideal spreader: central and close to the rest of the network but not “ be-tween”the most part of actors, with no or limited bridge toward other very central ac-tors. In other words, in this specific structure, the diffusion of innovation is accelerated when the spreader can exert direct influence through immediate links on a large part of the network and is hindered when this influence is mediated by others.
Concluding remarks
This paper aimed at performing a preliminary analysis of the network features charac-terizing IPs capable of reaching high adoption rates in the case of the adoption of SBO
mulching films in a rural context. To this end, we combined techniques form SNA, ABM, and linear regression to calculate the centrality measures of the spreaders, simu-late the adoption rates of the innovation, and estimate the effect of centralities on the adoption dynamics. These results should be viewed as a first step in identifying the net-work measures featuring good IPs. We found the most straightforward centrality mea-sures (i.e., centrality degree, closeness) as the most relevant in spreading diffusion. This is not a trivial result proven that more “insightful” measures (i.e., betweenness and eigenvector) resulted to exert an opposite effect on the adoption rates. This contributes to addressing the initial problem of finding those individual centrality measures suitable to identify operative criteria to select the best spreaders. Rather than single specific cri-terion, we identified an actual profile of the best spreader.
policy interventions should be planned in order to achieve not only efficacy, but also effi-ciency, exploiting the leverage effect of social capital (Nardone et al. 2010): targeting the best early adopters, capable of enhancing the learning-from-others mechanisms (Santeramo2018) would help in lowering the costs of policy interventions and increasing the impacts of the rural development measures.
Finally, the fact that no agent reached at least a 25% adoption rate highlights the need to identifying the optimal number of injection point (rather than a single injection point) to maximize the potential diffusion of the technology, also considering the fact that it is costly for advisors to spread the technology among end users. The kind of model used in this paper might help in the design of balanced groups of IPs. A caveat of this study is represented by a limited case study with specific features (density and clusterization). The effects of the individual characteristics on the final rate of adoption should be interpreted on this basis. A more comprehensive analysis should include the in-vestigation of different network structures (e.g., high vs. low density, regular vs. random-ized structure, high vs. low average degree). Another area of analysis is represented by the measurement of the impact of exposure number per agent to the word of mouth. The ex-pected result of such a deeper investigation is the achievement of valuable hints for mar-keting and policy-making actors in the light of the bio-waste valorization.
Endnotes
1
TRL is the acronym of “technology readiness levels” that is a system to assess the maturity level of a specific technology developed by the National Aeronautics and Space Administration (NASA) see https://www.nasa.gov/directorates/heo/scan/engin eering/technology/txt_accordion1.html
2
Specifically, each ordinary recalculates itspas the sum of itspin the previous period and the average of thepof its neighbors weighted with the homophily degree (h). This sum is then corrected multiplying it by the level of education (e).
3
This kind of action is the only one that applies to IPs.
4
The Network Import Example is downloadable at http://modelingcommons.org/ browse/one_model/2214#model_tabs_browse_procedures
5
This method is based on the involvement of actors directly implicated in the net-work investigated, by means of net-workshops or deep interviews to co-produce a represen-tation of that network (Edwards et al. 2010).
Acknowledgements
We grateflly acknowlege the comments provided by G. Giannoccaro on a previous version of the present research.
Funding
We have not received funding for thi researchers.
Availability of data and materials
Data are available from the authors upon request.
Authors’contributions
AL has coordinated the work and is responsible for the“Introduction,” “The diffusion model,”and“Simulation and results”sections. FS is responsible for the“Concluding remarks”section. AB has provided excellent research support. All authors read and approved the final manuscript.
Competing interests
Publisher’s Note
Springer Nature remains neutral with regard to jurisdictional claims in published maps and institutional affiliations.
Received: 24 November 2017 Accepted: 10 January 2019
References
Alkemade F, Castaldi C (2005) Strategies for the diffusion of innovations on social networks. Comput Econ 25(1–2):3–23 Banerjee A, Chandrasekhar A, Duflo E, Jackson M (2013) Diffusion of microfinance. Science 341:363–310
Blau PM, Beeker C, Fitzpatrick KM (1984) Intersecting social affiliations and intermarriage. Social Forces 62:585–606 Bohlmann JD, Calantone RJ, Zhao M (2010) The effects of market network heterogeneity on innovation diffusion: an
agent-based modeling approach. J Prod Innov Manag 27(5):741–760
Borgatti SB, Everett MG, Johnson JC (2013) Analyzing social networks. Sage Publications, London
Centola D (2011) An experimental study of Homophily in the adoption of health behavior. Science 334(6060):1269–1272 Centola D, Gonzalez-Avella JC, Eguiluz VM, San Miguel M (2007) Homophily cultural drift and the co-evolution of cultural
groups. J Confl Resolut 51(6):905–929
Chen MJ (1996) Competitor analysis and interfirm rivalry: toward a theoretical integration. Acad Manag Rev 21(1):100–134 Daberkow SG, McBride WD (2003) Farm and operator characteristics affecting the awareness and adoption of precision
agriculture technologies in the US. Precis Agric 4(2):163–177
Delre SA, Jager W, Bijmolt TH, Janssen MA (2007a) Targeting and timing promotional activities: an agent-based model for the takeoff of new products. J Bus Res 60:826–835
Delre SA, Jager W, Bijmolt TH, Janssen MA (2010) Will it spread or not? The effects of social influences and network topology on innovation diffusion. J Prod Innov Manag 27:267–282
Delre SA, Jager W, Janssen MA (2007b) Diffusion dynamics in small-world networks with heterogeneous consumers. Computational and Mathematical Organization Theory 13(2):185–202
East R, Uncles MD, Uncles MD, Romaniuk J, Romaniuk J, Lomax W (2016) Improving agent-based models of diffusion. Eur J Mark 50(3/4):639–646
Goldenberg J, Han S, Lehmann DR, Hong JW (2009) The role of hubs in the adoption process. J Mark 73(2):1–13 Goldenberg J, Libai B, Muller E (2001) Talk of the network: a complex systems look at the underlying process of
word-of-mouth. Mark Lett 12:211–223
Goldenberg J, Libai B, Solomon S, Jan N, Stauffer D (2000) Marketing percolation. Physica A: statistical mechanics and its applications 284(1):335–347
Goldenberg JB, Libai S, Moldovan, Muller E (2007) The NPV of bad news. Int J Res Mark 24:186–200 Hanneman RA, Riddle M (2005)Introduction to Social Network Methods, Riverside CA. University of California
Kiesling E, Günther M, Stummer C, Wakolbinger LM (2012) Agent-based simulation of innovation diffusion: a review. CEJOR 20(2):183–230
McPherson M, Smith-Lovin L, Cook JM (2001) Birds of a feather: homophily in social networks. Annu Rev Sociol:415–444 Moldovan S, Goldenberg J (2004) Cellular automata modeling of resistance to innovations: effects and solutions. Technol
Forecast Soc Chang 71:425–442
Montoneri E., Scaringelli M.A., Mainero D., Prosperi M. (2014) Rifiuti urbani e agricoli come fonte di combustibili e prodotti chimici: selezione di processi e prodotti meritevoli di valutazione tecnica e sostenibilità per fini commerciali in Potenzialità di sviluppo e sostenibilità socio-economica e ambientale del settore delle bioraffinerie in provincia di Foggia by Lopolito A., Prosperi M., Nardone G., Eds., Franco Angeli, Milan, Italy, 61–72
Morone P, Tartiu VE, Falcone P (2015) Assessing the potential of biowaste for bioplastics production through social network analysis. J Clean Prod 90:43–54
Narayan D, Pritchett L (1999) Cents and sociability: household income and social capital in Rural Tanzania. Econ Dev Cult Chang 47(4):871–897
Nardone G, Sisto R, Lopolito A (2010) Social capital in the LEADER initiative: a methodological approach. J Rural Stud 26(1):63–72 Newman MEJ (2003) The structure and function of complex networks.SIAM Rev45:167–256
Nisbet RI, Collins JM (1978) Barriers and resistance to innovation. Australian Journal of Teacher Education 3(1) Ram S (1987) A model of innovation resistance. NA-Advances in Consumer Research, Volume 14
Rand W, Rust RT (2011) Agent-based modeling in marketing: guidelines for rigor. Int J Res Mark 28(3):181–193 Rogers EM (2003) Diffusion of innovations. Free Press, New York
Santeramo, F. G. (2018). I learn, you learn, we gain. Experience in crop insurance markets.Applied Economic Perspetives and Policy. In press
Scaringelli MA, Giannoccaro G, Prosperi M, Lopolito A (2016) Adoption of biodegradable mulching films in agriculture: is there a negative prejudice towards materials derived from organic wastes? Ital J Agron 11:90–97
Tepic M, Trienekens JH, Hoste R, Omta SWF (2012) The influence of networking and absorptive capacity on the innovativeness of farmers in the Dutch pork sector. Internationa Food Agribusiness Manag Rev 15:1–34 Tey YS, Brindal M (2012) Factors influencing the adoption of precision agricultural technologies: a review for policy
implications. Precis Agriculture 13:713–730
Valente T (1995) Network models of the diffusion of innovations. Hampton Press, Cresskill
Valente TW, Davis RL (1999) Accelerating the diffusion of innovations using opinion leaders. The Annals of the American Academy of Political and Social Science 566:55–67
Van Eck PS, Jager W, Leeflang PS (2011) Opinion leaders’role in innovation diffusion: a simulation study. J Prod Innov Manag 28:187–203
Van Rijn F, Bulte E, Adekunle A (2012) Social capital and agricultural innovation in sub-Saharan Africa. Agric Syst 108:112–122 Wasserman S, Faust K (1994) Social network analysis: methods and applications. University Press, Cambridge
Watts DJ (2002) A simple model of global cascades on random networks. Proc Natl Acad Sci 99:5766–5771