AUT J. Civil Eng., 3(1) (2019) 23-36 DOI: 10.22060/ajce.2018.14939.5506
Reliability Assessment of CFRP-Strengthened Deficient Steel SHS Columns
M. Shahraki1, M. R. Sohrabi1, Gh. Azizyan1, K. Narmashiri 2*1 Department of Civil Engineering, University of Sistan and Baluchestan, Zahedan, Iran 2 Department of Civil Engineering, Zahedan Branch, Islamic Azad University, Zahedan, Iran
ABSTRACT: Civil engineers have always been vexed by such numerous problems such as buckling, corrosion, bending, and over-loading in damaged steel structures. The present study is aimed to evaluate the effects of the axial loading, axial displacement, stiffness and deficiency location on the length of the deficient steel SHS columns have been evaluated based on a detailed parametric study. Three specimens were tested to failure under axial compression in the lab and simulated using the Finite Element (FE) numerical approach and a total of 100 samples were analyzed by ABAQUS using the MATLAB software to predict the suitable limit state functions and determine the best R2 value through such soft computing
techniques as the Artificial Neural Networks, Adaptive Neuro-Fuzzy Inference System, Response Surface Method, and Gene Expression Programming. Finally, the failure probability and reliability index were obtained by the FORM and Monte Carlo methods on the suggested limit state functions. Results indicated that using CFRP sheets reduced the stress in the damaged location and appropriately prevented or delayed local deformations around the deficient location. So, strengthening steel columns with CFRP can play a significant role in enhancing the rate of the critical load and β, and reducing (Pf ), in deficient columns.
Review History:
Received: 6 September 2018 Revised: 29 October 2018 Accepted: 7 November 2018 Available Online: 17 November 2018
Keywords:
Square Hollow Section (SHS) Steel Column
Deficient CFRP
Reliability Asessment Failure Probability
1- Introduction
Steel Square Hollow Section (SHS) is among the very commonly used structural members [1]. Erroneous, weak structure design/execution, poor steel bending/cutting details, poor stiffener reinforcing/placing, long-term static/ dynamic loading fatigue, and so on create such problems as corrosion, cracks, and gaps in steel beam/column cross sections and cause the designed structure to be weak and apt to collapse. In the past, structures used to follow old standards and failed by such natural disasters as winds and earthquakes. Therefore, the need for improving and restoring is inevitable for the desired structures to tolerate the increased dead load and fatigue. Recently, using the synthetic Fiber Reinforced Polymer (FRP) composites in steel structures to retrofit and rehabilitate members has attracted much attention and since they do not need special equipment for welding operations, reduce fatigue in steel structures, have high speed performance, eliminate welding-caused problems, and remove stress concentration, they have been highlighted during recent years. [2]
FRP composites are preferred to steel due to their high strength-to-weight ratio and optimal corrosion resistance. It
is worth noting that steel plates can be adhesively bonded although bonding is less attractive for steel plates because they are heavy and inflexible. Since the air chloride causes corrosion and crack propagation in welding, the latter should be avoided where risks should be minimum (strengthening oil storage tanks, chemical plants, etc.). Hence, bonding FRP laminates is regarded as a very promising alternative and offers an optimal strength compensation method [2].
Such factors as humidity, salt concentration, and temperature can create a corrosive environment for welding and local heating/cooling during welding can produce a non-uniform temperature distribution causing high residual tensile stresses around the weld and the heat affected zones and can be the main source of tension in the metal corrosion. If sections put pressure on residual stresses from welding, crack propagation will be actuated. Kusnick et al. [3] indicated the adverse effects of the residual stress on the buckling strength while the flame cut type of residual stress was comparatively less effective. Inward and outward imperfections have opposite effects on the critical stress. The cover should never be below 100% (minimum distance between impacts) because cracks and fatigue can develop under tension in a non-blasted area [4]. It is worth noting that steel plates can also be adhesively bonded; however, bonding is less attractive for steel plates due to their heavy weight and inflexibility. In such specific
applications as oil storage tanks and chemical plants, where the fire risk is to be minimized, welding must be avoided while strengthening a structure. As a result, bonding of FRP laminates becomes a very promising alternative. High-strength steel suffers from significant local High-strength reduction in the heat-affected weld zone. Bonded FRP laminates offer an ideal strength compensation method [5]. Doing 20 tests on short, axially compressed SHS samples cold-formed from G450 steel and strengthened with externally bonded CFRP, Bambach et al. [6] showed that the axial capacity and design of thin-walled steel SHS were improved. Tests results have shown CFRP can double the axial capacity of the steel section alone and enhance the strength-to-weight ratio up to 1.5 times. Therefore, it can provide harness to the outreach of the elastic buckling defection and hence reprieve local buckling. The related restraint increases the buckling stress up to four times compared to that of the steel section alone. Teng et al. [7] studied the steel structure strengthening with FRP composites and concluded that CFRP fibers could highly increase the resistance, yield, ultimate strength, and hardness. These fibers are regarded important for enhancing shear strength, stretch, and toughness, and since the rapture continuity level is important for steel beams bending strength and buckling of thin walled steel buildings, adhesion and compressive loads should be examined to overcome the material parameters. Yang et al. [8] evaluated the axial compression performance of reinforced steel box columns with lab and numerical methods and showed that the reinforcement scheme increased their axial stiffness and maximum load and could improve the load conditions of steel angles. Devi and Amanat [9] showed that CFRP materials improved the behavior and increased the axial load bearing capacity of HSS steel columns. Erfani et al. [10] investigated the behavior of steel box columns strengthened with continuous welded plates and showed the effects of the slenderness ratio on the reduction of the ultimate load-bearing capacity. Using CFRP strips, Narmashiri and Jummat [11] examined I-shaped retrofitted shear resistance of steel beams and indicated that the shear reinforcement of steel beam is a successful method to increase the bearing capacity and reduce deformations. Park and Yoo [12] discussed the test results of flexural and compression steel members strengthened by CFRP sheets and showed that for short columns, two sides could typically buckle outward while the other two could buckle inward; for long columns, the overall buckling was attended. Results showed that when 3 CFRP sheets were used transversely (b/t=60) to retrofit the SHS column, a maximum increase of 57% was observed in the axial load bearing capacity. Park and Yoo [13] focused on the axially loaded stub slender SHS steel columns strengthened with CFRP sheets through analyzing a total number of 9 specimens, evaluated the effects of the width-thickness ratio (b/t), the number of CFRP plates, and sheet orientation on the ultimate load bearing capacity and indicated that the use of CFRP layers in slender sections plays a significant role in delaying the local buckling and increasing the inelastic buckling stress. Narmashiri et al. [14] focused on the strengthening of steel hollow pipe section using CFRP wrap. They concluded that the application of CFRP layers increased load-bearing capacity and also showed that the using of additional CFRP strips caused more strength for the strengthened specimens.
Some researchers (e.g. Den et al. [15]) have investigated
the CFRP strengthening of the notched, damaged steel beams and columns and concluded that the premature debonding failure leading to stress concentration at the notch zone can generally reduce the efficiency of this strengthening method. Based on test results, CFRP plates can double the damaged steel beam strength and the intermediate debonding, initiated from the notch location, can create brittle fracture causing the retrofitted beam’ reduced ductility. Ghaemdoust et al. [16] highlighted the structural behavior of deficient steel SHS short columns by repairing eight specimens and showed that CFRP sheets could highly recover the strength lost due to deficiency; the load bearing capacity increased and delayed the local buckling. Yousefi et al. [17] stressed the effects of CFRP strips on strengthening notched steel beams and concluded that they could prevent crack propagation and brittle fractures in the deficiency region. Karimian et al. [18] studied the effects of deficiency on reducing the axial resistance and the possibility of overcoming the weakness on CHS (Circular Hollow Section) short columns strengthened with CFRP sheets and concluded that they could lead to reduced stress in the damage region, a higher load bearing capacity, and the prevention of local buckling around the deficient region. Shahraki et al. [2] published the results of an experimental and numerical investigation of strengthened deficient steel SHS columns using two methods: welding steel plate and wrapping by CFRP sheets under axial compression loads. The results confirmed that the CFRP layers have better performance than the steel plate for the strengthening of the deficient region on the specimens. All the aforementioned studies emphasize the application of the CFRP in strengthening concrete and steel structures; however, no research, to the best of the authors’ knowledge, has addressed the use of CFRP sheets on retrofitting deficient intermediate SHS steel columns. Since the present study is aimed to evaluate the role of the CFRP in strengthening steel columns, it has highlighted the effects of CFRP layers for strengthening deficient steel SHS columns under axial compression, determined the failure probability, and presented suitable limit state functions to analyze the reliability and parameters’ sensitivity to CFRP sheets in the strengthened column.
2- Materials and methods
Many research is based on the laboratory, numerical and parametric studies. To study the effect of deficiencies, strengthening techniques and reliability assessment a total of three columns were examined in the lab. The column without deficiency was considered as control specimen and other two columns with rectangular deficiencies at the bottom length of the column, with and without CFRP strengthening, were studied. A total of 100 samples simulated by the Finite Element (FE) numerical method and also these samples have used to the parametric study for the determination of the reliability index and failure probability.
2- 1- Materials properties 2- 1- 1- Steel columns
The section size in the SHS steel column test was 40×40×2 mm3 lengths of all steel columns were “2500 (mm)” , and the
examined; one as the control specimen (without deficiency) and two with rectangular deficiency at the column end (with and without CFRP strengthening). Material properties, SHS steel column information, and steel plate tensile test results (based on ASTMA370 and AASHTOT299) are shown in Table 1. Figure 1 shows the defect-related data and specimens’ section dimensions and Figures 2 and 3 show the tensile coupon test configuration and the tested stress-strain
curves, respectively. Terms used for the specimens include BOX= SHS Column, DMG= Deficient, BOT= Bottom, and REC= Rectangular deficient.
2- 1- 2- CFRP
The CFRP used in this study is the unidirectional Sikawrap 230-C [19] the properties of which (according to the manufacturer) are shown in Table 2.
Figure 1. Measured geometric dimensions of the BOX40
Figure 2. Measured local geometric imperfection
Figure 3. Stress-strain curve for steel material
Table 1. Material properties of steel columns
SHS columns Specifications
Modulus of Elasticity(MPa)
stress (MPa)
Elongation (%) Specimen
Label Thickness (mm) Height (mm) Deficient Cross Sectional Area (mm2) Yield stress Ultimate stress
Table 2. Material Properties of carbon fiber [19]
Tensile strength
(MPa) Tensile E-Modulus (MPa) Ultimate strain (%) Thickness (mm) Width (mm)
4300 238000 1.8 0.131 500
2- 1- 3- Adhesive
Adhesives supply the power transmission path between the steel and composite materials and cause identical column-composite performance. Here, use has been made of the Sikadur-330 epoxy [20] (Table 3) to attach the CFRP sheets to steel columns.
Table 3. Properties of the Sikadur-330 adhesive [20]
Tensile strength
(MPa)
Flexural E-Modulus
(MPa)
Tensile E-Modulus
(MPa)
Elongation at break
(%)
30 3800 4500 0.9
2- 2- Methodology
2- 2- 1- Preparing test specimens
A total of 3 column specimens were prepared (Figure 4) and defects were created in them by the Computer Numerical Control (CNC) machine (Figure 4a) and all the external roughness, loose steel particles, and grease were removed by sandblasting, acetone, and cotton (Figures 4d and e). Then, CFRP sheets were cut into proper dimensions and wrapped around the defective areas on steel SHS columns by two longitudinal and two transverse layers according to the manufacturer’s instructions regarding overlapping conditions and adhesive geometrical mix design (Figure 4f). Finally, the specimens were kept in the laboratory at the room temperature for at least one week before testing. Tests were performed in the Structural Engineering Department Lab, Islamic Azad University (Zahedan, Iran), and the specimens were loaded up to failure under a uniform uniaxial compressive load by a hydraulic universal testing machine with a vertical load capacity of 1000 (kN); the load bearing capacity (Pcr) and maximum axial displacement (δmax) were measured by the
Linear Variable Differential Transform (LVDT) connected to the column top. The load cell and LVDT were connected to a 16-channel data-logger to save and record the data (Figure 5) and tests continued until either the specimen failed (due to the steel SHS fracture) or the loading device stopped.
Figure 4. Preparation of CFRP-strengthened specimens
Figure 5. Test setup for local/overall buckling
2- 2- 2- FE simulation
In the present study, the ABAQUS ver. 6.14.1 was used to perform the FE analyses for the CFRP-strengthened steel SHS columns. To analyze the data and study the local buckling behavior of the SHS steel column, use was made of the CFRP, adhesive, and the 3D-8R node HEX element. Then, the statistical analysis simulation method was used to observe the plastic zone after post buckling. The material properties of CFRP sheets (Modulus of Elasticity=238000 MPa , Tensile strength=4300 MPa) , adhesive (Modulus of Elasticity=4500 MPa , Flexural E-Modulus=3800 MPa ), and yield stress (366 MPa), and ultimate strength (398 MPa) values of the SHS steel columns (Cross sectional area=800mm2, Thickness=2 mm,
[21] and Tie Method, respectively. Materials with linear and nonlinear properties were defined; properties of the CFRP strips were defined as linear and orthotropic because they are unidirectional, and those of others were defined as nonlinear and isotropic [22]. The mesh size selected for this study was 10 mm (Figure 6) and the software and test results accuracy have been confirmed by Park et al. [13]. In this research, since the initial lab tests’ imperfections are known to be similar to those of the tests on columns, a linear superposition of buckling Eigen modes were applied for parametric cases the buckling modes of which are unknown. Figure 7 shows the schematic view of the FE modeling and Figure 8 shows that the difference between the load and axial displacement for the specimens is minimal in both experimental and analytical software modes.
Figure 6. Study on the mesh size
Figure 7. Schematic view of the finite element modeling
(a) BT100-0P
(b) BT80-1P
(c) BT80-3P
Figure 8. Analytical FEM-lab data (Park et al [13]) comparison of the load-displacement curve results
3- Results and discussion
3- 1- Effects of CFRP sheets on the ultimate load capacity
Bambach et al. [6] investigated the design and capacity of 20 steel square hollow sections strengthened with CFRP and concluded that the latter could double the axial capacity of the cross-section and increase the resistance-to-weight ratio by 1.5 times. They also examined the axial capacity and crushing behavior of steel with metal fiber square tubes, stainless steel, and aluminum strengthened with CFRP [23]. Sivasankar et al. [24] evaluated the fracture modes, stress-strain behavior, and ultimate bearing capacity of steel with short square columns retrofitted with CFRP. There were three columns one of which was of the normal type BOX40 and the rest had artificial defects strengthened with CFRP. Figure 9
shows summarized results of maximum load of the columns obtained from the tests and FEM analyses; as shown, there is a strong correlation between the tests and FEM results i.e. Ptest
(maximum test load) is quite close to Pfem (maximum FEM
load) provided by Table 4. The mean and standard deviation of (Ptest/Pfem ) ratio are 1.01877 and 0.007367, respectively. The
results of table 4 showed that creating a rectangular deficient region at the bottom of the square column is responsible for the decrease in the maximum ultimate load by -76.29%. The use of CFRP is responsible for the 27.70% increase in the maximum axial load compared to the specimen with deficiency.
3- 2- Effects of the CFRP layer on the stiffness
Stiffness is defined based on Equation 1 and Figure 10. In the work of Park et al. [13], 0.75Pmax is the axial load when it
reaches 75% of the maximum load in the pre-peak stage, and Pmax is regarded as the maximum load point. In addition, as
point of lines (1) and (2). As indicated in Table 4, the values of the test stiffness (Ktest) were almost close to those provided by FEM analysis (Kfem), and the mean and standard deviation of
their ratio (Ktest/Kfem ) are 0.97543 and 0.03085, respectively. It is apparent from Table 4 that, the stiffness of the deficient steel column was a decrease of 6.58%, while the using of CFRP sheets caused to increase this value to 19.38%.
(a) Experimental specimens of BOX40
(b) Simulated specimens of BOX40
Figure 9. Comparison of the test-simulation load-displacement curves in BOX40 specimens
Figure 10. Definition of stiffness [13]
Figure 11 shows the support conditions in steel SHS columns, Figure 12 displays the local and overall buckling around the region of the BOX40-DMG-BOT-REC, and Figure 13 demonstrates the typical overall buckling in BOX40-DMG-BOT-REC with CFRP fibers.
Ki=(Pk/δy ) (1)
Figure 11. Details of fixed supports in specimens
3- 3- Failure modes
All the specimens were tested under axial compression until failure. The typical failure modes of BOX40 specimens are shown in Figure 12. For non-strengthened specimens, both the inward and outward local buckling were observed in the deformed specimens whereas for the SHS retrofitted with CFRP, the local buckling was prevented by the CFRP sheets. Figure 13 shows that the CFRP layers played good role in retarding or overcoming the local buckling in BOX40 columns.
Figure 12. Comparison of the failure modes from the interactive buckling test and FE modeling in
Table 4. Summary of the tests and FEM results in BOX40
Specimen label Item Results Value of gain or loss % gain or loss Errors
Test Fem Test Fem Test Fem P (Test/Fem) K (Test/Fem)
BOX40 Maximum load (kN) 97.86 95.50 Control Control Control Control 1.02
-BOX40 (kN/mm) 22.91 22.90Stiffness Control Control Control Control - 0.99
BOX40-DMG-BOT-REC maximum load (kN ) 55.51 54.25 −42.35 −41.25 −76.29 −76.03 1.02 -
BOX40-DMG-BOT-REC Stiffness kN/mm) 21.55 23.08 −1.40 −0.179 6.58 0.78 - 0.93
BOX40-DMG-BOT-REC-CFRP maximum load (kN) 70.89 70.30 15.38 16.05 27.70 29.58 1.00
-
BOX40-DMG-BOT-REC-CFRP (kN/mm) 25.68 25.84Stiffness 4.17 2.76 19.38 11.95 - 0.99
Mean 1.01877 0.97543
St.dev 0.007367 0.03085
4- Reliability assessment
4- 1- Limit state function and failure criteria
To express the failure probability, use is usually made of a limit state function as follows:
G(R,Q)=R-Q (2)
where G(R,Q) represents the limit condition function, R is considered as the structural strength function, and Q denotes the function for the loading-induced effects on the structure. In Equation 2, both the strength and loading functions include several stochastic variables with different probability distribution functions. These variables are selected based on material type and dimensions. As illustrated in Figure 14, this function may encounter three different states each representing a specific failure/health condition of the structure. According to Nowak [25], these states are described as follows:
G(R,Q)=R-Q<0 ; the failure state (3) And
G(R,Q)=R-Q>0 ; the health state (4)
Figure 14. A schematic view of the limit state function and the safety-failure limit
4- 2- Failure probability
Since R and Q, statistically-independent stochastic variables, have Probability Distribution Functions (PDF) fQ
(q) and fR(r) with q < ∞ and r≥0, the structural member failure occurs when the applied loads are greater than the structure strength. Therefore, the overlap of the PDFs of strength and load variables is as follows [26]:
Pf [Q>R]=∫∫ fQ,R fQ,R (q.r)dqdr (5) where Pf represents the structural failure probability and
fQ,R (q) indicates the joint PDF. Equation 5 is simplified by
considering the limit state function from the difference of the load and strength stochastic variables as follows:
Pf=1-∫-∞∞ FQ (r) FR (r)dr (6)
In this case, the structural failure probability is described as follows [26]:
Pf = p[g(0)]< 0 (7)
where g (0) presents the boundary between the failure and safety of the limit state function including the variables as the X vector with different distribution functions. The area of the probability distribution function g (0) < 0 indicates the structural failure probability within the failure region of the structure.
4- 3- First-Order Reliability Method (FORM)
Failure probability of a steel component is computed by a probabilistic model g(Χ) that includes strength unreliability (elastic modulus, dimensions, Poisson index, ultimate tension and yielding tension) and load (live or dead load and load capacity). The failure probability can be approximated based on the reliability index (β) in FORM as follows:
where Pf is the failure probability and g(Χ) is the limit state
function that separates the design domain into safe region (g(Χ)≥0) and failure region (g(Χ)≤0) using basic random variable Χ [27].
4- 4- Monte Carlo (MC) method
The Monte Carlo technique invokes the law of numbers to approximate an expectation/integral by drawing an independent and identically distributed (IID) sample X1,…
,X_m according to the distribution PX; here, approximation of the multiple integral is required. The empirical average, an estimator of α (failure probability), is as follows [28]:
α =1/m ∑i=1m X
i єΓ (9)
4- 5- Response Surface Method (RSM)
A response surface model uses low-order polynomials to approximate the response of an actual analysis code. The sample point is as follows [29]:
X(i) is X(i)=(X
1(i), X2(i),…, XNdv(i) ) (10)
The response is as follows: y(i)=y(X(i)),i=1,2,…,N
sp ) (11)
and, the polynomial regression y (X) approximation to the true response y(X) is as follows:
y(X)=y (X)+ε (12)
which is the error between the approximation and the true response.
In the present study, use has been made of the second order polynomials for y(X) [29] as follows:
y(X)=β0+∑i=1Ndv βixi+∑i=1Ndv ∑i=1≤jNdy βij xi xj+∑i=1Ndv βii
xi2 (13)
where Ndv and Nsp are the number of the design variables
and sample points, respectively. In the literature, RSM is quite common in studies of the reliability analyses (e.g., Boucher and Bourgund, 1990; El-Tawil et al. (1991); Faravelli, 1989). Kim and Na (1997) set up the early theoretical basis for the RSM and further developments were proposed by Kaymaz and McMahon (2005) and Zheng and Das (2000). Gayton et al. (2003) proposed a method called “Complete Quadratic Response Surface with Re-Sampling (CQ2RS)” using a full quadratic response surface by involving variables interactions; the surrogate model resembles that of Gayton et al.’s (2003) written in the standard space. Wang et al. (2015) evaluated the time-dependent reliability analysis of circular Concrete Filled Steel Tube (CFST) stub columns under environmental corrosion, proposed a model for boundary conditions function and column corrosion reliability evaluation in destructive environments, and concluded that a reduction occurs in the resistance and reliability of CFST columns over time. It has been shown that the thickness (of a steel-shaped tube) and the live load are the important factors that affect the reliability during the first 20 years of corrosion [29].
4- 6- Reliability solving strategy
Retrofitting steel columns with CFRP fibers includes
multiple uncertainties for which the reliability design can allow a reliable assessment. Regardless of these uncertainties and quantitative possibilities, a certain design with a security parameter may be unsafe or very conservative. Figure 15 shows the stepwise detail flowchart of the reliability solving strategy used in this study.
Figure 15. Flowchart of the reliability solving strategy
4- 7- Artificial Neural Network (ANN)
ANNs provide a general practical method for functions with real, discrete, and vector quantification of the examples [30]. To code and calculate the number of the required 2-20 neurons and reduce errors, use has been made of the BP (Back Propagation) networks, LM (Levenber Marquant) function, and a range of 1-30 different tests. Among the data, 70% were related to training, 15% to testing, and 15% to validating. A two-layer ANN includes Sig-sigmoid and Purlin as its first and second layers, respectively.
4- 8- Adaptive Neuro-Fuzzy Inference System (ANFIS)
The membership function parameters of these systems are set by the propagation algorithm or its combination with the least squares method [31]. In the present study, the testing data include 20% of total data and the Sugeno type fuzzy system and sub clustering method have been used for the required computations.
4- 9- Genetic programming (GP)
It is usually claimed that GP, first proposed by Koza (1992), is an extension of the Genetic Algorithm (GA). GEP is an extension of the GP which evolves computer programs of different sizes and the shapes encoded in linear chromosomes of fixed length. The chromosomes are composed of multiple genes each encoding a smaller sub program [32]. The present study is aimed to find the best solutions and GEP is used for providing the means of finding the solution very efficiently. Table 5 indicates the related parameters for training GEP models.
4- 10- R2 value setting
In order to determine the value of R2 in the present study,
use was made of the MATLAB software and one hundred new samples were generated to be considered with the variables of each column in Table 6 around the mean and the standard deviation. Then, using the obtained and ultimate load results, each mode was modeled with the ABAQUS software and the maximum axial load was calculated. Table 7 indicates the R2
Table 5. Parameters related to GP models
P1 Function set +,- ,×, ∕ ,ex, ln (x), tan(x), x2, x3, x4
P2 Chromosomes: 20, 35
P3 Head size: 6, 10
P4 Number of genes: 3, 5
P5 Linking function: Addition
P6 Fitness function error type: MAE, R-Square, Custom fitness function
P7 Mutation rate: 0.044
P8 Inversion rate: 0.1
P9 One-point recombination rate: 0.3
P10 Two-point recombination rate: 0.3
P11 Gene recombination rate: 0.1
P12 Constants per Gene: 3
as ANFIS, RSM, and GEP. Figures 16 and 17 illustrate the results of axial load/axial displacement for 100 specimens analyzed by the ABAQUS software.
Table 6. Design random variables for steel SHS specimens
Parameters Parameters name BOX40-DMG-B0T-REC BOX40-DMG-BOT-REC-CFRP Distribution Mean Value, μ Standard deviation, σ Mean Value, μ Standard deviation, σ
Deficient
Cross-Sec-tional Area As (mm
2) 800 19.2 800 19.2 Log Normal
Thickness of
Column t(mm) 2 0.196 2 0.196 Log Normal
Steel yield
stress Fy (MPa) 366 36.6 366 36.6 Normal
Modulus of Elasticity of
CFRP
ECFRP
(MPa) Not Available Not Available 238×103 22610 Weibull
Strain of
CFRP εCFRP Not Available Not Available 0.018 0.0018 Log Normal
Maximum
Axial Load Pmax (kN) 100 10 100 10 Gamble
Table 7. The R2 comparison of four different methods
Specimen Artificial Neural Network ANFIS Response Surface Method GP
BOX40-DMG-BOT-REC 0.82 0.91 0.73 0.94
(a) (b)
(c)
Figure 16. Results of the axial load/displacement for BOX40-DMG-BOT-REC
(a) (b)
(c)
Figure 17. Axial load/ displacement for BOX40-DMG-BOT-REC-CFRP
Results showed that the GEP yields better R2 values
although it is different from ANFIS in calculating R2 (the
latter performs better for low data). FORM and Monte Carlo methods are used to determine β and Pf and do the sensitivity
analyses of the variables discussed. It is worth noting that the linear relationships (Eqs. 15 and16) are “limit state” functions for deficient steel SHS columns without/with CFRP fibers using the RSM. Table 8 represents the coefficients of the limit state functions and the variables studied and Eq. (14)
shows the general mode of the conditions used. Results of the reliability index and failure probability found with functions given by the RSM results are shown in Table 9, and Table 10 indicates the design point of the random variable considered in the RSM.
is observed between FORM and Mont Carlo methods in determining the reliability parameters. In order to determine the design point on each of the desired parameters, both reliability methods can be used to examine and analyze the effect of each parameter in determining the failure probability and reliability index in the desired columns. According to Table10, in column specimens without CFRP fiber, cross-sectional area has the highest impact on the failure probability meaning that CFRP can play a significant role in strengthened specimens to reduce the effects of the cross-sectional area. However, the elasticity modulus of CFRP fibers is the most
h(x)=g(x)-Pcr (14)
h1 (x)=(a1 t+a2 As+a3 Fy+a4 )-Pcr (15)
h2 (x)=(a1 t+a2 As+a3 Fy+a4 ECFRP+a5 εCFRP+a6)-Pcr (16) important factor in resistant columns. Thus, the CFRP fiber plays a vital role in improving the resistance and failure probability.
Table 8. Coefficients of the RSM limit state functions
ROW a1 a2 a3 a4 a5 a6
h1 (x) 3.0400404×10⁴ 0.00001557×10⁴ 0.013483890×10⁴ 3.831416×10⁴ 0 0
h2 (x) 2.8557476×10⁴ 0.000024×10⁴ 0.0167558×10⁴ 0.0000018×10⁴ 1.37799×10⁴ -2.7634168×10⁴
Table 9. Comparison of the RSM reliability index and failure probability
Specimen Monte Carlo Form
β Pf β Pf
BOX40-DMG-BOT-REC 0.73 0.2318 0.73 0.2319 BOX40-DMG-BOT-REC-CFRP 4.03 2.75×10⁻⁵ 4.04 2.59×10⁻⁵
Table 10. RSM random variable design point
Specimen t(mm) As (mm2) Fy (MPa) ECFRP (MPa) εCFRP
BOX40-DMG-BOT-REC 1.998 797.14 308.235 -
-BOX40-DMG-BOT-REC-CFRP 1.999 776.40 287.097 223503 0.017
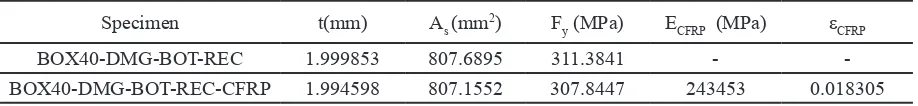
Equations 17 and 18 are limit state functions for specimens found by the GEP software. Table 11 shows the coefficients of the functions of the boundary conditions and the studied variables, Table 12 shows the design point of the random variables considered in GEP, and Table 13 shows the results of the reliability index and the failure probability found with the functions given by the GEP method.
h1( x ) = t a n ( ( ( ( a1- F y ) - L n ( a2) ) - ( F y × a1
)))+(t-tan(tan(((Fy2 )+Fy)) ) )+(t-tan(tan((a
32)+As)))
+(((t×Fy)+Fy)/((a44)/t))-Pcr
(17)
h2(x)=(As-((Fy×a1)/εCFRP)))+(ECFRP×t)×ln(a2+As)2
+ ( e x p ( t3) / ( ε
C F R P4) + ( ( F y × εC F R P) - ) t2+ ( F y
-(a3×(tan(ECFRP+Fy))))+((a4-εCFRP)2)3+(((tan(As4))4+A
s)×a5)+((2×ECFRP)-tan(ECFRP))×ln(t4 )×(t/Fy)2-Pcr
(18)
Since limit state functions given by the GEP software are non-linear, FORM method lacks acceptable rules for the reliability analysis, and since, according to Table 13, the reliability index given by the Monte Carlo method is illogical, the RSM method performs better than GEP.
Figure 18 shows the reliability index (β) sensitivity analysis in relation to the maximum axial load (Pcr), thickness (t) and
deficiency cross section (As) for the column with deficiency
Table 11. Coefficients of GP limit state functions
ROW a1 a2 a3 a4 a5
h1 (x) 1.93689 0.930817 1.231842 1.762879 0
h2 (x) 1.97522 0.481262 1.97522 0.573547 1.97522
Table 12. GP random variable design point
Specimen t(mm) As (mm2) Fy (MPa) ECFRP (MPa) εCFRP
BOX40-DMG-BOT-REC 1.999853 807.6895 311.3841 -
-BOX40-DMG-BOT-REC-CFRP 1.994598 807.1552 307.8447 243453 0.018305
Table 13. Comparison of GP reliability index and failure probability
Specimen Monte Carlo
β Pf
BOX40-DMG-BOT-REC -4.3439 0.9999993
BOX40-DMG-BOT-REC-CFRP 2.889 0.0019321
(a) Sensitivity analysis for t (b) Sensitivity analysis for Pcr
5- Conclusions
In the present study, 3 steel SHS column specimens with rectangular deficient were strengthened with CFRP sheets and effects of such different parameters as the cross-section of the deficiency, maximum axial load/displacement, stiffness and CFRP strengthening on the response of the retrofitted deficient steel columns were studied through the ABAQUS ver. 6.14.1 as the finite element modeling software. Then, the failure probability was determined and proper limit state functions were presented to analyze the reliability and sensitivity of the CFRP-related column parameters. The research findings have led to the following conclusions:
1. The finite element simulation results of the deformed mode of the steel columns agree well with the experimental results and those found through the analyses of the stress distributions of different specimens and failure modes show good agreement with the experimental results. 2. This study confirms that retrofitting methods are effective
in expanding the local and overall buckling, decreasing stress around the damage location, and increasing the ductility.
3. The stiffness was calculated by the maximum axial load/displacement. The mean and standard deviation were determinate for both the lab and numerical models; results showed that a created the deficient in the steel column caused to reduce the stiffness value on the specimen and using the CFRP sheets will increase the stiffness.
4. This study has found that the CFRP strengthening is useful in overcoming weaknesses and improving the performance of the deficient intermediate steel SHS columns.
5. For the desired data, R2 was calculated by Artificial
Neural Network, ANFIS, GEP, and RSM and the results showed that GEP and RSM yielded better R2 values,
but RSM performed better in determining the reliability index and the design point meaning that in RSM, β and Pf are calculated around the mean value by the reliability
analysis computational methods.
6. Since the proposed function is linear, there is a slight difference in methods that determine the reliability and failure probability; as expected, the CFRP increased the reliability by 82% in strengthened columns compared to the non-strengthened ones.
7. According to the results found by the FORM and Monte Carlo reliability methods, it is suggested that the linear functions found by RSM be used to determine the design points in deficiency columns retrofitted with CFRP fibers.
Acknowledgements
This study was financially supported by the Islamic Azad University, Zahedan branch, Iran. The authors would like to appreciate those involved for their valuable supports.
References
[1] M. Bambach, M. Elchalakani, Plastic mechanism analysis of steel SHS strengthened with CFRP under large axial deformation, Thin-walled structures, 45(2) (2007) 159-170.
[2] M. Shahraki, M.R. Sohrabi, G.R. Azizyan, K. Narmashiri, Experimental and numerical investigation of strengthened deficient steel SHS columns under axial compressive loads, Structural Engineering and Mechanics, 67(2) (2018) 207-217.
[3] J. Kusnick, M. Benson, S. Lyons, Finite Element Analysis of Weld Residual Stresses in Austerities Stainless Steel Canisters in Dry Storage System Canisters, Sandal National Lab. (SONLY-NM), Albuquerque, NM (United States), 2013.
[4] Y.-C. Song, R.-P. Wang, J. Li, Local and post-local buckling behavior of welded steel shapes in partially encased composite columns, Thin-Walled Structures, 108 (2016) 93-108.
[5] L. Dieng, D. Amine, Y. Falaise, S. Chataigner, Parametric study of the finite element modeling of shot peening on welded joints, Journal of Constructional Steel Research, 130 (2017) 234-247.
[6] M. Bambach, H. Jama, M. Elchalakani, Axial capacity and design of thin-walled steel SHS strengthened with CFRP, Thin-Walled Structures, 47(10) (2009) 1112-1121. [7] J. Teng, T. Yu, D. Fernando, Strengthening of steel
structures with fiber-reinforced polymer composites, Journal of Constructional Steel Research, 78 (2012) 131-143.
[8] Y. Yang, Z. Chen, Z. Zhao, X. Liu, Axial compression performance of steel box columns with different strengthening schemes, International Journal of Steel Structures, 17(2) (2017) 367-378.
[9] U. Devi, K.M. Amanat, Non-linear finite element investigation on the behavior of CFRP strengthened steel square HSS columns under compression, International Journal of Steel Structures, 15(3) (2015) 671-680. [10] S. Erfani, M. Naseri, V. Akrami, Effect of in-service
strengthening on the axial load carrying capacity of steel box columns, International Journal of Steel Structures, 17(1) (2017) 231-244.
[11] K. Narmashiri, M.Z. Jumaat, N.R. Sulong, Shear strengthening of steel I-beams by using CFRP strips, Scientific Research and Essays, 5(16) (2010) 2155-2168. [12] J.-w. Park, J.-h. Yoo, Flexural and compression behavior
for steel structures strengthened with carbon fiber reinforced polymers (CFRPs) sheet, Steel and Composite Structures, 19(2) (2015) 441-465.
[13] J.-W. Park, H.-J. Yeom, J.-H. Yoo, Axial loading tests and FEM analysis of slender square hollow section (SHS) stub columns strengthened with carbon fiber reinforced polymers, International Journal of Steel Structures, 13(4) (2013) 731-743.
[14] K. Narmashiri, G. Mehramiz, Strengthening of steel hollow pipe sections subjected to transverse loads using CFRP, Structural Engineering and Mechanics, 60(1) (2016) 163-173.
Please cite this article using:
M. Shahraki, M. R. Sohrabi, Gh. R. Azizyan, K. Narmashiri, Reliability Assessment of CFRP-Strengthened Deficient Steel SHS Columns, AUT J. Civil Eng., 3(1) (2019) 23-36.
DOI: 10.22060/ajce.2018.14939.5506
[16] M.R. Ghaemdoust, K. Narmashiri, O. Yousefi, Structural behaviors of deficient steel SHS short columns strengthened using CFRP, Construction and Building Materials, 126 (2016) 1002-1011.
[17] O. Yousefi, K. Narmashiri, M.R. Ghaemdoust, Structural behaviors of notched steel beams strengthened using CFRP strips, Steel and Composite Structures, 25(1) (2017) 35-43.
[18] M. Karimian, K. Narmashiri, M. Shahraki, O. Yousefi, Structural behaviors of deficient steel CHS short columns strengthened using CFRP, Journal of Constructional Steel Research, 138 (2017) 555-564.
[19] Sikawrap-230C, in: Product data sheet, 2006. [20] Sikadur-330, in: Product data sheet, 2006.
[21] J.-W. Park, J.-H. Yoo, Axial loading tests and load capacity prediction of slender SHS stub columns strengthened with carbon fiber reinforced polymers, Steel and Composite Structures, 15(2) (2013) 131-150. [22] K. Narmashiri, M.Z. Jumaat, Reinforced steel I-beams: A
comparison between 2D and 3D simulation, Simulation Modelling Practice and Theory, 19(1) (2011) 564-585. [23] M. Bambach, M. Elchalakani, X.-L. Zhao, Composite
steel–CFRP SHS tubes under axial impact, Composite Structures, 87(3) (2009) 282-292.
[24] S. Sivasankar, T. Thilakranjith, M. Sundarraja, Axial Behavior of CFRP Jacketed HSS Tubular Members-An Experimental Investigation, International Journal of Earth Sciences and Engineering, 061(413) (2012) 1729-1737.
[25] A. Nowak, K. Collins, Reliability of Structures McGraw-Hill, Inc., Boston, (2000).
[26] A.M. Hasofer, N.C. Lind, Exact and invariant second-moment code format, Journal of the Engineering Mechanics division, 100(1) (1974) 111-121.
[27] H. Makhduomi, B. Keshtegar, M. Shahraki, A Comparative Study of First-Order Reliability Method-Based Steepest Descent Search Directions for Reliability Analysis of Steel Structures, Advances in Civil Engineering, 2017 (2017).
[28] L. Li, Sequential Design of Experiments to Estimate a Probability of Failure, Supélec, 2012.
[29] H. Yang, A. Wang, Dynamic stability analysis of pipeline based on reliability using surrogate model, Journal of Marine Engineering & Technology, 12(2) (2013) 75-84. [30] H. Naderpour, A. Kheyroddin, G.G. Amiri, Prediction
of FRP-confined compressive strength of concrete using artificial neural networks, Composite Structures, 92(12) (2010) 2817-2829.
[31] T. Takagi, M. Sugeno, Fuzzy identification of systems and its applications to modeling and control, in: Readings in Fuzzy Sets for Intelligent Systems, Elsevier, 1993, pp. 387-403.

![Table 2. Material Properties of carbon fiber [19]](https://thumb-us.123doks.com/thumbv2/123dok_us/10787.2000895/4.595.48.292.278.342/table-material-properties-of-carbon-fiber.webp)

![Figure 10. Definition of stiffness [13]](https://thumb-us.123doks.com/thumbv2/123dok_us/10787.2000895/6.595.92.247.534.662/figure-definition-of-stiffness.webp)