| Vol. 2 | No. 2 | 79-84
Copyright © 2010 by ranian Occupational Health Association (IOHA) I IJOH 2: 79-84, 2010
O
ORRIIGGIINNAALLAARRTTIICCLLEE
Application of GIS in Urban Traffic Noise Pollution
ALI ASGHAR ALESHEIKH1 and MANOUCHEHR OMIDVARI2*
1
Faculty of Geomatics Engineering, K. N. Toosi University of Technology, Vali-e-Asr St., Mirdamad Cross, Tehran, Iran; 2Faculty of Industrial and Mechanical Engineering, Islamic Azad University, Qazvin Branch, Qazvin,
Iran.
Received November 21, 2009; Revised March 5, 2010; Accepted May 30, 2010
This paper is available on-line at http://ijoh.tums.ac.ir
ABSTRACT
Large urban areas are facing growing problems of noise pollutions. Geospatial Information Systems (GIS) can conveniently be adapted to gather, analyze and present noise information. GIS can also be extended to answer to user specific problems through deterministic and statistics models. The objectives of this research were to measure urban traffic noise levels, analyze temporal and spatial dynamics of urban traffic-induced noise pollution in the first districted of Tehran estimate the noise for pollution concentration, assess the results of Federal Highway Administration Traffic Noise Model (FHWA-TNM) and Iranian Traffic Noise Predictor (ITNP); and represent them in a GIS environment. Measurements were done at the traffic peak time and also when the traffic was at its minimum, during three successive months. In this study, Leq, L10, L50, L90, Lmax and Lmin were gathered. The results demonstrated that most of
commercial and residential regions surrounding the main streets are suffering from sever noise pollution. Processed data, spatial analysis and models are integrated within the framework of ArcGIS software environment, providing adequate tools to address noise issues. The assessment showed that the issue of noise pollution is currently ignored in urban regulations concerning environmental quality.
Keywords: Noise pollution, GIS, FHWA-TNM, Spatial analysis, ITNP, Iran
INTRODUCTION
The ever-increasing highway traffic noise in urban areas amplifies certain problems that directly or indirectly affect human daily life. The explosive increases in the number of vehicles and higher vehicle speeds cause greater highway problems to the surrounding areas [ 1, 2, 3]. Well-documented adverse effects of traffic noise are annoyance, sleep disturbance and speech interference [ 4, 5, 6, 7, 8, 9]. About 120 million people in the European Union are disturbed by road traffic noise levels above 55 dBA, and more than 50 million people are exposed to noise levels above 65 dBA [ 10]. The same fact was elaborated in the report published in US by Federal Highway Administration
(FHWA) [ 11].
Piccolo stated that the amount of sound in Messina was higher than the normal, thus, the urban environmental noise must be studied [ 12]. As stated in a report, a relatively high percentage of people considered the noise pollution as the biggest problem in London metropolis where the traffic noise has been selected as the main noise source by 23 % of people [ 13]. According to the American Speech, Language, and Hearing Association, 10 million Americans suffer from noise-induced hearing loss and 20 million are exposed to potentially damaging noise levels. Hearing loss has increased by 14% since 1971 [ 14].
Geospatial Information Systems (GIS) can be effectively used in the gathering, weighting, analyzing and presenting spatial and attribute information to facilitate the management of environmental pollutions *
Corresponding author: Manouchehr Omidvari, Email: omidvari88@yahoo.com
impacts in the vicinity of highways. It uses advances in acoustics and computer technology to improve the accuracy and ease of modeling highway traffic noise, including the design of efficient, cost-effective highway noise barriers [ 11].
Abo-qudais and Alhiary developed three statistical models for predicting equivalent, maximum and minimum noise levels at signalized intersections [ 19]. Tang and Wang analyzed the effects of urban forms on the noise magnitude. They showed that urban layouts in historical areas with narrower roads, complex road networks and a higher density of intersections lead to lower traffic volumes and thus lower noise pollution [ 20].
Two dimensional and three dimensional maps have been generated using GIS to analyze noise pollution [ 21]. Scientifically compared FHWA-TNM, ACN680, and HNP and concluded that HNP, and ACN680 are more suitable for assessing the noise level in their study area. The findings of the study showed that FHWA-TNM 2.5 over-predicts the absolute noise levels by an average error of 2.0 dBA compared to field measurements with soft ground, while HNP predicts more accurate absolute noise levels with an average error of 0.5 dBA. Morallis and et al. assessed the noise in Caracas through categorizing the city streets to four groups based on their use. They presented several noise density maps in which all the measured points have noise higher than 50 dB [ 22].
A model of highway traffic noise was formulated base on vehicle types [ 23]. Pamanikabud and Tharasawatpipat investigated two existing and widely used traffic noise prediction models, namely, FHWA-TNM, and the UK’s Department of Environment (DOE) [ 3]. The two models were tested to compare their effectiveness when applied to the highway traffic and roadway conditions in Singapore [ 24].
Golmohamadi and his colleagues proposed a new model for predicting noise in Iranian cities, known here as Iranian Traffic Noise Prediction (ITNP) [ 25]. The prediction model is a statistical regression model based on A-weighted equivalent noise level for Iranian traffic conditions [ 26].
This study aimed at: quantifying temporal and spatial dynamics of urban traffic-induced noise pollution in the first districted of Tehran; assessing noise levels based on national and international criteria; evaluating the results of FHWA and ITNP models; and
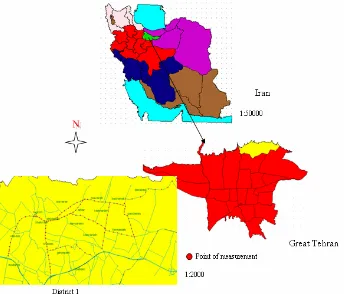
points data collected in the field using calibrated sound level meters CELL-450 and Quest-2900. Preliminary traffic information was obtained through city authorities. Measurements were done at the traffic peak time and also when the traffic was at its minimum, during three successive months. The numbers of crossing vehicles as well as their speeds were documented. All data processing was carried out in ArcGIS, and SPSS-W software environment. The study area of this research was the first district of Tehran, the capital city of Iran that is located in latitude 35° 45', North and Longitude: 51° 30', East (Fig. 1). The district faces a heavy traffic jam, and as such all major roads are the subjects of this research. In the 20th century, Tehran faced a large migration of people from all around Iran such that the city population reached to 11 million people in 2006. More than 3 million cars are running in the city now. A survey of urban noise was done to determine the positions of measurements using the available city maps and Ikonos imagery. Four types of survey practices were identified: receptor-oriented, source-oriented, randomly chosen, and density-oriented sampling methods [ 10]. In order to reduce any systematic tendencies, random sampling was exercised in this research.
For each location an 8 minutes observations were gathered, and a weighted continuous equivalent sound level Leq together with L10, L50, L90, Lmax and Lmin were estimated at 1.5m above ground level. Measurement locations and its distribution were depicted in Fig. 1 and Table 1. All the measurements were done in the peak of traffic during three months in the worst and the best traffic conditions. At the first step, measurements were performed at a distance of 0 m from the signal stop line. At last in order to test noise models, several points at distances of 100 and 200 meters from the main streets were also measured. Traffic flow is gathered from traffic control web cameras. In addition, passing vehicles are recorded in place. The measurement is performed in two distinguished classes: heavy traffic (less than 5 km/h speed) and low traffic (greater than 5 km/h). The number of heavy trucks and busses are also gathered and uploaded to the models. Statistical values (Standard errors, mean errors, etc.) were then computed for each station.
of trucks, means speed of car, road section length and road section gradient. The road section gradient is between 3 to 5 percent. The means of road section length is 1827±345 meter. The results are then scientifically compared. A loosely-coupled architecture was designed and implemented to invoke noise models from GIS software. Loosely coupled architectures were considered useful since the source data is subject to frequent changes. Loosely coupled architecture describes an approach where integration interfaces are developed with minimal assumptions between the sending/receiving parties, thus reducing the risk that a change in one application/module will force a change in another application.
In this research different modules implemented using widely used standards as standalone utility services such as interpolation service, statistical parameters calculation service, and GPS data retrieve [ 16]. The mentioned services provide a loosely coupled architecture from which various business processes can be assembled (Fig. 2). The term loose coupling is used since prediction models and GIS have enough coupling, to allow the transfer of data for pre-processing and displaying results. To have close coupling would require that the GIS and the model share the same data structures, which is not be appropriate for disparate systems. The positional changes of noise were mapped using ordinary co-kriging interpolation technique in ArcGIS software environment. Co-kriging is a statistical interpolation method that uses data from multiple data types to predict values of the primary data type. Co-kriging also provides standard errors of the predictions.
Co-kriging is a moderately quick interpolator that can be exact or smoothed depending on the measurement error model. Co-kriging allows investigation of graphs of cross-correlation and autocorrelation. Its main advantage over other interpolation techniques is that it assigns weights to observations on the basis of the form of the variogram (or related function) rather than assigning some arbitrary weighting function. A variogram based on the error statistics were generated. The variogram (also known as the semivariogram) is the most commonly used measure of spatial variation in geo statistics. Ordinary co-kriging with the spherical variogram of distance to-road is fitted to create noise maps in this research.
Fig. 1. The study area and the locations of measurements
Amar 78.6±0.6 69.1±1.2 100±1.3 89.7±2.2 52.3±0.7 50.6±0.4 Farmanieh 75.4±2 64.1±1.4 95.2±2.8 85.7±1.3 57.7±2.1 49.9±1.2 Kashanak 75.8±1.7 65.3±1.1 92.7±4.1 84.4±0.7 58.3±0.9 52.2±0.1 Darabad 75.1±2.8 66.7±3.3 91.8±3.7 86±2.7 56.2±2 50.3±1.3
RESULTS
The mean noise levels of all the measured points remained within the limits of [76.7±1.8 dB and 67.6±3.1 dB] (Table 1).
The analysis of mean values of 282 measurement locations indicated that the limit values specified by the International Standards Organization ISO 1996-1 and 2, and local standards were exceeded at 95% of points. With regards to street’s slope affect on the noise, it was observed that moving upwards generate higher level of noise when compared to downward movements. Specifically, the amount of indicator Leq in upwards movement is 76.5±3.2 dB and downwards is 71.3±2.8 dB. T-pair test revealed that the two sets are statistically similar at a 95% confidence level. The little variation was attributed to the slight slopes of the study area. Table 2 represents the L10, L50, L90 values at the measurement stations. The statistical results showed that the amounts of Leq in different traffic density conditions have meaningful variations at a 95% confidence level. Similar conclusions were made for other values such as L10, L50, L90 at two different conditions of low and high traffic times. In order to test the FHWA-TNM and ITN
models, environmental conditions dominant over the region (height of the buildings, coverage layer, and the condition of street surface texture etc.) were measured. Fig. 3 present comparison between two models FHWA and ITNP around the street. The noise magnitudes at 100 and 200 meters away from the streets were computed through the models and compared with field observations. The two models passed from statistical tests, and, therefore their differences are meaningless at a 95% confidence level.
Such findings proved the validity and the accuracy of the models in the study area. Fig. 3 represents the variation of the models around the streets.
Fig. 4 demonstrates the spatial distribution map of traffic noise in the heavy traffic time based on the ordinary co-kriging method.
Fig. 5 demonstrates the spatial distribution map of traffic noise in the low traffic time based on the ordinary co-kriging method.
DISCUSSIONS
In this research, traffic-induced noise levels of the city of Tehran district 1 were measured during the pick
Table 2. The mean values of L10, L50 and L90 in various traffic loads
L10 (dB) L50 (dB) Lp90 (dB)
Traffic density Traffic density Traffic density Street
Fig. 3. Comparison between two models FHWA and ITNP around the street
Fig. 4. Spatial distribution map of traffic noise in high traffic load
based on the ordinary co-kriging method Fig. 5. Spatial distribution map of traffic noise in low traffic time based on the ordinary co-kriging method.
and low traffic times and compared with the national and international limit values for noise. The results showed that the measured noise levels exceeded the limit values except for 5% of points. The statistical assessment showed that there exist significant spatial-temporal variations of traffic noise in the study area. The evaluations were also revealed that the results of the two competing traffic noise models; FHWA-TNM and ITNP were statistically similar.
Processed data, spatial analysis and models are loosely-integrated within the framework of the GIS project, enabling urban authorities to address environmental protection issues. Such configuration allows subsystems to operate independently of each other, and to have data sharing transparent to the end-user. An ordinary co-kriging is performed to estimate the noise magnitudes and map the noise levels. Co-kriging is a moderately quick interpolator that can be exact or smoothed depending on the measurement error model. Co-kriging also provides standard errors of the predictions. This research indicated that the upward and downward movements of heavy vehicles result in statistically similar noise levels. The reason was assigned to the study area’s slight slopes. Li and his collogues developed an integrated GIS traffic noise
prediction model based on data obtained from Beijing highways and neighborhoods. The model produced results comparable in accuracy with those of the FHWA-TNM model already in use in China. The integrated noise-GIS system provides general functions for noise modeling as well as tools for noise abatement design. The new system has improved both the accuracy and efficiency of urban noise management in the Chinese contexts. The paper also statistically confirmed the use of FHWA-TNM to predict sound pollution caused by traffic [ 1].
Mr. R. Norouzi and Mr. M. Rezaee for the data collection and Islamic Azad University, Qazvin branch for its financial support throughout the study. The authors declare that they have no conflicts of interest.
REFERENCES
1. Li B, Shu T, Dawson RW. A GIS based road traffic noise prediction model. Appl Acoust 2002; 63: 679-691.
2. Ohrstrom E, Hadzibajramovic E, Holmes M, Svensson H. Effects of road traffic noise on sleep: Studies on children and adults. J Environ Psycho 2006; 26(2): 116-126.
3. Pamanikabud P, Tharasawatpipat C. Modeling of urban area stop-and-go traffic noise. Journal of Transportation Engineering, Am Society of Cil Eng (ASCE) 1999; 125(2): 152–159.
4. Bjork J, Ardo J, Stroh E, Lovkvist H, Ostergren P, Albin M. Road traffic noise in southern Sweden & its relation to annoyance, disturbance of daily activities and health., Scand J Work Environ & Health 2006; 32(5): 392-401.
5. Enmarker I. The effects of meaningful irrelevant speech and road traffic noise on teachers attention, episodic and semantic memory. Scand J of Psychol 2004; 45(5): 393-405.
6. Jevic J, Belojevic G, Paunovic K, Stojanov V. Road traffic noise and sleep disturbances in an urban population: Cross–sectional study. Croatian Med J 2006; 47(1): 125-133.
7. Omidvari M, Nouri J. Effects of noise pollution on traffic policemen. InterJ Environ Res 2008; 3(4): 645-652.
8. Stansfeld SA, Berglund B, Clark C, Lopez-Barrio I, Fischer P, Ohrstrom E. Aircraft and road traffic noise and childrens cognition and health: A cross-national study. Lancet, 365. 2005; 1942–1949.
9. WHO. Guidelines for Community Noise. Geneva: World Health Organization, Guideline Document 2000.
10. Doygun H, Gurun DK. Analysing and mapping spatial and temporal dynamics of urban traffic noise pollution: a case study
15. Alesheikh AA, Sadeghi Naeeni Fard F. Design and Implementation of a Knowledge Based System to Improve Maximum Likelihood Classification Accuracy" Canadian J Remote Sensing, 2007; 33(6): 459-467.
16. Amirian P, Alesheikh AA and Bassiri A. Standards-based, Interoperable Services for Accessing Urban Services Data for the City of Tehran. Comput, Environ Urban Systems 2010; 34(4): 309-321.
17. Alesheikh AA, Soltani MJ, Nouri N, Khalilzadeh M. Land Assessment for Flood Spreading Site Selection Using Geospatial Information System. Inter J Environ Sci Technol 2008; 5(4): 455-462.
18. Hosseinali F, Alesheikh AA. Weighting spatial information in GIS for copper mining exploration. Am J App Sci 2008; 5(9): 1187-1198.
19. Abo-qudais S, Alhiary, A. Statistical model for traffic noise at signalized intersections. Build Environ 2007; 42: 2939-2948. 20. Tang UW, Wang ZS. Influences of urban forms on traffic–
induced noise and air pollution: Results from a modeling system. Environ Model softw 2007; 22(12): 1750-1764.
21. Shu N, Cohn LF, Harris RA, Kim TK, Li W. Comparative evaluation of the ground reflection algorithm in FHWA traffic noise model (TNM2.5). App Acoust 2007; 68 (11): 1459-1467. 22. Morallis B, Gomez Escobar V, Mende Sierra JA, Gomez VR,
Trujillo Carmona R. An environmental noise study in city of Caceres, Spain. Appl Acoust 2002; 63(10): 1061-1070.
23. Pamanikabud P, Vivitjinda P. Noise prediction for highways in Thailand. Transp Res, Part D 2002; 7(6): 441-449.
24. Hankard M, Cerjan J, Leasure J. Evaluation of the FHWA Traffic Noise Model (TNM) for highway traffic noise prediction in the State of Colorado. Report No. CDOT-2005-21, 2006. 25. Golmohammadi R, Abbaspour M, Nassiri P, Mahjub H. Road
traffic noise model. J Res Health Sci 2007; 7(1): 13-17.