Rodolfo Savica, MD, PhD Lisa A. Cannon-Albright,
PhD
Stefan Pulst, MD
Correspondence to Dr. Cannon-Albright: lisa.albright@utah.edu
Familial aggregation of Parkinson disease
in Utah
A population-based analysis using death certificates
ABSTRACT
Objective:To describe clustering of death from Parkinson disease (PD) in relatives in a large US study.
Methods:We analyzed the Utah Population Database resource, which includes genealogy data of more than 2.7 million individuals linked to 519,061 individuals with a Utah death certificate (DC). We identified individuals whose DC included PD as a cause of death using ICD coding. In those individuals whose Utah DC listed PD as a cause of death, the relative risk (RR) of death with PD was determined among close and distant relatives using sex-, birth year–, and birthplace-specific rates.
Results:We identified 4,031 individuals whose DC indicated PD. Among 18,127 first-degree rel-atives of probands with a Utah DC, the RR of death with PD was significantly increased (RR5
1.82, 95% confidence interval [CI] 1.61–2.04). The RR of death with PD was also significantly increased among 40,546 second-degree relatives with a Utah DC (RR51.44, 95% CI 1.29– 1.60) and among 93,398 third-degree relatives with a Utah DC (RR51.10, 95% CI 1.03–1.18).
Conclusions:Significant evidence for excess familial clustering was observed for PD deaths. The excess familial clustering and the significantly elevated RRs for PD among close and distant rel-atives strongly support a genetic contribution to PD mortality. These results confirm and expand the results of previous studies of PD by quantifying the risk of PD death among more distant relatives.Neurol Genet2016;2:e65; doi: 10.1212/NXG.0000000000000065
GLOSSARY
CI5confidence interval;DC5death certificate;dGIF5distant Genealogical Index of Familiality;GIF5Genealogical Index of Familiality;ICD5International Classification of Diseases;PD5Parkinson disease;RR5relative risk;UPDB5Utah Population Database.
Parkinson disease (PD) is a progressive neurodegenerative disorder of middle age and the elderly.
PD is pathologically characterized by the deposition of protein aggregates of
a
-synuclein in the
nervous system that constitute Lewy bodies in the pathology examination. The incidence of PD
in the population is 18 per 100,000 person-years, and it is more frequent in men than in
women.
1The causes of PD are still unknown; however, it is widely accepted that a complex
relationship between lifelong environmental risk factors and genetic predisposition is crucial in
the development of PD. There is still limited knowledge on the familial aggregation of PD
because of methodologic limitations, small sample sizes, and the frequent lack of data for distant
relatives.
Researchers in Iceland
2previously published a population-based description of familial
aggre-gation of PD. The authors identified a genetic contribution to late-onset PD, separate from early
onset, and estimated relative risks (RRs) for PD in close relatives. To further explore the complex
gene
–
environment relationship of PD, we analyzed the Utah Population Database (UPDB), a
From the Department of Neurology (R.S.), Mayo Clinic, Rochester, MN; Division of Genetic Epidemiology (L.A.C.-A.), Department of Internal Medicine, and Department of Neurology (R.S., S.P.), University of Utah School of Medicine, Salt Lake City, UT; and George E. Wahlen Department of Veterans Affairs Medical Center (L.A.C.-A.), Salt Lake City, UT.
Funding information and disclosures are provided at the end of the article. Go to Neurology.org/ng for full disclosure forms. The Article Processing Charge was paid by the authors.
population-based resource linking death
certif-icates (DCs) from 1904 for the large
homoge-neous Utah population to Utah genealogic
data dating back to the mid-1800s. The
objec-tive of this study was to describe familial
clus-tering of PD in the Utah population, to
estimate the familial RR for PD mortality,
and to provide a current description of the risk
of PD in family members of patients with PD
using DC data.
METHODS Genealogic data.The UPDB includes birth and death data of more than 7 million individuals, with some records extending back more than 12 generations. This computerized ge-nealogic resource is derived from multiple record-linked data sources. The original Utah genealogy includes complete 3-generation genealogic data for the Utah Mormon pioneers (members of the Church of Jesus Christ of Latter-day Saints) and their descendants up to 1972.3 Since then, the original
genealogy data have been expanded with Utah vital records such as birth certificates (using father, mother, and child trios). For the analyses reported in this study, we consider only those individuals in the UPDB with at least 3 generations of genealogy data who are related to the original Utah genealogy.
Utah’s founding pioneers were composed of a sizable, largely unrelated mixture of Northern European populations.4This
pop-ulation continued to have high rates of immigration for years after Utah’s founding in 1847. Studies using pedigree data, migration matrices, and isonymy have all shown low levels of inbreeding and similarity to Northern European populations in the founding population of Utah.5,6
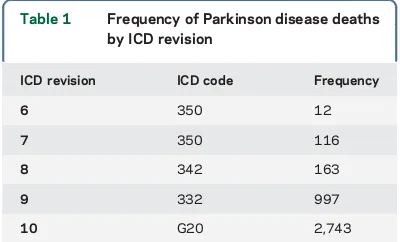
PD phenotype data.We analyzed more than 2.7 million indi-viduals in the UPDB belonging to at least 3 generations of genea-logic data and connected to the original Utah genealogy. Within this population of individuals with genealogy data, 519,061 indi-viduals had a Utah DC. The cause of death on Utah DCs was coded using the ICD, with the revision used (i.e., ICD-6 to ICD-10) depending on the decade of death. For all deaths occur-ring before 1956, ICD-10 coding was assigned. Table 1 shows the frequency of the 4,031 PD deaths by ICD revision; 2,546 of these deaths occurred in males and 1,485 in females. The majority of the deaths from PD were in more recent years; 2,407 deaths occurred after 1999.
Genealogical Index of Familiality.The Genealogical Index of Familiality (GIF) statistic was developed to test hypotheses con-cerning excess relatedness among individuals sharing a specific phenotype using the UPDB. The GIF analysis considers all genetic relationships between cases and measures the average
relatedness among all possible pairs within a set of individuals. The pairwise relatedness measure implements the Malécot coef-ficient of kinship, defined as the probability that randomly selected homologous genes from the 2 individuals are identical by descent from a common ancestor.
The case GIF is defined as the average of the coefficients of kinship between all possible pairs of cases (3105). The pairwise
relatedness of a set of cases is compared with the expected pairwise relatedness for a group of similar individuals in the UPDB. One thousand sets of matched controls that also had a DC were ran-domly selected from the UPDB. To test the hypothesis of no excess relatedness among the set of PD cases identified from DCs, the case GIF was compared with the empirical distribution of GIF statistics estimated from 1,000 sets of matched controls. Controls were randomly selected from all individuals with genealogic data and a DC and were matched to cases by birth cohort (5 years), sex, and birthplace (Utah or not).
These analytical methods, including GIF analysis, have been previously applied to describe the familial and genetic contribu-tion to mortality of multiple phenotypes, including intracranial aneurysms, influenza, asthma, and amyotrophic lateral sclerosis, among others.7–10
The GIF statistic can also be estimated while ignoring all close relationships (relationships closer than first cousins); this allows a test of the hypothesis that excess relatedness has been observed only for distant relationships, which are unlikely to share com-mon risk factors or exposures. This test is termed the distant GIF (dGIF) test and allows determination of whether the excess familial clustering observed might be due at least in part to a genetic contribution.
RR in relatives.To estimate the RR of PD among relatives, the observed number of PD deceased relatives was compared with the expected number of PD deaths in relatives. RR estimation is described below for the example of the RR of PD death among first-degree relatives of PD death cases. RR estimation is similar for other degrees of relationship.
All individuals in the UPDB who belong to at least 3 gener-ations of genealogy and who have a coded cause of death were assigned to 1 of 132 birth year–(5 years), sex-, and birthplace-specific (Utah or not) cohorts. The rate of death with PD for each cohort was estimated as the total number of individuals with PD reported as a cause of death in each cohort divided by the total number of individuals with a DC in the cohort.
The expected number of first-degree relatives dying with PD was estimated by counting all relatives of probands who have a DC (by cohort, each relative counted only once regardless of how many times he or she was identified as a relative of the degree of interest), multiplying the number of deceased first-degree rel-atives (per cohort) by the cohort-specific rate of death with PD, and then summing over all cohorts. RRs were estimated as the observed number of first-degree relatives with PD divided by the expected number of first-degree relatives with PD; this is an unbiased estimator of RR and is calculated similarly for different relationships. Two-tailed probabilities were calculated under the null hypothesis RR51.0, under the assumption that the number of observed deaths follows a Poisson distribution with mean equal to the expected number of deaths; confidence intervals (CIs) for the RR were calculated as described elsewhere.11
High-risk pedigrees.Using data for all ancestors of each PD case, all clusters of PD cases descending from a common ancestor can be identified. Using the same methods described for RRs, these clusters (or pedigrees) can be tested for a significant excess of PD cases by counting the observed PD deaths in the pedigree Table 1 Frequency of Parkinson disease deaths
by ICD revision
ICD revision ICD code Frequency
6 350 12
7 350 116
8 342 163
9 332 997
and estimating the expected number of PD deaths by applying the appropriate PD rates to all individuals in the pedigree with DC data.
Standard protocol approvals, registrations, and patient consents.This research was limited to the analysis of unidenti-fiable data. There was no contact with the individuals; waiver of informed consent was approved.
RESULTS GIF results for PD cases identified from Utah DCs. We identified 4,031 individuals in the UPDB with a DC indicating PD (table 1). The GIF test for excess relatedness for the 4,031 PD death cases is summarized in table 2. The sample size, aver-age case relatedness (case GIF), mean control related-ness (mean control GIF), and empirical significance for both the overall GIF (GIFp) and the dGIF test (dGIFp) are shown.
The GIF analysis for the 4,031 individuals dying from PD demonstrated excess relatedness than was expected (p,0.001). The results for the dGIF anal-ysis, which ignores all close relationships while testing for an excess of relatedness, show that the excess relat-edness is not only observed for close relationships but also for distant relationships (p50.001), which sug-gests that there is a genetic contribution to PD mor-tality, in addition to any shared nongenetic risks.
Because of concerns regarding missed diagnosis or misdiagnosis on DCs, an additional analysis was
performed. Assuming that more recent DC diagnoses are more accurate, only the set of PD deaths diag-nosed by DC after 1999 were considered. Results for the GIF analysis of these 2,407 cases are also shown in table 2 and the same conclusions are met.
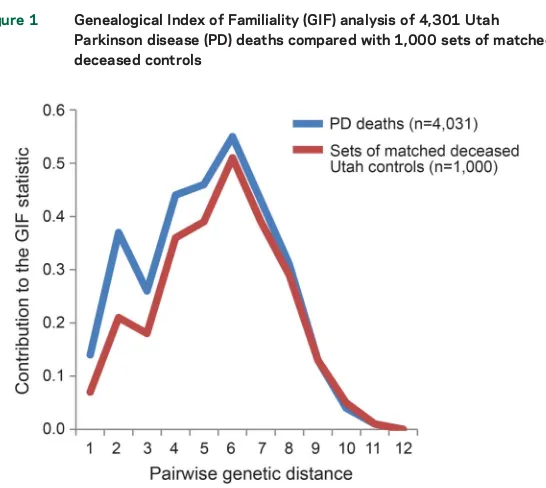
The GIF statistic summarizes pairwise relation-ships; the contribution from specific close and dis-tant relationships can be considered graphically. Figure 1 shows the distribution of the contribution to the overall GIF statistic (y axis) by the pairwise genetic distance (x axis) for cases and for the average of 1,000 sets of matched DC controls. A pairwise genetic distance of 1 represents parent/offspring, 2 primarily represents siblings, 3 primarily represents uncle/niece and other avuncular relationships, 4 primarily represents first cousins, and so forth. The case GIF contribution exceeds that of the aver-age control contribution for all relationships out to a genetic distance of 8 (third cousins), showing a statistical excess of both close and distant pairwise relationships and supporting a genetic contribu-tion, perhaps in addition to other nongenetic famil-ial factors that may be shared among close relatives.
RR results for PD.Estimated RRs for PD death among relatives of probands dying of PD are shown in table 3. Table 3 includes the type of relative, total number of relatives with DC data, the number of PD deaths observed in the relatives, the expected number of PD deaths in the relatives, the significance of the test, the estimated RR, and the 95% CI for the RR. RRs are shown for first-, second-, and third-degree relatives and are shown separately for the 3 different types of first-degree relatives (parents, siblings, and offspring) and for spouses. Significantly elevated RRs for PD death were observed in all relative groups considered. Significantly elevated risk for PD death was not observed among the spouses of PD death cases. Although significantly elevated RRs in first-degree relatives might indicate a genetic contribution to risk, a considerable amount of sharing of environmental risks can also be assumed among first-degree relatives and might explain the results. The significantly elevated RRs for second-and third-degree relatives, however, provide strong support for a genetic contribution to death from PD among individuals not likely to share a common environment.
RR estimates for first-, second-, and third-degree relatives of only the 2,407 PD deaths diagnosed after 1999 were all significantly increased and did not dif-fer from the estimates in table 3 (data not shown).
High-risk pedigrees.The GIF and RR results suggest the existence of high-risk PD mortality pedigrees. We identified all clusters of PD descending from a common founder pair. Not all such clusters of PD
Table 2 Genealogical Index of Familiality (GIF) analysis for excess relatedness for Parkinson disease (PD) cases
Group n Case GIF Mean control GIF GIFp dGIFp
PD cases from death data 4,031 3.13 2.60 ,0.001 0.001
PD cases dx>1999 2,407 3.04 2.65 ,0.001 0.002
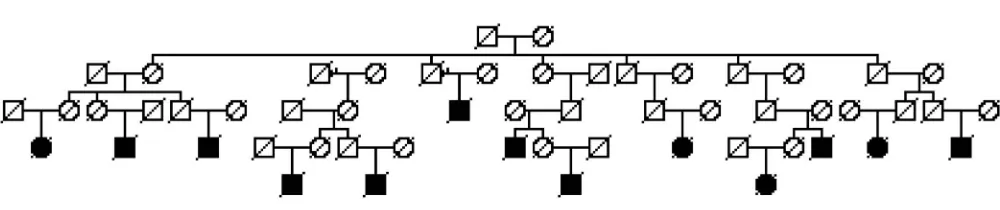
deaths represent high-risk pedigrees, as chance clustering can occur; large numbers of PD deaths might be expected in large pedigrees. We therefore identified those clusters (pedigrees) that had a significant excess of PD deaths among the descendants. Figure 2 shows an example high-risk PD pedigree. In the UPDB, there are more than 8,000 descendants of this founder pair; here only descending lines to all PD deaths are shown. There are 13 PD deaths observed among these descendants, but only 4.2 are expected (p50.0013).
Validation of parkinsonism and PD.To test whether the cases identified with DC coding were truly affected by parkinsonism and PD, a movement disor-ders specialist (R.S.) reviewed the medical records of a subset of the deceased cases identified. Records for all available PD cases diagnosed from DCs who were also seen at least 1 time in the University of Utah Hospital and Clinics (data from 1994) were reviewed. A total of 218 cases were reviewed; 128 of these cases (58.7% of the total) had a medical record noting a clinically confirmed diagnosis of PD and 11 had atyp-ical or secondary parkinsonism for a total of 139/218 (63.8%).
DISCUSSION Familial PD cases are recognized to be due to mutations in the LRRK2, PARK2, PARK7,
PINK1, orSNCAgene, or in genes not yet identified. Variants in these genes are reported to account for about 30% of familial PD cases.12 Given the likely
multifactorial nature of PD with multiple genes,
environmental exposures, and the interactions of both, it is no surprise that most familial PD cases remain
“unexplained” by known predisposition genes. More complete knowledge of familial clustering and risk to relatives can increase our understanding of this com-plex disorder. Identification of high-risk pedigrees is critical to identify predisposition genes.
The UPDB resource has been analyzed for more than 30 years to define the observed familial clustering of disease,7–9,13,14to detect evidence for a genetic
con-tribution to disease, and to identify high-risk pedigrees informative for predisposition gene identification. This unique Utah resource has enabled our population-based definition of familial clustering observed for PD and estimation of RRs for PD death among both close and distant relatives, allowing some discrimina-tion of likely genetic contribudiscrimina-tions. Specific high-risk pedigrees have been identified, which will be informa-tive for predisposition gene identification efforts.
A study of PD in a similar resource in Iceland presented evidence for familial aggregation of the subset of late-onset PD (defined as onset at age
.50 years)2and provided RRs for spouses and for
specific first-, second-, and third-degree relation-ships. There are 3 differences between the Iceland study and this Utah study: (1) this study used PD mortality whereas the Iceland study considered PD diagnosis, (2) this study analyzed 4,031 PD cases whereas the Iceland study analyzed 772 PD patients, and (3) although both populations are internally homogeneous, they are of different origin. In gen-eral, these 2 studies had very similar findings, but these and other differences may account for any differences in results reported.
We present an independent analysis of familial clustering of PD in a large resource representing many generations of the Utah population. This analysis of PD deaths in the homogeneous Utah population shows strong support for a genetic contribution to PD, based on multiple tests for familial clustering. We did not observe many early-onset PD deaths and thus considered only 1 PD mortality phenotype with death primarily.70 years.
The PD study in Iceland explored the familial aggregation of PD in an entire population. A database
Table 3 Estimates of relative risk for Parkinson disease
Relative n Observed Expected pValue RR 95% CI First 18,127 273 150.4 1.9e219 1.82 1.61–2.04
Parents 5,715 42 21.7 6.8e25 1.94 1.39–2.62
Siblings 9,995 193 108.3 1.5e213 1.78 1.54–2.05
Offspring 2,648 44 22.2 2.9e25 1.98 1.44–2.66
Second 40,546 325 225.9 3.6e210 1.44 1.29–1.60
Third 93,398 804 727.8 4.9e23 1.10 1.03–1.18
Spouses, all 2,645 32 29.1 0.64 1.10 0.75–1.55
Abbreviations: CI5confidence interval; RR5relative risk.
of 610,920 individuals including 772 cases of PD was analyzed. This Utah study with 4,031 PD cases similarly found significant excess clustering of PD cases and significantly elevated RRs for first-, all sec-ond-, and all third-degree relatives. PD RR estimates were higher in the Icelandic study than in the Utah study: RR for siblings56.7 (95% CI 4.3–9.6) and offspring53.2 (1.2–7.8) compared with the Utah RRs of 1.78 (1.5–2.1) and 1.98 (1.4–2.7) for sib-lings and offspring, respectively. The Utah study estimated RRs for all second-degree relatives at 1.44, compared with the Iceland study’s RR of 1.4 for the subset of second-degree relatives who were nieces and nephews. The Utah study estimated RRs for all third-degree relatives at 1.10, compared with the Iceland study’s RR of 1.4 for the subset of third-degree relatives who were first cousins. Neither the Iceland study nor the Utah study estimated the RR for spouses of cases to be significantly different from 1.0. Both analyses, 15 years apart in 2 different populations, showed strong evidence for a genetic contribution to PD.
Rocca et al.15also reported on familial aggregation of
PD in first-degree relatives of probands with PD who were representative of the Minnesota population. An RR51.71 was observed (95% CI 1.11–2.64); relatives of probands with younger onset had higher risk (RR5 2.62, 95% CI 1.7–4.2). These estimates are similar to the Utah estimates presented in this study.
This analysis has limitations that are primarily due to data censoring. Individuals could be censored based on lack of genealogy data, failure to link to Utah DC data, or death outside Utah. Nevertheless, PD death rates were estimated from the UPDB population of in-dividuals with a Utah DC, so although the rates of PD death used may not represent population rates, there is no bias expected for the tests of hypothesis performed. An additional limitation is the use of a cause of death listed on a Utah DC to diagnose PD. PD mortality cases could have been censored based on the failure to note PD as a cause of death; similarly, but much less likely, is the possibility that a diagnosis of PD appeared on a DC in error. The evidence for excess relatedness observed is likely conservative. In addition, the valida-tion that we performed, which was limited in ability to find all pertinent medical records, still found that 60% of the cases identified from DCs had evidence of a diagnosis of PD in their medical record.
We report the results of a large population-based familial aggregation study of PD mortality. Our study has dramatically expanded the original Iceland find-ings. We analyzed more than 700,000 deaths of indi-viduals who resided in Utah, identifying 4,031 individuals with PD diagnosis in the DC, and showed strong support for a genetic contribution to PD mor-tality. The Utah RR estimates provide further helpful
information to caregivers, patients, family members, and researchers in the field. Finally, we have identified a rich resource of pedigrees with not only a large num-ber of PD deaths but also a significant excess of PD deaths that are uniquely informative for current studies to identify predisposition genes.
AUTHOR CONTRIBUTIONS
R. Savica: drafting/revising the manuscript; study concept or design; anal-ysis or interpretation of data. L.A. Cannon-Albright: drafting/revising the manuscript; study concept or design; analysis or interpretation of data. S. Pulst: drafting/revising the manuscript; study concept or design; anal-ysis or interpretation of data.
STUDY FUNDING No targeted funding reported.
DISCLOSURE
Dr. Savica reports no disclosures. Dr. Cannon-Albright has received research support from National Cancer Institute, NIH, American Associ-ation for Cancer Research, US Department of Defense, Mayo Clinic Ro-chester, and Alex’s Lemonade Stand Foundation and holds a patent for BRCA1, BRCA2, and p16. Dr. Pulst has served on the editorial board of Journal of Cerebellum,NeuroMolecular Medicine,Continuum, Experimen-tal Neurology,Neurology: Genetics,Nature Clinical Practice Neurology, and Current Genomics; holds patents for Nucleic acids encoding ataxin-2 binding proteins, Nucleic acid encoding Schwannomin-binding-proteins and products related thereto, Transgenic mouse expressing a polynucleotide encoding a human ataxin-2 polypeptide, Methods of detecting spinocerebellar ataxia-2 nucleic acids, Nucleic acid encoding spinocerebellar ataxia-2 and products related thereto, Schwannomin-binding-proteins; and Compositions and methods for spinocerebellar ataxia; has received publishing royalties forThe Ataxias(Churchill Living-ston, 2007),Genetics in Neurology(AAN Press, 2005), Genetics of Move-ment Disorders(Academic Press, 2003),Neurogenetics(Oxford University Press, 2000), andMolecular Genetic Testing in Neurology, 2nd–5th(AAN Press, 1996); has served as a consultant for Ataxion Therapeutics; has served on speakers’bureaus for Athena Diagnostics, Inc.; has received research support from National Institutes of Health (RO1NS33123, RC1NS068897, RC4NS073009, R21NS079852, R21NS081182) and National Ataxia Foundation; has received license fee payments for tech-nology and/or inventions from Cedars-Sinai Medical Center; and has given expert testimony for Hall & Evans, LLC (Denver, CO). Go to Neurology.org/ng for full disclosure forms.
Received September 10, 2015. Accepted in final form February 18, 2016.
REFERENCES
1. Savica R, Grossardt BR, Bower JH, et al. Incidence and pathology of synucleinopathies and tauopathies related to parkinsonism. JAMA Neurol 2013;70:859–866. 2. Sveinbjornsdottir S, Hicks AA, Jonsson T, et al. Familial
aggregation of Parkinson’s disease in Iceland. N Engl J Med 2000;343:1765–1770.
3. Skolnick M. The Utah Genealogical Database: A Resource for Genetic Epidemiology. New York: Cold Spring Har-bor LaHar-boratories; 1980.
4. Cannon-Albright LA, Farnham JM, Thomas A, Camp NJ. Identification and study of Utah pseudo-isolate popula-tions-prospects for gene identification. Am J Med Genet A 2005;137A:269–275.
5. Jorde LB, Morgan K. Genetic structure of the Utah Mormons: isonymy analysis. Am J Phys Anthropol 1987;72:403–412. 6. McLellan T, Jorde LB, Skolnick MH. Genetic distances
7. Albright FS, Orlando P, Pavia AT, et al. Evidence for a heritable predisposition to death due to influenza. J Infect Dis 2008;197:18–24.
8. Cannon Albright LA, Camp NJ, Farnham JM, et al. A genealogical assessment of heritable predisposition to aneurysms. J Neurosurg 2003;99:637–643.
9. Teerlink CC, Hegewald MJ, Cannon-Albright LA. A genealogical assessment of heritable predisposition to asthma mortality. Am J Respir Crit Care Med 2007; 176:865–870.
10. Gibson SB, Figueroa KP, Bromberg MB, et al. Familial clustering of ALS in a population-based resource. Neurol-ogy 2014;82:17–22.
11. Agresti A. Categorical Data Analysis. New York: Wiley; 1990.
12. Klein C, Westenberger A. Genetics of Parkinson’s disease. Cold Spring Harb Perspect Med 2012;2:a008888. 13. Kauwe JS, Ridge PG, Foster NL, Cannon-Albright LA.
Strong evidence for a genetic contribution to late-onset Alzheimer’s disease mortality: a population-based study. PLoS One 2013;8:e77087.
14. Cannon-Albright LA, Thomas A, Goldgar DE, et al. Fami-liality of cancer in Utah. Cancer Res 1994;54:2378–2385. 15. Rocca WA, McDonnell SK, Strain KJ, et al. Familial
DOI 10.1212/NXG.0000000000000065
2016;2;
Neurol Genet
Rodolfo Savica, Lisa A. Cannon-Albright and Stefan Pulst
death certificates
Familial aggregation of Parkinson disease in Utah: A population-based analysis using
This information is current as of March 22, 2016
Neurology. All rights reserved. Online ISSN: 2376-7839.
an open-access, online-only, continuous publication journal. Copyright © 2016 American Academy of is an official journal of the American Academy of Neurology. Published since April 2015, it is
Services
Updated Information &
http://ng.neurology.org/content/2/2/e65.full.html including high resolution figures, can be found at:
References
http://ng.neurology.org/content/2/2/e65.full.html##ref-list-1 This article cites 13 articles, 2 of which you can access for free at:
Citations
http://ng.neurology.org/content/2/2/e65.full.html##otherarticles This article has been cited by 1 HighWire-hosted articles:
Subspecialty Collections
m
http://ng.neurology.org//cgi/collection/parkinsons_disease_parkinsonis
Parkinson's disease/Parkinsonism
http://ng.neurology.org//cgi/collection/basal_ganglia
Basal ganglia
http://ng.neurology.org//cgi/collection/all_genetics
All Genetics
following collection(s):
This article, along with others on similar topics, appears in the
Permissions & Licensing
http://ng.neurology.org/misc/about.xhtml#permissions its entirety can be found online at:
Information about reproducing this article in parts (figures,tables) or in
Reprints
http://ng.neurology.org/misc/addir.xhtml#reprintsus Information about ordering reprints can be found online:
Neurology. All rights reserved. Online ISSN: 2376-7839.
an open-access, online-only, continuous publication journal. Copyright © 2016 American Academy of is an official journal of the American Academy of Neurology. Published since April 2015, it is