Vol. 3, No. 2, pp. 137-146, April (2020)
Optimum Design of a High-Temperature
Superconducting Induction/Synchronous Motor
to Increase Torque Density Using Collective
Decision Optimization Algorithm
Vasiye Lohrasbi Nichkuhi
1, Milad Niaz Azari
2,, and Seyed Abdolah Mousavi
3Department of Electrical Engineering, University of Science and Technology of Mazandaran, Behshar, Iran
Today, with the rapid advances in technology and the expansion of industries, electric motors are used extensively and consume a large part of the electrical energy produced by power plants. Therefore, researchers and experts have always been seeking solutions to make electric motors with high reliability and low losses. The machines are made of a high- temperature superconducting motor with high efficiency, came to be called high-temperature superconductor/induction synchronous motor. This paper studies the high-temperature superconducting induction/synchronous motor (HTS-ISM). The torque density and structural dimensions of HTS-ISM are optimized using one of the newest optimization methods, the collective decision optimization algorithm (CDOA). The results show a torque of about 51.75% increase via the optimization process. Also, the particle swarm optimization algorithm (PSO) as a commonly used optimization method is employed to compare the results. The comparison proves the high capability of the CDOA method to optimize the motor design parameters. All algorithms in this paper are run with the MATLAB software package.
Article Info
Keywords:
Collective decision optimization algorithm, High-temperature superconductor,
Induction/Synchronous motor, Torque density Article History:
Received 2019-03-01
Accepted 2019-09-03
I.
INTRODUCTIONToday, with the advancement of technology and the expansion of industries, electric motors are used extensively and consume a large part of the electrical energy produced by power plants [1]. Therefore, researchers have always been trying to make electric motors more reliable with lower losses.
Using superconducting materials, a new electric motor has
been designed that has a lot of advantages over the traditional motors, called the high temperature superconductor (HTS) motor.
The HTS motors are used to propel ships, submarines, and aircraft. Several experiments have concluded that the HTS machines have significant advantages, such as smaller size, lighter weight, and higher efficiency. They also consume less energy and fuel to generate power, which reduces carbon dioxide emissions. The HTS generator series, the ability to withstand high centrifugal force and high current flow, also requires a special cooling system for rotary winding and most components need a new design [2].
† Corresponding Author: [email protected]
Tel: +98-1134552000,Fax: +98-1134552004, University of Science and Technology of Mazandaran
Assistant Professor of Electrical Engineering, University of Science and Technology of Mazandaran, Behshar, Iran
In the process of presenting the paper, introduce and investigate HTS-ISM [3] and CDOA algorithm [6], then calculated optimum torque density of HTS-ISM by CDOA algorithm and present the results of the studies. These results indicate that using the superconductor in the HTS motor of the torque engine significantly increases, and the structural dimensions of the motor are reduced.
II.
HTS-ISM
These machines are made up of a high-temperature superconducting motor with high efficiency. These machines are called Super-Temperature and Synchronous Inductors (HTS-ISM). The first thing to do in these motors is the rotor winding (secondary)(Fig.1). The rotor and the end ring are made of superconducting material. The advantages of the HTS-ISM are (1) despite the synchronization, it works well in the event of a slipping operation, (2) the motor drive has high efficiency in steady state, (3) against overload, the state of the synchronization resists vibration mode, (4) the torque density is increased by increasing the current through the winding, and (5) autonomy stability against variable speed control with the aid of nonlinear flow mode[3].
Fig.1. Schematic diagram of rotor (secondary) windings. Rotor bars are located in the rotor core (silicon steel), and then short-circuited by the
endrings [4]–[5].
III.
P
ROBLEM DESCRIPTIONBecause of high load torque in the industry, the torque of the superconducting induction-synchronous motor like the other motors is one of the most fascinating fields of study.
The paper aim is to optimize the superconducting induction/synchronous dimensions to maximize the output torque using one of the new algorithms.
1Bismuth strontium calcium copper oxide
A. The objective function
The HTS-ISM has a higher torque than the traditional motors. The maximum synchronous torque is based on the nonlinear electrical equivalent circuit that can be calculated by Eq [5].
c s sm
sm I
pole p
P
2 /
2
(1)
where, ξ, p, φs, Ic, and ω, denote the phasenumber, the pole
number, the air-gap trapped magnetic flux,the critical current
of one phase and the angular frequency, respectively. The
superscript ' denotes that the value is converted to the stator
primary side. The maximum synchronous power Psmis also
expressed in the equations. Further, the value of φs is
formulated as follows:
(2)
(2)
where, V1, l1 + l2, and r1 show the primary phase voltage, the
total leakage inductances and the stator resistance,
respectively. It should be noted that Ic is determined by the
averagecritical current of the BSCCO1 tapes.
(a)At asynchronous speed (slipping)
(b)At asynchronous speed
Fig. 2. Equivalent circuits of the HTS induction motor in steady-state [5].
The equivalent electrical circuit is similar to the equivalent circuit, such as the synchronous motor (Fig. 2); because the squirrel-cage winding acts as a permanent magnet due to the persistent current [5].
The following equation is used to calculate the self- inductance of the stator [8]:
)
(
)
1
(
)
(
4
1 2 2
2 0
1
D
x
x
p
N
k
k
l
l
a a wa at p
(3)
c
c
sI
r
I
l
l
V
12 2 1 2
2 ) )( 1( 2 1 ) ln( 4 1 4 1 2 ) ( ) 1( 2 2 2 ) 2 ( 4 2 4 1 ) ( 4 4 4 4 2 2 2 4 2 2 1 p R R x x x x p R R x p p x p x p p x D si ao p si ao p p p (4) ao ai
R
R
x
(5))
2
(
)
2
sin(
wae wae ak
(6)where
p
is the number of pair of poles,l
ais the effectivestator length,
N
atis the number turn of the stator,R
ai is thestator inner radius,
R
aois the stator outer radius,k
wais thestator winding coefficient, and
wae is the stator electricangle.
The following equation is used to calculate the self- inductance of the rotor [8]:
)
(
)
1
(
)
(
4
1 2 2 2 02
D
y
y
p
N
k
l
l
p at f f
(7) 2 ) )( 1 ( 2 1 ) ln( 4 1 4 1 2 ) ( ) 1 ( 2 2 2 ) 2 ( 4 2 4 1 ) ( 4 4 4 4 2 2 2 4 2 2 1 p R R y y y y p R R y p p y p y p p y D si fo p si fo p p p (8) fo fiR
R
x
(9))
2
(
)
2
sin(
wfe wfe fk
(10)where
p
is the number of pair of poles,l
f is the effectiverotor length,
R
fi is the rotor inner radius,R
fois the rotorouter radius, and
wfe is the stator electric angle.B. Collective Decision Optimization algorithm (CDOA)
The researchers have explored a new heuristic algorithm called the collective decision optimization algorithm (CDOA) that can be designed using a new way to generate vectors and combine them with precise information from the search space. In other words, the search space around each member can be sampled by increasing the number of selectable responses based on a specific rule.
This algorithm, like other nature-based approaches, is a population-based search approach that includes a population of candidate and potential responses to achieve Uses the overall optimal response. Each agent, on the basis of different locations, provides a number of possible and improved responses based on a multi-stage location selection plan. These responses refer to a new location generated by the previous move and are defined as the starting point of the next move, which is guided by other special locations. This method, on the one hand, will be beneficial in that the best overall response will change its position abruptly and randomly. This move will act as a local searcher. In some cases, a large number of probabilistic responses are generated randomly and around the overall optimal response. Therefore, it will be beneficial to increase the number of similar responses for each agent in order to sample the search space in a regular way and better search for the optimal overall response. In fact, when faced with an overwhelming problem, we form a group of different people with different abilities so that the best decision can be made to solve the problem. At this meeting, a group of individuals takes a unique decision or takes a particular view whose final result is the selection of the best decision[6].
1) Group generation
In order to simulate the decision behavior clearly, it is assumed that the initial population with N agents is randomly sampled from the feasible solution space [6].
N
i
t
x
t
x
t
x
t
X
i(
)
(
i1(
),
i2(
),...,
iD(
)),
1
,
2
,...
(11)D
k
LB
UB
r
LB
x
ik
k
(
k
k),
1
,
2
,...,
(12)
(13)
where N is the population size, D denotes the dimension of
optimization problem, t is the current number of generation, r
is a random number between 0 and 1, and LB and UB are the
lower and upper bounds of variables, respectively.
2) Experience-based phase
In the meeting, for an issue, decider’s first reaction is to ponder and develop a preliminary plan based on personal experience accumulated from daily life.
In CDOA, personal experience is determined as the best
))
(
),...,
(
),
(
(
)
(
t
X
1t
X
2t
X
t
location of individual (φp) so far. The operator is expressed as follows [6]:
0 0
0
X
(
t
)
step
(
t
)
d
newX
i
i
size
(14))
(
00
X
t
d
i(15)
where τ0 is a random vector with each member in the range
(0 ,1), stepsize(t) denotes the step size of the current iteration,
and d0 is the direction of movement.
3) Others’-based phase
They interact with other members randomly. We know that the decider can take something new if another decider is better than him in discussions and communication. In CDOA model,
the individual (Xj(t)) is randomly selected from the population,
and it is better than the current member (Xi(t)) in terms of
fitness value. The calculation formula is premeditated as follows [5]:
1 1
0
1
X
(
t
)
step
(
t
)
d
newX
i
i
size
(16)))
(
)
(
(
11 0
1
1
beta
d
beta
X
t
X
t
d
j
i (17)where j defines a random integer in the limited area [1,N]. τ1
is a random vector with each number uniformly divided in the
interval (0, 1), step size(t) defines the step size of the current
iteration, d1 is the new direction of motion, and beta1 and
beta11 are the random numbers in the limited area (-1, 1) and (0, 2), respectively.
4) Group thinking-based phase
In the meeting, everyone can represent their situation
voluntarily. Then, the decision of each decider is influenced by
the collective thinking process. In the proposed model, for
simplicity, it can be assumed that the geometric center (φG) is
defined as the group's thinking position. From a statistical point
of view, the geometric center is an important digital feature and
represents the process of population changes at some levels [6].
N
i
N
i D i N
i i i N
G x t
N x N t x N t X t X t X
N 1 1 1
2 1 2
1 ()}
1 ,..., 1 ), ( 1 { ) ( ),... ( ), ( ( 1
(18)
Then, the new position of agent is calculated using the
following formula:
2 2
1
2 X (t) step (t) d
newXi i size (19)
)) ( (
22 1
2
2 beta d beta X t
d
G i (20)where τ2 is a random vector with each number uniformly
generated in the interval (0, 1), stepsize(t) denotes the step size
of the current iteration, d2 is the new direction of movement,
beta2 and beta22 are the random numbers in the range (-1, 1)
and (0,2), respectively.
5) Leader-based phase
The leader in one of the early deciders that play an important
role in overall decision making. It not only immigrates about
different impacts for other policymakers, but also determines
the path and outcome of the decision. In the proposed model,
Leader (φL) is considered the best person (the fittest element)
in population [5].
3 3
2
3
X
(
t
)
step
(
t
)
d
newX
i
i
size
(21)))
(
(
33 2
3
3
beta
d
beta
X
t
d
L
i (22)where τ3 is a random vector with each number uniformly
generated in the interval (0, 1), stepsize(t) denotes the step size
of the current iteration, d3 is the new direction of movement,
and beta3 and beta33 are the random numbers in the range (-1,
1) and (0, 2), respectively.
In addition, for convenience, we assume that the thought of the
leader or the program can only arbitrarily change itself. In our
model, it is better to slightly change its position using a random
walk strategy, which works as a local search. In this case, some
neighbors can be randomly built around the best solution.
1
,
2
,
3
,
4
,
5
,
W
q
newX
q
L q (23)where Wqis a random vector with each number in the range (0,
1).
6) Innovation-based phase
It is generally recognized that innovation not only breaks
down the bonds of convention, but also expands our horizons.
Some researchers believe that this is another effective way to
produce good designs in the decision making process. In our
model, innovation refers to making small changes among
variables. This is equivalent to a one-dimensional mutation
operator in the evolutionary methods. This operator can run as
follows [6]:
MF
r1 (24)
3
4 i
i
newX
)) ( ) ( ( )
( 2
4 LB p r UB p LB p
newX p
i (26)
where p is generated randomly in the range [1, D], r1 and r2
are two random values distributed in the interval (0, 1), MF is
the innovation (mutation) factor, which is a large amount to improve the diversity of the population to avoid early convergence in this study.
Another concern is to update the step size according to the
repetition (t). The size of a large search step (step size (t)) can
spread the generated vectors widely over the search space and
explore the search space effectively in the initial stage of
evolution. In other repetitions, a small step size focuses on the
range of solutions; and can, thus accelerate convergence.
Therefore, this study describes the impact using an adaptive
mechanism [6].
) 1 1 ( 7 . 1 2 ) (
T t t
stepsize (27)
where T is the maximum number of iteration.
As described above, the main pseudo code of the CDOA
algorithm is summarized as follows [6]:
Collective Decision Optimization Algorithm
Initialize a population (Pop) and termination criterion(T)
calculate the fitness of each search agent
The personal best location Pop, t=1;
while the termination criterion is not satisfied (t<T) do
Find the global best( )
compute the step size (
step
size(
t
)
) on Eq.(27)fori=1 N do
newpop []
if then
Calculate the new solutions (new Xq) by the Eq.(23)
newpop new Xq
else
Change the location of an agent by
Eq.(14)-(21) ,(24)-(26)
newpop [newXi0,newXi1,newXi2,newXi3,
newXi4p]
end if
Evaluate the fitness of newpop
Update Xi(t) and the personal best location using
the best on among these resultant positions
end for
t=t+1;
end while
Output the best candidate solution
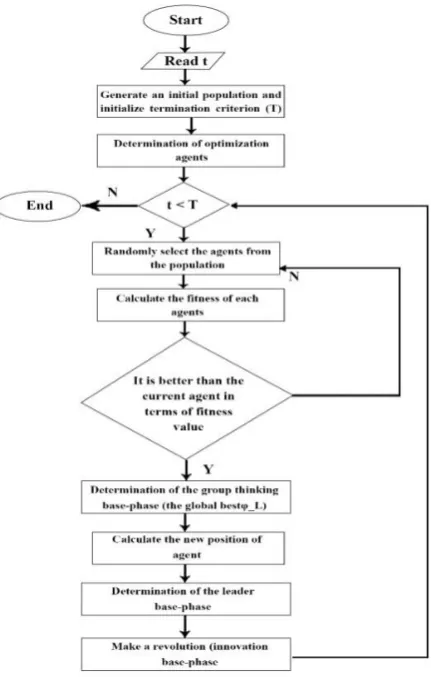
Also the flowchart for this algorithm is depicted in Fig.3.
Fig. 3. The flowchart of the CDOA algorithm
C. Parameters setting
The characteristics of HTS-ISM that we need to optimize are
shown in Table I.
L
L
International Journal of Industrial Electronics, Control and Optimization .
© 2020 IECO
…
142TABLE I.
SPECIFICATIONS OF HTS-ISM[1] Rotor Stator
--- 8
Number of pole
38 24
Number of slat
mm 50 mm 160 Inner diameter mm 159.4 mm 265 Outer diameter mm 206 mm 200 Core length ---30
Number of coil turns
A 2090 A 30.7 Critical current DI-BSCCO Type H DI-BSCCO Type ACT Material of conductor
Optimizing population size (N) and coefficient of revolution
(MF) are 50 and 0.8, respectively [6].
The constraints that were considered for the problem are:
-The inner diameter of the stator is in the range of 110 to 160
mm.
-The outer diameter of the stator is in the range of 215 to 265
mm.
-The length of the stator core is in the range of 150 to 200 mm.
-The inner diameter of the rotor is in the range of 0 to 50 mm.
-The outer diameter of the rotor is in the range of 110 to 154.9
mm.
-The length of the rotor core is in the range of 156 to 206 mm.
-The air gap should not exceed 0.6 mm.
IV.
SIMULATION
Using the MATLAB software, the CDOA optimization
algorithm and PSO optimization algorithm are used to optimize
the objective function according to the HTS-ISM specifications
and constraints.
A. Simulation results of CDOA
The results of this optimization are displayed in Fig. 4 -6.
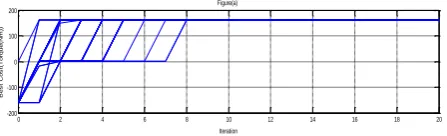
Fig. 4 .(a) The torque curve in 50 consecutive repetitions
(b)The main torque curve
Fig. 4. The optimized torque curve
Fig. 5. The optimized parameters curve
Fig. 6. The speed-torque curve
The HTS-ISM torque is 106.1 Nm [8], which, according to
Fig. 4, has an optimized torque when CDOA increases to
160.9705Nm. Regarding Fig.5, the optimized parameters of the
HTS-ISM reduce the volume and cost while increasing the
torque. Fig.6 shows the torque curve at different speeds with
0 2 4 6 8 10 12 14 16 18 20
-200 -100 0 100 200 B e s t C o s t( T o rq u e (N m )) Iteration Figure(a)
0 2 4 6 8 10 12 14 16 18 20
-200 -100 0 100 200 Itration M a in B e s t C o s t( M a in T o rq u e (N m )) Figure(b)
0 2 4 6 8 10 12 14 16 18 20
-200 -100 0 100 B e s t C o s t( T o rq u e (N Iteration
0 2 4 6 8 10 12 14 16 18 20
-200 -100 0 100 200 Itration M a in B e s t C o s t( M a in T o rq u e (N m )) Figure(b)
0 5 10 15 20 25
0 0.05 0.1 0.15 0.2 0.25 0.3 0.35 B e s t P o p ( O p t im u m P a r a m e t e r s ) Iteration
Inner diameter of stator Outer diameter of stator Core length of stator Inner diameter of rotor Outer diameter of rotor Core length of rotor
optimized dimensions.
The optimized values for the HTS-ISM dimensions are shown
in Table II.
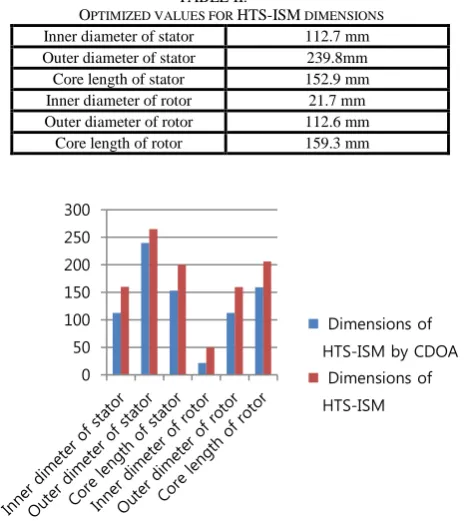
TABLE II.
OPTIMIZED VALUES FOR HTS-ISM DIMENSIONS 112.7 mm Inner diameter of stator
239.8mm Outer diameter of stator
152.9 mm Core length of stator
21.7 mm Inner diameter of rotor
112.6 mm Outer diameter of rotor
159.3 mm Core length of rotor
Fig. 7. Dimensions optimized by CDOA algorithm and its results compared with the real results for HTS-ISM.
The dimensions of the optimized HTS-ISM by CDOA are
significantly reduced with respect to Fig. 7. The results of this
optimization are as follows:
According to the HTS-ISM specifications, which has a torque
of 106.1 Nm, the torque optimized by the CDOA method is
160.9705 N.m, with a torque of about 51.75% increase.
-The internal diameter of the stator HTS-ISM is 160 mm, which
is optimized by the CDOA method to; 112.7 mm, i.e. 30%
lower.
-The outer diameter of the stator HTS-ISM is 265 mm, the
internal diameter of the stator, optimized with the CDOA
method; is 239.8mm, which is downgraded by 9.5%.
-The length of the core of the HTS-ISM stator is 200mm, the
stator core length optimized by the CDOA method is 152.9mm,
which is 23.5% lower.
-The internal diameter of the HTS-ISM rotor is 50 mm, the
internal diameter of the rotor is 21.7 mm CDOA, which is
reduced by 56.6%.
-The outer diameter of the HTS-ISM rotor is 159.4 mm, which
is optimized by the CDOA method is 112.6 mm, which to
29.5% lower.
-The length of the core of the HTS-ISM rotor is 206 mm, which
is optimized by the CDOA method to; 159.3 mm, which is
declined by 29.1%.
B. Simulation results of PSO
For the correctness and comparison of the CDOA optimization method, the optimization problem is optimized using a widely used method, PSO optimization, the objective function and the characteristics of the HTS-ISM that we need to optimize is objective function and the characteristics of the HTS-ISM use in CDOA algorithm. The results of this method are shown in Table III.
TABLE III.
THE OPTIMIZED VALUES OF THE HTS-ISM DIMENSIONS BY PSO METHOD
129.6 mm Inner diameter of stator
215.2mm Outer diameter of stator
197.1 mm Core length of stator
42.2 mm Inner diameter of rotor
129.3mm Outer diameter of rotor
163 mm Core length of rotor
Fig. 8. The dimensions optimized by the PSO algorithm And its results compared with the real results for HTS-ISM.
The dimensions of the HTS-ISM optimized by PSO are
significantly reduced with respect to Fig. 8.
The results of this optimization are as follows:
-The internal diameter of the stator HTS-ISM is 160 mm,
optimized by the PSO method to, 129.6 mm, which is 19%
lower.
-The outer diameter of the stator HTS-ISM is 265 mm, which
is optimized with the PSO method to, 215.2 mm, which is
downgraded by 18.7%.
0 50 100 150 200 250 300
Dimensions of HTS-ISM by CDOA Dimensions of HTS-ISM
0 50 100 150 200 250 300
Dimensions of HTS-ISM by PSO
-The length of the core of the HTS-ISM stator is 200 mm,
which is optimized by the PSO method is 197.1 mm, which is
1.45% lower.
-The internal diameter of the HTS-ISM rotor is 50 mm, reduced
by 15.6% to 42.2 mm by PSO.
-The outer diameter of the HTS-ISM rotor is 159.4 mm reduced
by 18.8% to 129.3 mm after optimization by the PSO method.
-The length of the core of the HTS-ISM rotor is 206 mm, which
is optimized by the PSO method to 163 mm, i.e. 20.8% lower.
C. Results Comparison
The values obtained from the CDOA and PSO methods are compared in Fig. 9.
Fig.9. The dimensions optimized by the CDOA algorithm and its results compared with the results for the dimensions
optimized by the PSO algorithm for HTS-ISM.
According to Fig.9, the dimensions optimized by the CDOA method have smaller dimensions and higher torque than the PSO method, so the dimensions obtained from the CDOA optimization process are used to compute the dimensions of the motor.
V.
C
ALCULATION OF THE DIMENSIONS OFTHE SQUIRREL CAGE ROTOR
The optimal dimensions of the squirrel cage rotor are obtained from the results of the optimization of the rotor and stator dimensions of the HTS-SIM.
A. Calculation of the dimensions of the rotor bar
The following equation is used to calculate the rotor bar dimensions [9].
r t
av ri
ro
b
C
B
B
D
D
S
W
(
)(
1
)
2
2 2
(28)
ro
rb
D
C
d
0
.
1
0
.
03
(29)2 2
)
(
D
D
sk
L
b
ro
ri
(30)b b
b
W
d
A
(31)where Wbis the rotor bar width, Sr is the number slot of rotor,
Dro is inner rotor diameter, Dro is the outer rotor diameter, Bav
is the airgap flux density, Bt is the teeth flux density, db is the
rotor bar depth, Lb is the rotor bar length, Ab is the rotor bar
area, and Cris the coefficient between 0.01 and 0.015 in[9].
which the dimensions are in inches.
Usually, the value of flux density in radial fluxes is selected to be between 0.32 and 0.56 Tesla [11]. The amount of flux density of the teeth is 1.7 Tesla [11].
Considering the above formulas and optimized dimensions, we have:
mm
Wb 2.13
mm
d
b
5
.
55
2
82
.
11
mm
A
b
B. Area of the end ring
The maximum current flow of the end ring is obtained from the product of the average flow of the rod and half the number of rods per pole. Assuming that the flow of the end ring changes sinusically similar to the flow of the bar, the effective value of the end-flow is calculated as follows [11]:
2 1 2 / 2
2
P Sr I
Ier b
(32)rewritten for simplification as follows:
2
P I S
I r b
er
(33)in which
I
er in the flow of the end ring andI
b is the flowof the rotor bar.
In general, the ventilation of the end rings is better than the rotor bars and the current density in the end ring can be equal to or slightly higher than the current density in the bar. In most cases, the dimensions of the end rings are chosen in such a way that their contribution to the rotor's winding resistance is minimal.
The cross-section of each ending loop is obtained from the following equation:
er r b er
J P
S I A
2
(34)
er b r b er
J J P
S A A
(35)
0 50 100 150 200 250 300
CDOA PSO
er
A
,J
er,J
b is end section of the cross-section, the flowdensity in the end ring, and the rod flow density, respectively. Given the equal flow density for the bars and the end ring, the cross-section of the end ring is calculated as follows:
2
88 .
17 mm
P S A
A b r
er
VI.
C
ONCLUSIONIn this paper, the torque and dimensions of the HTS-ISM were optimized using one of the newest optimization algorithms called collective decision algorithms. By this optimization, the torque of the HTS-ISM is increased. However, its dimensions are decreased. Increasing the torque is very desirable, on the other hand, reducing dimensions in addition to reducing weight and volume, also decreases the costs.The HTS-ISM torque was optimized with the PSO as one of the commonly used optimization methods. The optimized dimensions and torque of HTS-ISM were improved using PSO but CDOA optimization was shown to be better than the CDOA optimized dimensions.
R
EFERENCES[1] Hassan Moradi Cheshmeh Beigi, Alireza Mohamadi “Torque Ripple Minimization in SRM Based on Advanced Torque Sharing Function Modified by Genetic Algorithm Combined with Fuzzy PSO” International Journal of Industrial Electronics, Control and Optimization, Volume 1, Issue 1, Spring 2018, Page 71-80.
[2] Mardiha, M., and M. Vakilian. "Design and electromagnetic analysis of a superconducting rotating machine." Power Engineering Conference, 2008. AUPEC'08. Australasian Universities. IEEE, 2008.
[3] Nakamura, Taketsune, et al. "Tremendous enhancement of torque density in HTS induction/synchronous machine for transportation equipments." IEEE Transactions on Applied Superconductivity 25.3 (2015): 1-4.
[4] D. Sekiguchi et al., “Trial test of fully HTS induction/synchronous machine for next generation electric vehicle,” IEEE Trans. Appl. Supercond., vol. 22,no. 3, Jun. 2012, Art. ID. 5200904.
[5] Morita, G., T. Nakamura, and I. Muta. "Theoretical analysis of a YBCO squirrel-cage type induction motor based on an equivalent circuit." Superconductor Science and Technology 19.6 (2006): 473.
[6] Zhang, Qingyang, et al. "Collective decision optimization algorithm: A new heuristic optimization method." Neurocomputing 221 (2017): 123-137.
[7] J. Du, H. Love James, S. Roper, The innovation decision: an economic analysis,Technovation 27 (2007) 766–773.
[8] Muta, Itsuya, Tsutomu Hoshino, and Kenichiroh Hayashi. "Fundamental design and electrical characteristics of
superconducting commutatorless motor." IEEJ Transactions on Industry Applications 114.2 (1994): 197-206
[9] V. N. Mittle, A. Mittal, “Design of Electrical Machines”, Standard Publishers Distributors, fourth Edition, 1996.
[10]S. Sarma, V.K. Agrawal, S. Udupa, K. Parameswaran, "Instantaneous Angular Position and Speed Measurement
Using a DSP Based Resolver to Digital
Converter",Measurement, vol. 41, no. 7, pp. 788-796, August 2008.
[11]A. K. Sawhney, "A Course In Electrical Machine Design", Dhanpat Rai and Sons,New Delhi, 1989.
Vasiye Lohrasbi Nichkuhi was born in Chalus, Iran in 1993. She received her B.Sc. degree in electrical power engineering from the University of Mohaghegh Ardabili, Ardabil, Iran in 2015. She graduated in M.Sc. degree at the Department of Power Electronics and Electrical Machines, University of Science and Technology of Mazandaran, Behshahr, Iran in 2018.
Milad Niaz Azari was born in Babol, Iran in 1984. He received his B.Sc. degree in electrical engineering from the Noshirvani University of Technology, Babol, Iran in 2007. He graduated in M.Sc. degree at the Department of Electrical Engineering, Amir Kabir University of Technology, Tehran, Iran in 2009. Also, he received his Ph.Ddegree from the Amirkabir University of Technology, Tehran, Iran in 2013. Since 2014, he has been an assistant professor in the Department of Electrical Engineering at the University of Science and Technology of Mazandaran, Behshahr, Iran . His areas of interest are electrical machines design and power electronics.
IECO
![Fig. 2. Equivalent circuits of the HTS induction motor in steady-state [5].](https://thumb-us.123doks.com/thumbv2/123dok_us/15301.2001483/2.595.331.529.365.535/fig-equivalent-circuits-hts-induction-motor-steady-state.webp)