Issues
ISSN: 2146-4138
available at http: www.econjournals.com
International Journal of Economics and Financial Issues, 2017, 7(2), 365-369.
Palestine and Saudi Arabia, Two Different Countries with Two
Different Conditions: Are the Determinants of Capital Structure
of Corresponding Markets the Same?
Bashar K. Abu Khalaf
1*, Bara’ Al-Nees
2, Lilana Sukkari
31School of Business, The University of Jordan, Jordan, 2School of Business, The University of Jordan, Amman, Jordan, 3School of
Business, The University of Jordan, Amman, Jordan. *Email: [email protected]
ABSTRACT
This paper investigates the determinants of capital structure of two different countries, Saudi Arabia and Palestine. The analysis employs panel data analysis and seemingly unrelated regression based on a sample of 21 listed Palestinian companies and 61 Saudi companies. The study in this paper
extends from 2005 to 2015. The findings of this study indicate that the leverage ratios of both Palestinian and Saudi firms are low. Moreover, the most common determinants of capital structure are found and significantly affecting both Palestinian and Saudi firms, finally the differences in the magnitudes and sign of the coefficients are because of country-level differences and not due to firm-level differences.
Keywords: Capital Structure, Financial Markets, Saudi Arabia, Palestine
JEL Classifications: D53, E44, G31
1. INTRODUCTION
Generally, maximization of the firm’s stock price is the main objective of any firm world widely in order to maximize the stock’s price the firm should increase their benefits by increasing their
income and decreasing their costs and weighted average cost of
capital. Indeed, Myers (2001) stated that: “There is no universal
theory of the debt-equity choice, and no reason to expect one.”
Moreover, the management of each firm could decide the method of structuring their capital and cost of capital, based on the financial economics literature (Fernandez et al., 2013).
In corporate finance, the capital structure is one of the most
argumentative subjects and the researchers expanded in that
subject especially after the paper of Modigliani and Miller (1958).
Indeed, through that paper and the various theories such as the pecking order theory, trade-off theory, agency theory, and market
timing theory, the finance literature discussed many empirical
papers that illuminated the determinants of debt-to-equity option
of firms within countries and across countries such as Booth (2001) and Frank et al. (2009). Actually a lot of capital structure research
has concentrated on the factors that affect corporate financing attitude of the US firms, in recent years the capital structure
research has become increasing in a positive way, which gives the researcher the chance to do comparisons between countries and
between industries around the world (Chen, 2004).
On of the findings of aforementioned research was that for any firm’s capital structure, there are two sets of determinants, namely inner firm-specific, e.g., Management methodologies and general country- specific factors, e.g., political stability (Deesomsak et al., 2004). The current study built on this result where such
determinants were explored by conducting a comparison between
two countries in the Middle East and North Africa region with two
different distinctive political and economical states, Palestine and Saudi Arabia.
Non-financial firms on Palestine securities market (PSM) and Saudi Arabia stock exchange market (SSE) were compared in
a myriad of statistics, trends, and phenomena. For example, for
the year 2013, the total resident population of Palestine was 4.2 million, whereas for Saudi Arabia, it was 29.0 million. For the same year, the gross domestic product (GDP) of West Bank and Gaza Strip and Saudi Arabia were $ 11.3 billion and $ 748.0 billion, respectively. Additionally, the GDP per capital (purchasing power parity) in West Bank and Gaza Strip was $ 5000 and in Saudi Arabia was $ 55000. For 2015, the market capitalization of the PSM and SSE were $ 3.3 and $ 421 billion, respectively. Finally,
there are many unique political contextual circumstances where
PSE and SSE are embedded in (Omet et al., 2015).
2. LITERATURE REVIEW
Several studies were reviewed for the empirical investigation
of capital structure and found two clusters of research. The first cluster of studies focus was on “within countries” determinants and reported on firm-specific factors while the second cluster of these studies was “across countries” reporting on general or country-specific factors. On one hand, Alzomaia (2014) and Pratheepan and Yatlwella (2016) investigated the determinants of capital structure within single country. 93 listed companies in Saudi Arabia between 1999 and 2010 (Alzomaia, 2014) and 55 companies in Sri Lanka between 2003 and 2012 (Pratheepan and Yatlwella, 2016) were
studied. It was found that leverage was inversely related with
tangibility, profitability and risk whereas firm size and growth
opportunities were positively correlated with the former variable,
leverage. However, profitability and risk were the only significant determinants that influence capital structure-related decisions for Saudi Arabia’s listed companies.
In addition, Abu (2011) analyzed the relationship between the
capital structure and debt lifetime through listed companies on Palestinian stock market that operate within various economic
sectors (industrial, agriculture, trade and service). The results
showed that service companies have the highest total debt
ratio with 53.69%, followed by industrial, trade companies, and agriculture companies with 50.86%, 34.11%, and 24.02%, respectively. Similarly, Nduati and Guandaru (2014) investigated the determinants of capital structure in Kenyan private firms, surveying 30 companies and found that growth opportunities
have a positive relation with capital structure. Beside, Frank and
Goyal (2009) discussed the effectiveness of various factors in
the capital structure decision for listed US companies from the
period 1950-2003. The study showed that tangible assets, firm size, expected inflation, and industry leverage were positively correlated with leverage, however, profits and market-to-book ratio were negatively correlated with leverage. Similar findings were suggested in other studies such as Shah and Hijazi (2004) and Rajan and Zingales (1995).
On the other hand, for the second set of determinants, general or
country-specific, de Jong (2008) discussed capital structure across
the world by analyzing data on a sample of 42 countries. He argued
that firm-specific determinants of leverage are quite different from those of countries-specific. Further, Daskalakis and Psillaki (2007) examined “do country or firm factors explain capital structure?”
A sample of French and Greek small and medium companies
between 1998 and 2002, they found that there was a negative correlation between profitability and assets structure with the
leverage and a positive correlation between debt and assets ratio. Their conclusion was that small and medium companies in both countries followed the same process in making capital structure
choices. Likewise, Booth et al. (2001) investigated the capital structure in ten developing countries including Malaysia, Korea, and Zimbabwe, among others, between 1980 and 1993, using firm-specific and industrial factors. They found that both developed
and developing countries have related factors to explaining their capital structure. Indeed, the results indicate that tangibility and
size were positively related to leverage while profitability was
inversely related to leverage.
3. THEORETICAL FRAMEWORK
By reviewing the financial literature, the most two essential
theories that illuminate the determinants of capital structure are the trade-off theory and the pecking order theory. The trade-off
theory indicates that firms have a determined debt ratio and try
to achieve it; this theory is repeatedly considered as a competitor
theory to the pecking order theory of capital structure (Myers, 1984; Myers and Majluf, 1984). The pecking order theory debates that, due to unequal facts, firms adopt a hierarchical direction of financing favorites thus that inside financing is preferred over outside financing. If outside financing is required, firms first try to find debt funding while the equity is only issued as the last choice. Myers (1984) stated “you will refuse to buy equity unless the firm has already exhausted its ‘debt capacity’—that is, unless the firm has issued so much debt already that it would
face substantial additional costs in issuing more.” In more details
the trade-off theory argued that firms try to balance the benefits
and costs through selecting the best mix between debt and equity. The traditional explanation of this hypothesis belongs to Kraus
and Litzenberger (1973) who emphasized a balance between the
dead-weight costs of insolvency and agency costs and the tax
saving benefits of debt.
The main drive of this theory is to clarify the statement that companies usually are funded partially with debt and partially with
equity. It states that there is an advantage to financing with debt, the tax benefits of debt and there is a cost of financing with debt, the costs of financial distress containing indebtedness costs of debt and non-bankruptcy costs. The marginal benefit of additional increases
in debt drops as debt rises, while the marginal cost increases, so
that a firm that is improving its whole value should consider this
trade-off when choosing how much debt and equity to determine
for financing, so related to the trade-off theory companies should have much higher debt levels than we find in actuality.
On the other hand, the pecking order theory in sequence orders the
financing sources internal equity being the first preference where
the companies avoid market attention, external debt as the second preference because of the lesser information costs connected with
necessary thus the system of debt a company selects can appear
as a sign of its need for external finance and businesses are eager to sell equity if it is overvalued in the market (Myers, 1984; Chittenden et al., 1996).
The pecking order theory starts with irregular information by way
of managers know more about their corporation’s prospects, risks and value than external financiers. Asymmetric information effects the decision among internal and external financing and among the
issue of debt or equity. Asymmetric information favors the issue of
debt over equity as the issue of debt hints the board’s confidence that an investment is profitable and that the existing stock price is underrated. The issue of equity would signal a nonexistence of
confidence in the board of directors and that they feel the share
price is over-valued. An issue of equity would then lead to a
decrease in share price (Brealey et al., 2008).
4. THE PALESTINIAN AND SAUDI
MARKETS: SOME BASIC INFORMATION
The PSM was established in 1997 whereas the SSE was established in 1984. The financiers in the two markets follow the same mechanism to get their orders fulfilled by the order-driven system.
Actually, the SSE and PSE markets do not have experts to offer immediacy in exchanges for this reason all investors must deal with a broker to get their order executed, and commonly with other
alike markets, orders are ranked (for accomplishment) based on
price and thereafter time. The information reported in both Tables 1
and 2 is about the SSE and PES markets. When we compare the
two countries, we note that there is a vast difference in the number
of listed firms and also in the market capitalization. As noticed, the Saudi capital market is the largest. Moreover, we note that the turnover ratio (trading volume to market capitalization) in the PSE
is much lower than SSE. The Tables 1 and 2 show during the period
from 2005 to 2010 that the turnover ratio has fallen significantly
in both markets, but SSE was able to recover and has increased
its ratio from 12.9 in 2010 to 21 in 2015 (Table 2).
Table 3 shows the capitalization of every market comparative to the total capitalization of Arab markets. The reported results in the Table 3 reflect the fact that Saudi Arabia market has the highest percentage. Actually, in 2015, it accounted approximately 39%
of the capitalization of whole Arab markets, whereas the PSE market is larger than only the Sudanese and Algerian markets
with 0.31% in 2015.
5. DATA, METHODOLOGY, AND
ESTIMATED RESULTS
A quantitative analysis based on a sample of 21 listed Palestinian companies and 61 listed Saudi companies was applied. The time
frame for this paper is 2005-2015. In point of fact that the entire numbers of listed non-financial Palestinian and Saudi firms are
55 and 172 companies correspondingly, it could be said that our samples are well representative for both markets. Furthermore, and based on the available data, it would be interested to apply the following estimated model for our data samples:
Levi,t=β0+β1ROAi,t+β2Sizei,t+β3Growthoppi,t+β4Tangibilityi,t+εi,t (1)
The lev (the dependent variable) is the leverage ratio computed by
dividing total liabilities by total assets. The independent variables
are; the profitability which is return on assets (ROA), the size of
the company measured by the natural logarithm of total assets,
Growthopp (market value of equity to book value of equity) and tangibility (book value of fixed assets to total assets). ε is the
error term.
According to the statistical information reported in the Tables 4 and 5, we notice that the mean values of leverage are equal
to 39.5% (Saudi companies) and 37% (Palestinian companies). It is
observed that most of the Saudi and Palestinian companies do not
Table 1: Number of listed firms
Year Number of listed
firms (Palestinian market) firms (Palestinian market)Number of listed
2005 28 77
2010 40 146
2015 55 172
Source: Arab monetary fund, capital markets bulletins
Table 2: Relative size of stock markets ($ million)
Year The Palestinian market The Saudi market Capitalization Turnover
ratio Capitalization Turnover ratio
2005 3,157.2 0.184 646.120.8 0.612
2010 2,449.0 0.048 353,400.0 0.129
2015 3,334.3 0.035 420.656 0.21
Source: Arab monetary fund, capital markets bulletins
Table 3: Relative size (market capitalization) of Arab stock markets
Market 2005 2015
Abu Dhabi securities market 10.3 10.5
Amman securities market 2.9 2.4
Bahrain stock exchange 1.3 1.8
Saudi stock market 50.1 39.4
Kuwait stock exchange 9.6 8.2
Casablanca stock exchange 2.1 4.3
Algeria stock exchange 0.0 0.01
Tunis stock exchange 0.2 0.82
Dubai financial market 8.7 7.9
Khartoum stock exchange 0.3 0.15
Palestine stock exchange 0.3 0.31
Muscat securities market 0.9 3.8
Doha securities market 6.8 14.2
Beirut stock exchange 0.4 1.04
Cairo and Alexandaria exchanges 6.2 5.1
Total 100 100
Source: Arab monetary fund, capital markets bulletins
Table 4: Leverage ratios: Saudi and Palestinian firms
Measure Listed Palestinian firms Listed Saudi firms
Mean 0.370 0.395
Median 0.310 0.381
Maximum 0.901 0.850
borrow on the long-term base that is because the ratios are lesser
than companies which run in developed markets (about 50%).
Although, the Palestinian companies run within difficult political
and economic conditions, Table 4 surprisingly shows the fact that they have similar leverage ratios to Saudi companies, but it is clear that the standard deviation of the Palestinian leverage ratios is greater than in Saudi Arabian ratios. The mean natural
logarithm of total assets is equal to 6.981 for the Palestinian firms and 9.115 for the Saudi firms and this expected result due to the
much greater magnitude of the Saudi economy. Beside that the
dominant accounting performance (ROA) of the Saudi companies, it is close to 5.1%, this point out that the Saudi listed companies depend on real (fixed) assets. The final important indicator in
this Table 6 is the mean market to book ratio of 3.491 (Saudi companies) and 1.891 (Palestinian companies), this difference because of the superior performance of the Saudi firms. Table 6
report the results estimated from model (1) for each group of listed firms which indicate the followings:
1. The coefficient of company size (size) is significant in
Palestinian and Saudi companies. These outcomes support the
trade-off theory because larger firms depend on higher levels of debt in order to apply a diversification in their investments and then eliminate any possibility for financial distress. 2. The coefficient of accounting performance (ROA) is negative
and significant in the Palestinian and Saudi companies. This means that firms rely on fewer levels of debt in case they
achieve higher levels of income according to the pecking order theory.
3. The coefficient of asset structure (tangibility) is positive and significant in the Palestinian set only. The conditions of
Palestinian economy make it important to face the higher
levels of risk by the collateral of the fixed assets.
4. The effect of the market-to-book ratio on leverage is
significant in both the Saudi and Palestinian sets. In more
details, the Saudi result is consistent with the agency theory the shareholders in higher levels growth companies force managers to get more debt because the higher levels of debt could be as a disciplining device that mitigates agency costs
(Jensen, 1986). While the Palestinian result supports the trade-off theory Myers (1977) argues that companies with greater
future growth chances maintain lower debt levels to mitigate
the under-investment difficulties when future opportunities appear (Myers, 1977).
In order to test the differences in depth, we depend on the
methodology of Daskalakis and Psillaki (2007). We pool the data
for both groups of companies and determine a panel that limits
the coefficients of the determinants of capital structure to be the same. We compute the value of the F-statistic as follows:
F=[(RSSALL−RSSSAU−RSSPAL)/k]/[(RSSSAU+RSSPAL)/ (n−2k)]
Where,
RSSALL = Residual sum of squares for the restricted model that includes all firms.
RSSSAU = Residual sum of squares for the model that includes
Saudi firms only.
RSSPAL = Residual sum of squares for the model that includes Palestinian firms only.
n = Number of observations. k = Number of variables.
Table 7 shows that the computed F-statistic is equal to 40.115 and statistically significant, so there are differences in the structure
of the relationship between capital structure and its determinants
in the Saudi and Palestinian companies’ samples. To test this
difference and determine its roots whether from country-level difference or company-level differences, we re-apply the panel
Model (1) by monitoring the existence of fixed effects in the
capital structure relationship. Tables 8 and 9 show the result of the previous procedure and after controlling for the company-specific
effects, there is a difference in the level of the relationship between the effect of the independent variables and leverage.
Actually, it is clearly noticed from the computed F-statistics equal to 54.634 that the differences in the capital structure determinants
among Palestinian and Saudi firms are because of country-specific factors rather than company-specific factors. This finding would
not be unexpected assuming the difference in political and economic conditions between the two countries.
6. CONCLUSION
This paper discussed the determinants of capital structure for two different countries, Saudi Arabia and Palestine. This paper concluded that the leverage ratios of both Palestinian and Saudi
firms are low, beside that the most common determinants of capital
Table 5: Independent variables: Saudi and Palestinian companies
Variables Size ROA Tangibility Growthopp
Palestinian listed
firms
Mean 6.981 0.019 0.615 1.891
Median 6.881 0.020 0.600 1.570
Standard deviation 0.850 0.159 0.241 1.590
Saudi Arabian listed
firms
Mean 9.115 0.051 0.851 3.491
Median 9.210 0.049 0.845 3.400
Standard deviation 0.550 0.101 0.215 1.359
ROA: Return on assets
Table 6: Separate estimation results
Variables Palestinian firms Saudi firms
Constant 0.351* 0.295*
Size 0.495* 0.115*
ROA 0.550* 0.590*
Tangibility 0.190* 0.050
Growthopp 0.021* 0.069*
Adjusted R2 0.515 0.450
Durbin-Watson statistic 1.735 1.619
F-statistic prob. 20.985* 30.110*
structure are found significantly affecting both Palestinian and Saudi firms. Finally the differences in the magnitudes and sign of the coefficients are because of country-level differences and not due to firm-level differences.
REFERENCES
Abu, M. (2011), The determinants of capital structure of palestine-listed companies. The Journal of Risk Finance, 12(3), 226-241.
Alzomaia, T. (2014), Capital structure determinants of publicly listed
companies in Saudi Arabia. International Journal of Business and Finance Research, 8, 53-67.
Booth, L., Aivazian, V., Demirguc-Kunt, A., Maksimovic, V. (2001),
Capital structure in developing countries. Journal of Finance, 56,
87-130.
Brealey, R.A., Myers, S.C., Allen, F. (2008), Principles of Corporate Finance. 9th ed. New York: McGraw-Hill/Irwin.
Chittenden, F., Hutchinson, P., Hall, G. (1996), Small firm growth, access to capital market and financial structure: A review of issues
and empirical investigation. Small Business Economics, 8, 58-67.
Chen, J.J. (2004), Determinants of capital structer of Chinese-listed companies. Journal of Business Research, 43(2), 47-123.
Daskalakis, N., Psillaki, M. (2007), Do country or firm factors explain capital structure evidence from SMEs in France and Greece. Applied
Financial Economics, 2, 1-11.
Deesomsak, R., Paudyal, K., Pescetto, G. (2004), The determinants of capital structure: Evidence from the Asia pacific region. Journal of Multinational Financial Management, 14, 387-405.
de Jong, A. (2008), Capital structure around the world: The roles of firm - And country-specific determinants. Journal of Banking and Finance, 32, 1954-1969.
Fernandez, M., Kumar, R., Mansour, D. (2013), Determinants of capital
structre: Evidence from Oman. Arabian Journal of Business and
Management Review, 2, 34-44.
Frank, M., Goyal, VK. (2009), Capital structure decisions: Which factors are reliably important? Financial Management, 38(1), 1-37. Jensen, M.C. (1986), Agency costs of free cash flow, corporate finance
and Takeovers’, American Economic Review, Vol. 76, pp. 323-329. Kraus, A., Litzenberger R.H. (1973), A state-preference model of optimal
financial leverage. Journal of Finance, 28, 911-922.
Modigliani, F., Miller M.H. (1958), The cost of capital, corporation finance and the theory of investment: Reply’, American Economic Review, 49(4), pp. 655-669.
Myers, S.C. (1977), Determinants of corporate borrowing. Journal of
Finance, 5, 147-175.
Myers, S.C. (1984), The capital structure puzzle. Journal of Finance, 39, 575-592.
Myers, S.C. (2001), Capital structure. Journal of Economic Perspectives, 15, 81-102.
Myers, S.C., Majluf N.S. (1984), Corporate financing and investment decisions when firms have information that investors do not have,
Journal of Financial Economics, 13,187-221.
Nduati, S., Guandaru, C. (2014), Determinants of capital structure among private manufacturing firms in Kenya: A survey of food and beverage manufacturing firms. International Journal of Academic Research in Accounting, 4(3), 49-62.
Omet, G., Al-Sharari, T., Khalaf BA., Yaseen H. (2015), Determinants of capital structure in various circumstances: Could they be similar? Research Journal of Business and Management, 2, 158-168. Pratheepan, TH., Yatlwella, B. (2016), The determinants of capital
structure: Evidence from selected listed companies in Sri Lanka. International Journal of Economics and Finance, 8(2), 94-106. Rajan, R., Zingales, L. (1995), What do we know about capital structure?
Some evidence frome international data. Journal of Finance, 50, 1421-1460.
Shah, A., Hijazi, T. (2004), The determinants of capital structure of stock exchange-listed non-financial firms in Pakistan. Pakistan Development Review, 43, 605-618.
Table 7: Aggregate estimation results
Variables Coefficients
Constant 0.495*
Size 0.197*
ROA 0.450*
Tangibility 0.250*
Growthopp 0.020*
Adjusted R2 0.55
Durbin-Watson statistic 2.01
F-statistic prob. 40.115*
Method: Pooled EGLS (period SUR). Cross-section weights. ROA: Return on assets. * Denote statistical significance at 1%
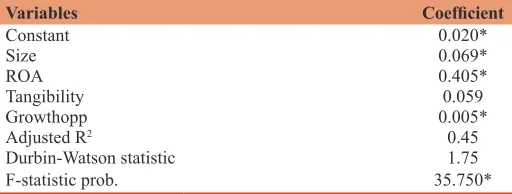
Table 9: Aggregate estimation results
Variables Coefficient
Constant 0.020*
Size 0.069*
ROA 0.405*
Tangibility 0.059
Growthopp 0.005*
Adjusted R2 0.45
Durbin-Watson statistic 1.75
F-statistic prob. 35.750*
Method: Pooled EGLS (period SUR) with fixed effects. Cross-section weights (PCSE) SE and covariance (d.f. corrected). ROA: Return on assets. *Denote statistical significance at 1%
Table 8: Separate estimation results: Saudi and Palestinian companies
Variables Palestinian results Saudi results
Constant 0.031* 0.015*
Size 0.041* 0.075*
ROA 0.350* 0.695*
Tangibility 0.101 0.035
Grrowthopp 0.101* 0.035*
Adjusted R2 0.390 0.350
Durbin-Watson statistic 1.985 1.750
F-statistic prob. 25.101* 35.108*
Method: Pooled EGLS (period SUR). Cross-section weights (PCSE) SE and


![6 (4 Chlorophenyl) 2 isobutylimidazo[2,1 b][1,3,4]thiadiazole](data:image/gif;base64,R0lGODlhAQABAIAAAP///wAAACH5BAEAAAAALAAAAAABAAEAAAICRAEAOw==)