Issues
ISSN: 2146-4138
available at http: www.econjournals.com
International Journal of Economics and Financial Issues, 2017, 7(2), 453-459.
Emerging Markets: Evaluating Graham’s Stock Selection
Criteria on Portfolio Return in Saudi Arabia Stock Market
Nadisah Zakaria
1*, Fariza Hashim
21Prince Sultan University, Riyadh, Kingdom of Saudi Arabia, 2Prince Sultan University, Riyadh, Kingdom of Saudi Arabia.
*Email: nzakaria@psu.edu.sa
ABSTRACT
Graham’s stock selection criteria enable investors to be more cautious in selecting their portfolios in order to generate abnormal return. Graham’s model was widely examined in various developed market where the stock markets and companies are more mature and economy of the countries are more stable. However, the selection criteria model was not commonly examined in emerging countries despite of their rapid economic growth and
diversified sectors in the stocks trading. Hence, this study attempts to investigate the relevance of Graham’s stock selection criteria on the portfolio
returns of the Saudi Arabia stock market. Saudi Arabia represents the fastest growing market in the Middle East primarily Arabian Gulf Cooperation
Council region thus testing the market is justified. The study found that despite of being young and immature stock market, Saudi stock market was
able to offer abnormal return to the investors and Graham’s model of stock selection is indeed valuable to investors. Keywords: Net Current Asset Value, Benjamin Graham, Value İnvesting
JEL Classification: G14
1. INTRODUCTION
Emerging markets have received greater attention over the last three decades as they provide immense investment opportunities
in both the financial and real sectors. Countries in the Arabian
Gulf Cooperation Council (AGCC) have become the latest
and fastest emerging markets in the Middle East. The decision by the AGCC to accomplish a common currency in 2010 has
accelerated the integration among the member countries. Within 5 years, the AGCC market capitalization had grown
to US$ 112 billion at the end of 2000. The combined stock
markets of the AGCC region are now larger than the Hong Kong stock exchange and nearly one third the size of the London
stock exchange (Rao, 2008), These governments are striving
to integrate into the emerging system of global governance and are keen to adapt their policies to the best international
practices (Hanelt and Matthias, 2002), Saudi Arabia’s market’s
capitalization is the largest in the AGCC emerging markets, the United Arab Emirates (UAE) market is the second largest, Qatar has the highest growth within the last 3 years, followed by the Oman, Kuwait and Bahrain markets.
Graham and Dodd (1934) highlighted several key principles in analyzing companies’ fundamentals and established a concept
of value investing and security analysis. The notion of value
investing refers to investing in stocks trading below their true
value or intrinsic value (Graham, 1976; 2003). The difference
between the stock’s intrinsic value and the market value (MV) is
called a margin of safety. The essence of value investing is that any
investment should be worth considerably more than an investor has
to pay for it. This means that investors look for shares with prices that are unjustifiably lower than their intrinsic value. Graham and
Dodd (1934) refer to the margin of safety as any shares that are
worth considerably more than they cost by at least 50% or more,
et al., 2003; Bird and Gerlach, 2003; Chan and Lakonishok, 2004; Hejazi and Oskouei, 2007; Kyriazis and Diacogiannis, 2007; Abhyankar et al., 2008; Ahmed, 1997; Arajärvi, 2009; Patari and Leivo, 1986; Larkin, 2011; and Athanassakos, G. 2008).
However, studies on stock selection criteria are quite limited. There
were studies on Graham’s stock selection criteria conducted by Oppenheimer and Schlarbaum (1981); Oppenheimer (1984); Vu (1988); Lauterbach and Vu (1993); Bildersee et al. (1993); Klerck
and Maritz (1997); Vanstone et al. (2004); Xiao and Arnold (2008); Quah (2008); Balik and Mehran (2008); Chee, Sloan and Uysal (2013) and Singh and Kaur (2014), Almost all the studies above, except Singh and Kaur (2014), were conducted in developed
countries or markets such as the US, the UK and other European capital markets, which are more mature and stable economically. Studies on emerging markets are limited, thus not much is understood about Graham’s stock selection criteria and how it affects the portfolio return primarily in the emerging countries, where the capital market is still young and immature. Based on this premise, this study aims to enhance the literature on value investing strategies by examining the relevance of Graham’s stock selection criteria on portfolio returns in Saudi Arabia.
Though Saudi Arabia is one of the fastest growing economies
in the Middle East, little is known about the market, which was perceived to be dominated by only the oil and gas sector. In spite of progressively diversifying its economy and moving towards the capital market, not much is known about the performance of the Saudi Arabia Stock Market. In examining the value of investment in Saudi Arabia and utilizing Graham’s criteria, the investigative questions are: First, do the stocks listed in emerging countries
fulfill Graham’s primary selection criteria even though they are
younger companies?; second, do the stocks listed in emerging
countries fulfill Graham’s secondary selection criteria despite being immature?; third, if they fulfill Graham’s criteria, would they
generate abnormal returns to the investors? In general, the study will shed light on whether Graham’s criteria contribute towards
increasing the value of investment in emerging markets. This study employs the time series data spanning from 2000 to 2011
on the stocks listed on the Saudi Arabia stock exchange known
as Tadawul.
This paper is organized in six sections; section two provides the
background to the Saudi Arabia stock market and its development. Section three discusses Graham’s stock selection criteria and literature relevant to the topic, section four describes the research
methodology and data analysis, section five presents the empirical findings and discussion, and finally section six concludes the
paper.
2. SAUDI ARABIA STOCK MARKET
On 19th March 2007, the Council of Ministers approved the
formation of the Saudi stock exchange (Tadawul), This was in accordance with Article 20 of the Capital Market Law establishing Tadawul as a joint stock company. Tadawul is the sole entity
authorized in Saudi Arabia to act as securities exchange and
the securities depository centre (Tadawul.com), Its main roles
are; listing and trading in securities, deposit, transfer, clearing, settlement, and registry of ownership of securities traded on
the exchange. The legal status, duties, and responsibilities of the Exchange and Depository Center are explicitly defined in the Capital Market Law of 2003. The Exchange is also the official source of all market information. Tadawul’s capital is Saudi Riyal 1.2 billion divided into 120,000,000 shares of equal value (Saudi Riyal 10), all of which are cash shares subscribed by the Public Investment Fund. Tadawul is an affiliate member of the
International Organization of Securities Commissions, the World Federation of the exchange of exchanges, and the Arab Federation
of Exchanges (Tadawul.com).
The government has strived to attract foreign investment to
the Kingdom in recent years. Saudi Arabia is ranked 49th in
the world out of 189 nations in the World Bank’s 2015 ease of
doing business report. Its favorable business environment and reputation for stability have made it the largest destination for foreign direct investment in the region. Saudi Arabia received a
total of $9.3 billion of foreign direct investment in 2013 (World Bank, 2013), In June 2015, Saudi Arabia’s stock exchange
experienced a major change when it started to open to foreign participation, an occasion that had been keenly projected in
the region. This was the final stage of market reform, which
evolved from a single-product market to an increasingly diverse investment platform. Combined with a push of regulatory changes
to the process, modifications to the organizational structure of the
exchange, and its relationship with the regulator, the future looks
more promising for Tadawul to extend its market participants. One
of the most striking features of the Saudi stock exchange is that
its listed companies reflect the range of economic activity taking
place in the country more comprehensively than its regional peers.
Equities are divided into 15 sectors: Banks and financial services;
petrochemical industries; cement; retail; energy and utilities;
agriculture and food industries; telecoms and IT; insurance;
multi-investment; industrial multi-investment; building and construction; real estate development; transport; media and publishing; and hotel
and tourism. Though the Saudi stock exchange is relatively novel
in its development, it is evolving from its initial function as a
single-product equities market to offer a wider array of financial
instruments.
Graham and Dodd (1934), who are known as the fathers of value investing, contended that shares that passed a set of criteria for selecting undervalued shares were worth investment as they would
produce above average market returns. Basu (1977) confirmed the
existence of “value effect” when he discovered that shares with low price-to-earnings ratio (P/E) produced, on average, a higher return than shares with a high P/E. Following this, various studies were conducted to validate that value shares low P/E ratio or low price-to-book ratio (P/B) tend to have higher average returns than growth shares (high P/E) and high P/B ratio in the US and global markets (Oppenheimer, 1986; Chan et al, 1991; Fama and French, 1992; 1993; 1998; Lakonishok et al., 1994; Chan and Lakonishok,
2004). These studies also agreed that value shares outperform
Athanassakos (2011) recently studied value of investment by
examining the value investors and their investments in shares with low P/E and low P/B ratios. Consistent with earlier studies, he also
confirmed that value investors do add value whereby selecting undervalued shares with a margin of safety generates significantly
positive abnormal returns relative to the naïve approach of simply selecting shares with low P/E and low P/B ratios.
Many empirical studies documenting the superiority of value strategy became apparent following the market declines of 1929
and the late 1960s and even became abundant after the periods of
notable global financial crisis. Oppenheimer (1986) clarifies that
Graham used the net current asset value (NCAV) over the MV extensively in the operations of the Graham–Newman Corporation, where shares were selected on the basis of the rule that they earned,
on average, about 20% per year over a 30-year period to 1956.
He tested the returns of the NCAV/MC portfolios with the returns
on the NYSE–AMEX value weighted index from 1971 through
1983 and found that NCAV securities had higher mean returns than the market benchmarks. Over the 13-year period, the Graham
NCAV/MC portfolios on average outperformed the NYSE–AMEX index by 1.46% per month (about 19% per year) after adjusting for risk. When he compared this with the small-firm index, these portfolios also generated a significantly positive abnormal return of 0.67% per month (8% per year), indicating that the NCAV/MV portfolios are, on average, about as risky as those of small firms.
Studies outside the US also indicate similar results: Investing in the NCAV/MC portfolios on average produces positive and
significant abnormal returns relative to the market benchmarks (Bildersee et al., 1993; Chan et al., 1991; Xiao and Arnold, 2008).
Various recent studies that confirm NCAV/MV produced
abnormal returns were also found. Xiao and Arnold (2008) found
evidence that buying stocks in companies with a per share NCAV greather than 1.5 times the current price listed on the London
stock exchange has produced returns (up to +19.7%) superior to those of the market. They also found that the profitability of the
NCAV/MV strategy in the UK could not be explained using the capital asset pricing model or the Fama and French three-factor
model, Chang (2012) examines Graham’s shares selection criteria in the Malaysian share market for the period 2000-2009 and found
that most of the screening criteria generated higher returns than the
market index, in the order of between 4.23% and 81.18% during the period of study. Sareewiwatthana (2011), who conducted a similar study on value investing in Thailand using Graham’s share selection criteria over the period of 5 years from 1996 to 2010,
concluded that the value portfolios outperformed the markets by
up to +65% over the test period.
3. METHODOLOGY
As of 31st December 2011, a total of 160 companies were listed
on Tadawul with a market capitalization of USD385.3 million.
Interestingly, the Saudi Arabian share market is the largest in
the region, accounting for about 50% of the six AGCC markets: Bahrain, Kuwait, Oman, Qatar, and UAE. Indeed, more than 80%
of all shares trading in terms of value take place in Saudi Arabia.
The examining period for this study is from January 2000 until
December 2014. This is due to the fact that prior to the year 2000,
company data is not yet available in the Saudi Arabia stock exchange. In calculating the NCAV of the companies listed, all data regarding the companies’ current assets, current liabilities, long-term debt, and preferred stock were downloaded from
balance sheet entries on Datastream (Xiao and Arnold, 2008). Companies that are listed as financial sectors are excluded from
this analysis. Returns for each company including dividends were adjusted for changes in stock split, rights issues and share
repurchases were obtained from Thompson Reuters Datastream, one of the major and authoritative financial information providers.
Selection was conducted by using the criterion that is based on the concept of maximizing the reward-to-risk ratio of the stocks selected (Oppenheimer, 1984), In order to qualify for inclusion in a portfolio, a stock would need to meet at least one reward criterion and one risk criterion. In conducting the selection of stocks from the Saudi Arabia stock exchange, NCAV/MV portfolios have
to be constructed. These processes involve two phases; the first
is to select the companies listed based on primary criteria, then the second stage is to select them based on secondary criteria as established by Graham. In complying with the primary criteria of Graham’s approach, companies with per share NCAV greather than
1.5 times the current asset share price were identified. Investors
should select NCAV/MV shares with a margin of safety: At a price no more than two thirds of the company’s NCAV.
Following Xiao and Arnold (2008), the study created an annual
portfolio share in the month of July. Companies are required
to have data for NCAV in December of t-1. This enabled the
researcher to observe at least one return in the post-formation period. Only shares with the NCAV/MV higher than 1.5 are
included in the portfolios. The buy-and-hold portfolios are constructed for 1, 2 and 3 years, with the first formation in July 2000 and the last formation in July 2011. Based on the selection
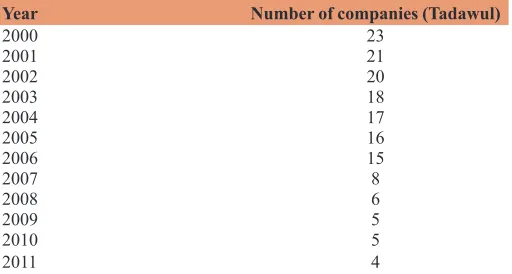
of primary criteria, we found certain numbers of companies that
fulfilled the NCAV criteria per each year as summarized in Table 1.
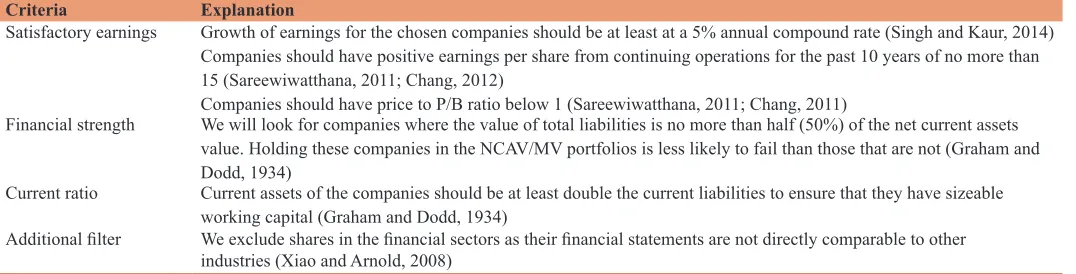
Those companies that fulfilled the primary criteria were further
investigated to ensure they satisfy the secondary criteria, which are summarized in Table 2. It is important for the companies to comply with the two levels of criteria to enable them to be further analyzed.
Table 1: Numbers of companies in the NCAV/MV portfolio in each year
Year Number of companies (Tadawul)
2000 23
2001 21
2002 20
2003 18
2004 17
2005 16
2006 15
2007 8
2008 6
2009 5
2010 5
2011 4
In analyzing the return, we focused on abnormal return, which is
defined in this context as the difference between the actual return
and the expected return of individual stocks in the portfolios. Despite Lyon et al. (1999. p. 198) reminding us regarding the use of buy-and-hold abnormal returns (BHAR), extensive literature supports the use of the BHAR method as it copes better with the effect of compounding than does cumulative abnormal return (CAR) (Ritter, 1991; Barber and Lyon, 1997), Fama (1998) also argued that compounding short-term returns to obtain long-term BHAR better captures long-term investor experience. In fact, using merely the average abnormal returns used in the CAR approach does not accurately measure returns to investors over the long-run period. In modern event studies, the most commonly accepted
methodology is the BHAR approach. Therefore, this research
adopts this method to evaluate the share return performance of NCAV portfolios over the long-run period. Ritter (1991) asserts that in minimizing the problem related to measuring portfolios,
benchmarking those portfolios is vital. Therefore, we employ
two market indices: Equal-weight index (EWI) and value weight index (VWI).
Notably, EWI gives the same weight or importance to each share listed on the Saudi Arabia stock exchange. Similarly, using this approach, the smallest companies are also given equal weight to that of the largest companies. VWI refers to each share listed on the Saudi Arabia stock exchange that are weighted according to the total MV of their outstanding shares. In other words, the weights of individual shares are proportionate to their market
capitalization. This enables us to examine the sensitivity of the results to the choice of the market (Xiao and Arnold, 2008), The 3-year holding period return is examined by computing the
compounded monthly buy-and-hold return (BHR) for NCAV companies, for time t as follows:
BHR =jT +rjt t=
T
1 1
1
( )
−
∏
(1)Where rjt is the monthly actual return on security of j in event period of t. T is designated as the number of months in event period t. This measures the total return from a buy-and-hold
strategy where a share is purchased at the closing market price and held until 12, 24 and 36 months following the NCAV/MV portfolios formation.
The BHR, BHRmT for the market benchmarks, represented by the
EWI and VWI for the Saudi Arabia stock exchange (Tadawul) are:
BHR =mT +rmt t= T 1 1 1
(
)
−∏
(2)rmt is the corresponding monthly index level of SAS-EWI and SAS-VWI in event period t. Note that SAS-EWI denotes the Saudi Arabia all shares equal weight index and SAS-VWI represents the
Saudi Arabia all shares value weight index. The market-adjusted
BHAR for each security or company in the NCAV portfolio in event period t are computed as:
BHR =jt +rjt BHR = +r
t= T
mT mt
t= T
1 1 1 1
1
( )
1− −
(
)
− ∏
∏
(3)Where BHARjt is the buy-and-hold abnormal return of security of
j in event period of t. This measures the market-adjusted BHAR
earned by investors over the 12, 24, 36 months following the
NCAV/MV portfolio formation. The test-statistic for the
market-adjusted monthly BHAR, BHAR(t ,t )1 2 during the clustering period from t1 to period t2 is calculated as:
t BHAR
(NHAR )/ T (t ,t )
t
1 2
=
σ (4)
Where BHAR(t ,t )1 2 is the market-adjusted monthly average
buy-and-hold abnormal return from period t1to period t2; and σ(BHARt) is the standard deviation of market-adjusted monthly buy-and-hold abnormal return in event period of t and T is the total number of companies in the NCAV portfolios in the sample.
4. EMPIRICAL RESULTS
After completing the two stages of examining the Saudi Arabia stock portfolios based on the Graham stock selection criteria, the study further analyzed those stocks to calculate the effects on the
BHAR. The results of the analysis are summarized in Table 3, which shows the monthly percentage of market-adjusted BHAR for the full sample of NCAV/MV portfolios for the Saudi Arabia stock
exchange (Tadawul) in the 3-year period against the equal-weighted
index (EWI) and value-weighted index market (VWI) benchmarks.
Table 2: Secondary criteria for sample selection
Criteria Explanation
Satisfactory earnings Growth of earnings for the chosen companies should be at least at a 5% annual compound rate (Singh and Kaur, 2014) Companies should have positive earnings per share from continuing operations for the past 10 years of no more than 15 (Sareewiwatthana, 2011; Chang, 2012)
Companies should have price to P/B ratio below 1 (Sareewiwatthana, 2011; Chang, 2011)
Financial strength We will look for companies where the value of total liabilities is no more than half (50%) of the net current assets
value. Holding these companies in the NCAV/MV portfolios is less likely to fail than those that are not (Graham and Dodd, 1934)
Current ratio Current assets of the companies should be at least double the current liabilities to ensure that they have sizeable working capital (Graham and Dodd, 1934)
Additional filter We exclude shares in the financial sectors as their financial statements are not directly comparable to other industries (Xiao and Arnold, 2008)
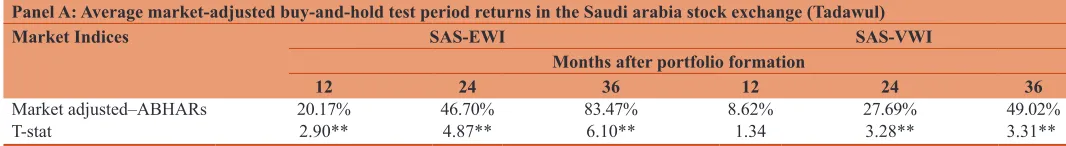
Panel A shows the results of average market-adjusted BHAR on
the Saudi Arabia stock exchange (Tadawul) in a period of 12, 24 and 36 months. The stock portfolios analyzed are those that comply with Graham’s primary and secondary stock selection criteria. The
results were analyzed separately based on the two indices; EWI and
VWI, The results of the t-test for the stock portfolios from the EWI index against BHAR was 2.9 (P = 0.01) and BHAR was 20.17% for the 1-year period; 4.87 (P = 0.01) and BHAR was 46.7% for the 2-year period; and 6.1 (P = 0.01) and BHAR was 83.47% for the 3-year period. These results indicate that the longer the investors
hold the portfolios, the higher the abnormal return. Nevertheless, the results of stock portfolios from VWI demonstrated a slightly
different scenario. The t-test result for the stock portfolios from the VWI against BHAR was 1.34 (not significant at P = 0.1) and BHAR was 8.62% for the 1-year period; 3.28 (P = 0.01) and BHAR was 27.69% for the 2-year period; and 3.31 (P = 0.01) and BHAR was 49.02% for the 3-year period. These results indicated that
investors gained abnormal returns only after a year of investment,
which signifies that the abnormal return was secured but requires
a longer period of holding the portfolios.
The findings above illustrate that the NCAV/MV portfolios that
were measured against the market benchmark of SAS-EWI
significantly performed exceeding the expectation on average by +83.47% in the 3-year holding period. Correspondingly, when
the NCAV/MV portfolios were measured against the market benchmark of SAS-VWI, they also demonstrated a positive and
significant market-adjusted BHAR of +49.02% over the 3-year
period, though the percentage of return was marginally lower.
This situation indicated that smaller companies outperformed
the larger companies on the Saudi Arabia Stock Market during the period of study.
5. CONCLUSİON
Benjamin Graham, the father of value investing, is associated with selecting stocks on the basis of valuation method of NCAV over the MV, He highlighted several most important principles in analyzing company’s fundamentals and established a concept of
value investing and security analysis. The notion of value investing
is attributed to investing in stocks trading below their true or
intrinsic value. The difference between the stock’s intrinsic value
and the MV is called a margin of safety. Studies on Graham’s stock selection criteria remain largely inadequate in emerging markets. Despite the fact that studies were conducted on this issue, most of them were conducted in advanced markets such as those of
the US, the UK, and other European capital markets, which are more mature and economically established. Consequently, an understanding of the stock market reaction from emerging markets on Graham’s stock selection criteria remains unknown, since this market is younger and less mature compared to the advanced market. AGCC was selected as a control variable due to the fact that its market capitalization has swiftly grown and is the largest
in the AGCC region. Hence, this study sought to fill this gap. This study attempted to provide insights into value of investment
of stock portfolios listed in Saudi Arabia using Graham’s selection criteria. It examined the stocks’ compliance towards Graham’s primary and secondary selection criteria as well as analyzing the potential of BHAR. In increasing the accuracy of measuring the portfolios, two indices were applied, namely the EWI and the VWI.
This study employed the time series data across a 10-year period from 2000 to 2011. The study found that out of 160 companies
selected from the Saudi Arabia stock exchange, 23 companies
fulfilled the primary criteria in 2000, though this number steadily decreased to 4 companies in 2011. These companies were further
selected for the secondary criteria before analysis on BHAR was
calculated. The findings of the study showed that there was a consistently significant positive market-adjusted BHR over the
3 years for the market benchmarked by the EWI. Investors could gain their abnormal return even in their 1st year of investment up to
20% and aggregated up to 83% over the 33-year period. However,
when the portfolios were benchmarked by VWI, the BHAR was not achieved in the 1st year of investment. The abnormal return
was only earned in the 2nd- and 3rd-year period of investment. This
indicates that smaller companies managed to perform better than
larger companies in this younger stock market. The finding of this study is consistent with the previous studies, thus confirming that
utilizing Graham’s stock selection criteria remains valuable in serving investors to enhance their value of investment in emerging countries even though the companies are younger and operating in a market that is rapidly developing and less mature.
The study recommends the investors to screen the stocks traded on the Saudi Arabia stock exchange (Tadawul) using the Benjamin
Graham’s selection criteria in order to generate abnormal returns over the long-run period of investment. Notably, this method
provides benefits fund to both fund managers and hedge fund
managers. Fund managers can consider Benjamin Graham’s selection criteria to create equity based mutual fund portfolios; while hedge fund managers can also use this approach as one of the tools for risk management.
Table 3: Average market-adjusted buy-and-hold returns for NCAV/MV portfolios
Panel A: Average market-adjusted buy-and-hold test period returns in the Saudi arabia stock exchange (Tadawul)
Market Indices SAS-EWI SAS-VWI
Months after portfolio formation
12 24 36 12 24 36
Market adjusted–ABHARs 20.17% 46.70% 83.47% 8.62% 27.69% 49.02%
T-stat 2.90** 4.87** 6.10** 1.34 3.28** 3.31**
Shares are allocated to NCAV portfolios if their NCAV/MV ratios are higher than 1.5 at the beginning of July 2000 and all subsequent to July 2011. Market-adjusted buy-and-hold
abnormal returns for shares within a portfolio are calculated for periods of 1, 2 and 3 years post-formation. Panel A indicates the market-adjusted ABHARs for all the Saudi Arabian
companies against the SAS-EWI and SAS-VWI benchmarks. ABHAR: Average buy-and-hold abnormal returns, SAS-EWI: The Kingdom of Saudi Arabia all shares-equal weight index. SAS-VWI: The Saudi Arabia all shares-value weight index, NCAV: Net current asset value, MV: Market value. Asterisks indicate statistical significance at the 1% (**), respectively using
This study is limited to Saudi Arabia stock market, giving its
market capitalization is the largest in the AGCC emerging markets. A similar study can be conducted in other AGCC markets such as UAE, Qatar, Oman, Kuwait and Bahrain to provide a comprehensive understanding about notion of Benjamin Graham’s stock selection and its applications.
REFERENCES
Abhyankar, A., Ho, K.Y., Zhao, H. (2008), Value versus growth: Stochastic dominance criteria. Quantitative Finance, 8(7), 693-704. Ahmed, I. (1997), Value Investing on The Bombay (Mumbai) Stock
Exchange. Post Sell-Off 1997.
Arajärvi, T. (2009). Beta Enhanced Value Strategies: Evidence from The German Equity Market (Unpublished Thesis) Lappeenranta University of Technology, German.
Arshanapalli, B.G., Coggin, T.D., Doukas, J. (1998), Multifactor asset pricing analysis of ınternational value ınvestment strategies. The Journal of Portfolio Management, 24(4), 10-23.
Athanassakos, G. (2008), Seasonal patterns in Canadian financial markets and the ımpact of professional portfolio rebalancing: Evidence of profitable opportunities. Journal of Financial and Economic
Practice,9(1), 73-96.
Athanassakos, G. (2011), Do value investors add value? The Journal of Investing, 20(2), 86-100.
Athanassakos, G. (2012), Value investing vs. Modern portfolio theory. Journal of Business and Finance Affair, 1, 110-115.
Balik, R., Mehran, J. (2008), Benjamin Graham Revisited. Available from: http://www. academy financial. org/09Conference/09Proceedings/ (5D)% 20Balik,% 20Mehran. Pdf. [Last accessed on 2010 Feb 25]. Banz, R.W. (1981), The relationship between return and market value of
common stocks. Journal of Financial Economics, 9(1), 3-18. Barber, B.M., Lyon, J.D. (1997), Detecting long-run abnormal stock
returns: The empirical power and specification of test statistics.
Journal of Financial Economics, 43(3), 341-372.
Basu, S. (1977), Investment performance of common stocks in relation to
their price-earnings ratios: A test of the efficient market hypothesis. The Journal of Finance, 32(3), 663-682.
Bildersee, J.S., Cheh, J.J., Zutshi, A. (1993), The performance of Japanese
common stocks in relation to their net current asset values. Japan and the World Economy, 5(3), 197-215.
Bird, R.G., Gerlach, R.H. (2003), The Good and the Bad of Value
Investing: Applying a Bayesian Approach to Develop Enhancement Models. European Financial Management Association Annual Meeting. Helsinki: European Financial Management Association.
Bloomberg, L.P (2015), Net Current Asset Value and Market Value. From
Bloomberg database. Available from: http:// https://www.bloomberg.
com/professional. [Last Retrieved on 2015 Jan 03].
Capaul, C., Rowley, I., Sharpe, W.F. (1993), International value and growth stock returns. Financial Analysts Journal, 49, 27-36. Chan, L.K., Hamao, Y., Lakonishok, J. (1991), Fundamentals and stock
returns in Japan. The Journal of Finance, 46(5), 1739-1764. Chan, L.K., Lakonishok, J. (2004), Value and growth ınvesting: Review
and update. Financial Analysts Journal, 60, 71-86.
Chang, D. (2012), Testing some of Benjamin Graham’s stock selection criteria: A case of the FTSE bursa Malaysia EMAS ındex from year 2000 to 2009. Jurnal Manajemen Dan Kewirausahaan Journal of Management and Entrepreneurship, 13(2), 99-106.
Chee, S., Sloan, R., Uysal, A. (2013), A framework for value ınvesting.
Australian Journal of Management, 38(3), 599-633.
Dimson, E., Nagel, S., Quigley, G. (2003), Capturing the value premium
in the United Kingdom. Financial Analysts Journal, 59, 35-45.
Fama, E.F. (1998), Market efficiency, long-term returns, and behavioral finance. Journal of Financial Economics, 49(3), 283-306.
Fama, E.F., French, K.R. (1992), The cross-section of expected stock returns. The Journal of Finance, 47(2), 427-465.
Fama, E.F., French, K.R. (1993), Common risk factors in the returns on stocks and bonds. Journal of Financial Economics, 33(1), 3-56.
Fama, E.F., French, K.R. (1998), Value versus growth: The international evidence. The Journal of Finance, 53(6), 1975-1999.
Graham, B. (1976), A conversation with Benjamin Graham. Financial
Analysts Journal, 32, 20-23.
Graham, B. (2003), The Intelligent Investor. Revised edition. New York:
Harper Collins.
Graham, B., Dodd, D.L. (1934), Security Analysis: Principles and
Technique. New York: McGraw-Hill.
Hanelt, C.P., Matthias, P. (2002), The EU and the GCC - A New
Partnership, Gulf Strategy Paper Presented by the Bertelsmann Foundation. Gutersloh in Cooperation with European University Institute, Florence. March.
Hejazi, R., Oskouei, M.M. (2007), The ınformation content of cash value
added (CVA) and P/E ratio: Evidence on association with stock
returns for ındustrial companies in the Tehran stock exchange. Iranian
Accounting and Auditing Review, 14(47), 21-36.
Klerck, W.G., Maritz, A.C. (1997), A test of Graham’s stock selection
criteria on ındustrial shares traded on the JSE. Investment Analysts
Journal, 26(45), 25-33.
Kyriazis, D., Diacogiannis, G. (2007), Testing the performance of
value strategies in the Athens stock exchange. Applied Financial Economics, 17(18), 1511-1528.
Lakonishok, J., Shleifer, A., Vishny, R.W. (1994), Contrarian
investment, extrapolation, and risk. The Journal of Finance, 49(5),
1541-1578.
Larkin, P.J. (2011), Can ındividual ınvestors capture the value premium?
Journal of Business and Economics Research JBER, 7(5), 25-34. Lauterbach, B., Vu, J.D. (1993), Ben Graham’s net current asset value rule
revisited: The size-adjusted returns. Quarterly Journal of Business and Economics, 32, 82-108.
Lyon, J.D., Barber, B.M., Tsai, C.L. (1999), Improved methods for tests of long-run abnormal stock returns. The Journal of Finance, 54(1), 165-201.
Oppenheimer, H.R. (1984), A test of Ben Graham's stock selection criteria.
Financial Analysts Journal, 40(5), 68-74.
Oppenheimer, H.R. (1986), Ben Graham’s net current asset values:
A performance update. Financial Analysts Journal, 42, 40-47.
Oppenheimer, H.R., Schlarbaum, G.G. (1981), Investing with Ben
Graham: An ex ante test of the efficient markets hypothesis. Journal of Financial and Quantitative Analysis, 16(3), 341-360.
Pätäri, E.J., Leivo, T.H. (2009), Performance of the value strategies in the
Finnish stock markets. Journal of Money, Investment and Banking, 2(8), 5-24.
Quah, T.S. (2008), DJIA stock selection assisted by neural network. Expert Systems with Applications, 35(1), 50-58.
Rao, A. (2008), Analysis of volatility persistence in middle east emerging
equity markets. Studies in Economics and Finance, 25(2), 93-111.
Ritter, J.R. (1991), The long-run performance of ınitial public offerings. The Journal of Finance, 46(1), 3-27.
Sareewiwatthana, P. (2011), Value ınvesting in Thailand: The test of
basic screening rules. International Review of Business Research Papers, 7(4), 1-13.
Singh, J., Kaur, K. (2014), Testing Ben Graham’s stock selection criteria in
Indian stock market. Management and Labour Studies, 39(1), 43-62.
Vanstone, B.J., Finnie, G., Tan, C. (2004), Applying Fundamental Analysis
and Neural Networks in the Australian Stock Market.
World Bank. (2013), Saudi Arabia’s Strong Foundation Support
Continued Growth. Oxford Business Group. Available from:
https://www.oxfordbusinessgroup.com/overview/moving-forward-2016 Nov 20].