JIEM, 2016 – 9(1): 59-72 – Online ISSN: 2013-0953 – Print ISSN: 2013-8423 http://dx.doi.org/10.3926/jiem.1555
Simulation and Optimization of Logistics Distribution for an
Engine Production Line
Lijun Song, Shanying Jin, Pengfei Tang
Chongqing University of Technology (China)
[email protected], [email protected], [email protected]
Received: May 2015
Accepted: January 2016
Abstract:
Purpose:
In order to analyze and study the factors about Logistics distribution system, solve
the problems existing in the distribution system and improve the efficiency of the assembly
line.
Design/methodology/approach:
Using the method of industrial engineering, put forward
the optimization scheme of distribution system. the simulation model of logistics distribution
system for engine assembly line was build based on Witness software.
Findings:
The optimization plan is efficient to improve Logistics distribution efficiency,
production of assembly line efficiency and reduce the storage of production line
Originality/value:
Based on the study of the modeling and simulation of engine production
logistics distribution system, the result reflects some influence factors about production
logistics system, which has reference value to improving the efficiency of the production line.
1. Introduction
Logistics cost accounted for the most part of the total cost in the enterprise production, especially in the manufacturing industry in China. It amounts to more than 15% of the total production cost, while this percentage is around 8% to 5% in Europe, the United States, and Japan (Wang & Zhang, 2013), (Min & Songtao, 2013), (Wei, Kelin & Yu, 2011). Reducing logistics cost has become a key link for China's manufacturing industry to adapt to international competition. Production logistics belongs to the enterprise’s internal logistics, which refers to the range of parts inventory to the production line. Because of the variety of the products, a wide number of components, as well as the enterprises implement the lean production mode, these conditions make the production logistics system very complex. Its rationality is not only related to the normality of enterprise production, but also controls the enterprise production’s efficiency and production cost.
At present, the researches on optimization of production logistics system have achieved some achievements. Gokseven (2009) introduced a hybrid optimization-simulation model. In order to minimize the overall transportation costs, the optimization model searches for a solution to balance the cost ratio between these segments. Xianhao and Shihua (2000) puts forward a new leveling of MC mode planning model of the optimal algorithm, optimizing production logistics scheduling. Quanke and Jianying (2004) proposes the batch production scheduling optimization of process route method, by trying to scheduling algorithm to arrange the machining operations and logistics distribution. Qiang, Ling, Yu and Yongzhi (2012) proposes a new method to optimize and stimulate the multiple varieties of batch type production logistics system based on the complexity of the multiple varieties batch production system, considering the factors of people, machine, method. Zaigen, Ziyang, Min and Sen (2012) studies the molten iron and steel enterprise logistics balancing and scheduling, and establishes the minimum total transportation time to satisfy the supply/demand constraints in the mathematical optimization model. Combined with artificial algorithm with man-machine technology, it proposed optimization strategy. Hua (2014) put forward a mixed algorithm of shortest path in logistics and distribution based on Dijkstra and Floyd characteristics. Yan Huan etc. (2014) put forward a set of application software to simulate distribution of the optimal path is designed based on Genetic Algorithms. Those gentleman focused on the optimization of the method, mainly through the programmes or models to Support Their study.
system simulation modeling and simulation of the operation. Yin, Cunguang, Jinpeng and Liming (2009) takes a typical component in the production line as an example, converting the Petri net model into markov chain (Mc), puts forward a new method of Petri net simulation, and the Flexsim software simulation analysis was carried out on the Petri net model. Feng, Zhekun and Haihong (2010) sets up production line and cost control model based on Flexsim software, which models and simulates the production logistics system as well as optimizes and analyses production logistics. In order to improve the efficiency and benefit for logistics distribution system, Zhou and Cao (2014) developed a path optimization method based on mixed multi-intelligence algorithms for vehicle routing problem. Xiong and Zhang (2014) used a retail business distribution network for the study, to study its distribution optimization models and methods, using a variety of algorithms for analysis, to understand its distribution network efficient mode of operation. Furong and Hongjun (2014) take the use of simulation software Witness to optimize simulation analysis and to determine the tact, thereby improving the efficiency of their production logistics and production systems. Juan and Zhi (2014) discuss production process optimization in complex manufacturing shop and research the optimization method about uncertain factors. Koulouriotis, Xanthopoulos and Tourassis (2009) hold that Optimization problems that occur at the design and organization of logistic processes was usually multivariable and complex problems with stochastic parameters. And they used methods in the optimization of logistic systems and processes. After a short description of the methods, they discussed the increasing importance of simulation. And the possible cooperation of simulation and modern optimization methods demonstrated through two practical application.
2. Analysis of Engine Production Logistics System
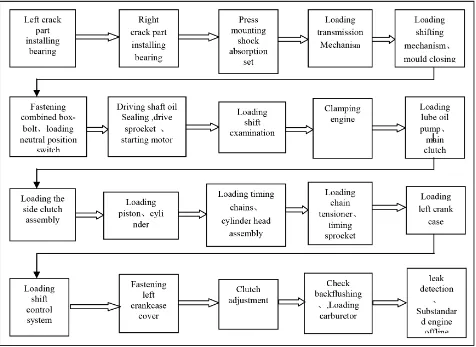
A motorcycle engine production line daily output is 3200 sets/day, there are eight workstation and 20 assembly station, involving the cylinder block, frame, cushion and more than 180 parts and assembly department. The assembly process of total assembly line is shown in Figure 1.
Figure 1. The total assembly line flow chart of engine
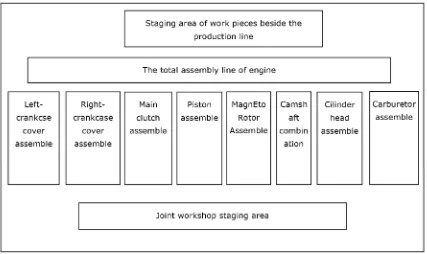
Production material is sent to the warehouse staging area of joint factory; components is sent to the line the staging area by the forklift truck from joint workshop staging area, and then sent to the corresponding location in the assembly line after assembling directly. Straight fittings are sent to assembly line and staging area directly by the forklift in joint workshop. The engine assembly line layout diagram is shown in Figure 2.
and the fittings capacity is multiplied. The number of each fitting deposited materials can be known. From joint workshop staging area to the loading and assembly takes motor forklift truck transportation for each station, and forklift truck transport capacity is determined.
Figure 2. The layout sketch of engine assembly line
Simulation target is mainly to optimize the original distribution scheme, improve the efficiency of assembly, save the number of transport fittings and forklift, and balance production each working procedure in assembly line.
3. The Design for Simulation Model of Production Logistics System
3.1. The Definition of Simulation Performance Parameters
beyond certain load distribution car utilization, it can increase risk of distribution system. Therefore, the utilization of distribution car should be in a reasonable range.
3.2. The Design of the Simulation Model
3.2.1. Simplification and Hypothesis of the Model
In the design of simulation model some parameters should be set up some assumptions. On one hand, the difficulty of simulation modeling can be reduced; On the other hand the irrelevant factors of interference can be eliminated. In this paper, the assumptions of engine production logistics system simulation model are as follows:
1. The material in joint workshop staging area is ample, and fittings are also sufficient.
2. Regardless of the loading machine and assembly of the machine failure rate, and the waste, and human resources can meet the requirements of production.
3. Regardless of the failure of delivering vehicles.
3.2.2. Related Static Input Design of the Model
3.2.2.1. Basic Data of the Production Line
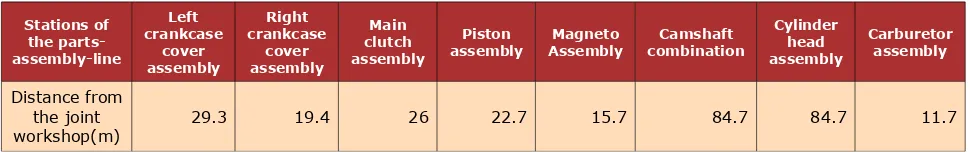
Production logistics uses the panel management, and the logistics eventually pulled by assembly line production. The rhythm of assembly and the department line production are 16 s/set, working two shifts a day, 8 hours per shift, shift production is 1600 sets. The distances from joint workshop to each station registers are as shown in Table 1. The distance from joint workshop to the staging area is 133 m. Carrying forklifts’ speed is 1.38 m/s. Fittings of various materials and the capacity are known; the load capacity of the car is determined.
Stations of the parts-assembly-line Left crankcase cover assembly Right crankcase cover assembly Main clutch assembly Piston
assembly AssemblyMagneto combinationCamshaft
Cylinder head assembly Carburetor assembly Distance from the joint
workshop(m) 29.3 19.4 26 22.7 15.7 84.7 84.7 11.7
3.2.2.2. The Design of Main Entity Element in Simulation Model
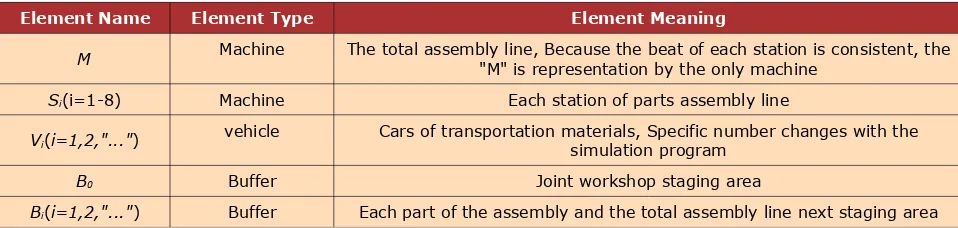
According to the production process, the main physical elements of the simulation model are shown in Table 2.
Element Name Element Type Element Meaning
M Machine The total assembly line, Because the beat of each station is consistent, the"M" is representation by the only machine
Si(i=1-8) Machine Each station of parts assembly line
Vi(i=1,2,"...") vehicle Cars of transportation materials, Specific number changes with thesimulation program
B0 Buffer Joint workshop staging area
Bi(i=1,2,"...") Buffer Each part of the assembly and the total assembly line next staging area
Table 2. The definition of the main entity elements in the simulation model
In statistical parameters of the car, Idle denotes the ratio of distribution vehicle; Transfer denotes the ratio returning time of delivery vehicle distribution; Loaded denotes the time proportion of vehicle for distribution from the staging area to production line; Blocked denotes time proportion for delivery vehicles in the staging area waiting for loading; Distance denotes the total distance of delivery vehicle; Loads is the times of distribution. In parameter statistics of assembly line, idle denote idle rate of the assembly line; Busy is the working rate for assembly line; No. of the Operations is the production of total assembly line.
3.3. The Design of Logistics Distribution Rules
3.3.1. The Initial Stock of Material in Production Line
The staging areas in assembly line and the department line can meet 200 sets/batch spare parts inventory. In order to guarantee the normal production of the work shift, we set up the initial stock of spare parts in the production line, initial setting are: fitting capacity of the parts is less than 200 sets, the initial value of line edge is 200 sets; Fitting capacity is more than 200 sets, the line edge’s initial value is the number of the parts in one case.
3.3.2. Replenishment Way
components; Replenishment quantity and the production line is not more than 200 sets of line edge; Fitting capacity is more than 200 sets of parts. The parts are replenished according to the number of parts in a case.
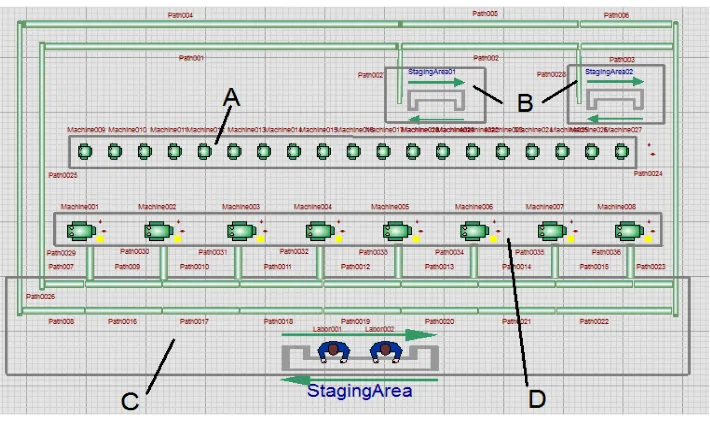
According to the design of simulation model, the visual interface of simulation based on witness is as shown in Figure 3:
Figure 3. Simulation model interface of engine production line
In the figure: A is 20 assembly line location, B is the staging area of straight fittings production line, C denotes the diving track of distribution vehicle, D are eight loading stations.
4. Simulation and Optimization of Production Logistics
4.1. Run Simulation Model
According to the results of the above design, we run the simulation model. The test run length is set to two work shift, the main results are as shown in Tables 3-4:
Vehicles Idle(%) Transfer(%) Loaded(%) Blocked(%) Loads(times) Distance(%)
V1 9.63 77.49 12.88 21.3 260 18400
V2 9.48 78.15 12.37 22.97 233 16348
V3 9.13 74.37 16.5 8.5 210 16836
V4 8.92 75.62 15.46 12.38 158 15688
Parameters Idle(%) Busy(%) No. Of. Operations
The total assembly line 29.49 70.51 2523
Table 4. Operation status of the total assembly line of engine
Through analysis of Table 3 and Table 4, logistics distribution system has shortcomings: one is the distribution car V1 ~ V4, free rate were respectively 9.63%, 9.48%, 9.13%, and 8.92%.
Delivering vehicles are relative busy, if you consider the failure rate of delivering vehicles, they will far from the production logistics requirements; the other is what can be seen from Table 4, the assembly line of free rate was 29.49%, and the two work shift production is 2523 units. But the daily output should be 3200 sets. The reason of insufficient production is low utilization rate of the reason for the assembly line.
4.2. Optimization of Logistics Distribution System
By analysis, the causes of deficiency of daily output are due to the lack of the assembly line, as a result of using the low production line material. The reasons that lack material are that the car is too busy, that is the existing configuration of the car can't meet the demand of normal production, so we need to increase distribution vehicles, decrease the working rate, increase the distribution car transportation safety coefficient, and improve the logistics quantity when considering the optimization of logistics distribution system.
Optimization step 1: increase the car to 5 units, the original distribution rules do not change. The simulation results are shown in Tables 5-6:
Vehicles Idle(%) Transfer(%) Loaded(%) Blocked(%) Loads(times) Distance(%)
V1 13.63 71.4 14.97 28.89 214 16084
V2 14.48 73.06 12.46 25.99 211 17729
V3 14.13 72.47 13.4 17.94 155 19198
V4 13.92 70.28 15.8 19.71 130 15108
V5 15.82 71.95 12.23 20.67 135 18496
Table 5. The simulation results after increasing vehicles
Parameters Idle(%) Busy(%) No. Of. Operations
The total assembly line 20.51 79.49 2845
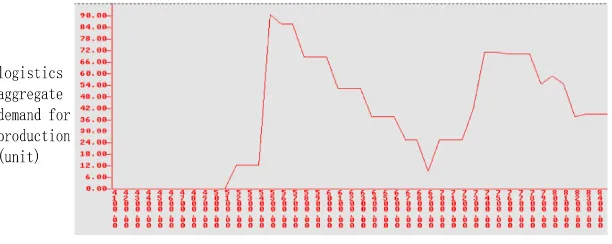
From Table 5, it shows that after increasing one car, the car’s free rate is between 13.6% and 15.9%. If utilization rate of the vehicle is reasonable, it can prevent affecting car distribution rate after the failure, so the scheme of five distribution cars is reasonable. But from Table 6, the engine assembly line’s idle rate remains as high as 20.51%, and production of 2845 sets also does not meet the requirements of task. The reason of the problem is that logistics distribution does not meet the demand of production line. Stockout rate of production line is still high. Further analysis of logistics demand situation through the model simulation, the total logistics demand of assembly and department production are shown in Figure 4:
Figure 4. The total logistics demand
From the above figure, the demand of the logistics gets a peak suddenly at the beginning period according to the current logistics distribution rules, and then logistics demand is not very balanced, the fluctuation range is relative large. In this case, the logistics peak period may make delivering vehicles fail to meet the instant requirements. However, in the period of low logistics demand, the distribution car is idle. Its reason is that the logistics distribution rule is unreasonable and line edge material initial stock is not reasonable. So we need to optimize the logistics distribution rules.
Step 2: optimize and design initial stock of material in production line that is to adjust initial quantity of components to make consistent consumption frequency components stagger replenishment peak, achieving smooth replenishment of components. Initial stock material optimization scheme is as shown in Table 7, and the replenishment mode is still the original mode.
The capacity number of materials in the harness T Initial stock next to the production line
T>100 1 Box
T≤ 100 the box number of initial stock to meet the constraints:(the box number of initial stock *T)≤ 200
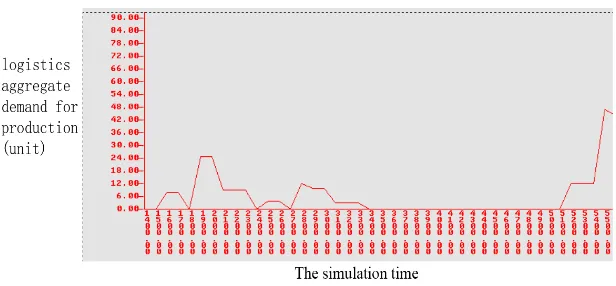
According to the optimization of step 2, the total demand of the production line’s simulation results are shown in Figure 5, and delivering vehicles and total assembly line’s results are shown in Table 8 and Table 9.
Figure 5. The total logistics demand after the optimization of step two
Vehicles Idle(%) Transfer(%) Loaded(%) Blocked(%) Loads(times) Distance(%)
V1 10.83 71.2 17.97 18.23 230 17178
V2 11.42 72.12 16.46 15.75 255 19843
V3 11.27 71.02 17.71 13.14 139 17534
V4 12.02 69.66 18.32 14.12 133 19680
V5 12.26 71.55 16.19 14.67 131 17012
Table 8. The simulation results after the optimization of step two
Parameters Idle(%) Busy(%) No. Of. Operations
The total assembly line 7.91 92.09 3315
Table 9. The engine assembly line operation after the optimization of step two
5. Conclusions
Production logistics system is a complex large system; there are a variety of factors that influence efficiency of the logistics, including man, machine, method, material, and other factors. For complex large scale system, the traditional mathematical methods cannot solve this problem effectively. The system simulation is the effective means to solve the problem of complex system optimization. In this paper, through the study of the modeling and simulation of engine production logistics distribution system, it puts forward the optimization scheme of distribution system, solving the problems existing in the distribution system; improving the efficiency of the assembly line. Production logistics distribution system, however, is affected by many factors, such as material loading rules, vehicle scheduling, etc., this paper analyzes and studies the distribution rules of logistics. It still need further in-depth study on how to consider and refine each influence factors, as well as the relationship between these factors.
Acknowledgments
This work is funded by The Fundamental and Advanced Research Projects of Chongqing city in China (CSTC2013jcyjA0564).
References
Dymowa, L., & Sevastjanov, P. (1970). Fuzzy Simulation and Optimization of Production and Logistic Systems. Studies in Fuzziness and Soft Computing, 252, 249-277.
http://dx.doi.org/10.1007/978-3-642-12052-7_11
Feng, W., Zhekun, L., & Haihong, Y. (2010). The production line management and cost control model based on Flexsim.Hoisting and Conveying Machinery,14(7), 87-89
Furong, C., & Hongjun, W. (2014). Simulation and optimization of production rhythm of camshaft production line based on witness. Manufacturing Automation, 36(17).
Gokseven, A.O. (2009). An optimization-simulation approach for locating warehouses in logistics networks. Dissertations & Theses - Gradworks.
Hua, W. (2014). A mixed algorithm of shortest path in logistics and distribution. Science of
Surveying and Mapping, 39(9).
Koulouriotis, D.E., Xanthopoulos, A.S., & Tourassis, V.D. (2009). Simulation optimisation of pull control policies for serial manufacturing lines and assembly manufacturing systems using genetic algorithms. International Journal of Production Research, 48(10), 2887-2912.
http://dx.doi.org/10.1080/00207540802603759
La-mei, H., Zhong, Z., Xiao-qiang, G., Ke-wen, Z., Da-de, Z., & Xiao-ping, C. (2004). Simulation for Logistics in Steel-making Process of Panzhihua Iron and Steel Corporation.
Journal of Chongqing University, 27(5), 57-61.
Min, Z., Songtao, Z. (2013). Study of dairy logistics distribution system based on hybrid genetic algorithm. Journal of Applied Sciences, 13(17), 3533-3537.
http://dx.doi.org/10.3923/jas.2013.3533.3537
Qiang, Z., Ling, S., Yu, Y., & Yongzhi, W. (2012). Simulation optimization for multi-type and batch production system based on Witness. Computer Engineering and Applications, 48(21), 209-216.
Quanke, P., & Jianying, Z. (2004). Optimization method for a job - shop scheduling problem with alternative machines in the batch process. Journal of Mechanical Engineering, 40(4), 36-39. http://dx.doi.org/10.3901/JME.2004.04.036
Wang, S., Zhang, K. (2013). Logistics distribution network design with two commodity categories. Journal of the Operational Research Society, 64(9), 1400-1408.
http://dx.doi.org/10.1057/jors.2012.107
Wei, Z., Kelin, X., Yu, S. (2011). Logistics distribution route planning with fusion algorithm of Petri net and ant colony. Journal of Zhejiang University (Engineering Science), 45(12), 2229-2234.
Xianhao, X., & Shihua, M. (2000). The Optical Algorithm of the Model of Production Smoothness Based on Mass Customization. Journal of Hua zhong University of Science and
Technology, 28(11), 73-77.
Xiong, W., & Zhang, L. (2014). The Optimization of Logistics and distribution. Advanced Materials Research, 989-994, 1532-1535. http://dx.doi.org/10.4028/www.scientific.net/AMR.989-994.1532
Yin, Y., Chunguang, L., Jinpeng, C., & Liming, L. (2009). Modeling and simulation study of the production system based on Flexsim. Modern Manufacturing Engineering, 12, 127-134.
Zaigen, C., Ziyang, L., Min, L., & Sen, W. (2012). Research on dynamic balance and real-time scheduling of HM logistics in large steel enterprise. Computer Applications and Software,
Zhou, R., & Cao, J. (2014). Path Optimization Method of Logistics Distribution Based on Mixed Multi-Intelligence Algorithms. Ecosystem Assessment and Fuzzy Systems Management, 254, 265-274. http://dx.doi.org/10.1007/978-3-319-03449-2_25
Journal of Industrial Engineering and Management, 2016 (www.jiem.org)
Article's contents are provided on an Attribution-Non Commercial 3.0 Creative commons license. Readers are allowed to copy, distribute and communicate article's contents, provided the author's and Journal of Industrial Engineering and Management's names are included.