The Effects of a Competency-Based Reform
Curriculum on Students’ Problem-Solving
Competency and General Attitudes and
Interest Towards Science and Technology
Patrice Potvin, Jean-Guillaume Dumont, François Boucher-Genesse, and Martin Riopel
Corresponding author: [email protected]
Département de didactique, Faculté des sciences de l’Éducation, Université du Québec à Montréal, Québec, Canada
Keywords: science and technology education, educational change, problem-solving competency, attitude, computer simulation, assessment
Abstract
Many recent educational reforms around the world, including reforms in science and technology programs, are competency-based. However, very few research initiatives have tried to assess the effects of such programs on learning, attitudes and interest. This article describes a research study that compared the performances and perceptions of students in science before and after the implementation of Quebec’s competency-based reform. A total of 468 Grade 11 students from 4 schools formed the before group and 382 Grade 11 students from the same schools formed the after group. The before group had spent all their school years experiencing the earlier curriculum while the after group experienced only the reform curriculum. The introduction of the reform curriculum was such that the before group were sampled in 2009 and the after group in 2011. A simulation game was designed and used to evaluate students’ problem-solving competency in science and technology, and a questionnaire was used to study attitudes and interest variables. Results show significant but modest improvement of the problem-solving competency as well as improvements in some aspects of attitudes and interest toward science and technology.
International Journal of Innovation in Science and Mathematics Education, 20(4), 54-69, 2012.
Context
Since no “stable or fixed” definition of “competency” has yet been proposed in the research literature (Jonnaert et al., 2007, p. 197), Quebec’s reform defined it as “a set of behaviours based on the effective mobilization and use of a range of resources” (Gouvernement du Québec, 2001). According to this definition, teachers, books, the Internet, as well as content knowledge are perceived as resources that have to be mobilized by the learner in order to solve problems. Competencies must therefore be developed through the resolution of so-called “situational problems”, which in turn must be inspired by or situated in real-life contexts labelled “broad areas of learning”, such as “Media Literacy,” “Health and Well-Being,” “Environmental Awareness,” etc. These learning contexts are considered essential and central to the development of competencies because, as Jonnaert suggests, “competencies necessarily develop in situations” (2007, p. 190). Therefore, teachers were encouraged to foster learning within rich and authentic situations instead of concentrating their efforts on the quality of their lectures and on pencil-and-paper exercises.
These “learning situations” may integrate many compulsory-knowledge elements from a variety of disciplines within a context of situational problems. This interdisciplinary (or “integrated”) approach also provides opportunities for students to develop an interest in different sectors or disciplines and an eventual aptitude to work in associated professional occupations (Gouvernement du Québec, 2008a). For a clear and more complete description of the origin, structure, and general implications of this reform, we refer the reader to the article by Norman Henchey (1999).
Science and technology programs have also had to adapt, like other school disciplines, to the constraints of this reform and integrate three subject-specific competencies that must be developed throughout the program, from Kindergarten to Grade 11. At the beginning of the secondary level (Cycle One), for instance, the three science and technology competencies require students to (Gouvernement du Québec, 2004b):
1. Seek answers or solutions to scientific or technological problems; 2. Make the most of [their] knowledge of science and technology; and 3. Communicate in the languages used in science and technology.
The three competencies are formulated differently from one level to the next, with simpler forms at the elementary level and more demanding ones at the end of the secondary level. The general idea, however, remains the same throughout Kindergarten to Grade 11. Developing such competencies within situational problems that integrate many disciplines (physics, chemistry, technology, geology, astronomy, etc.) was presumed to make students “view [their] knowledge as a tool that can be used in everyday life” (Gouvernement du Québec, 2001) and that their “interest in science and technology can be developed in various ways, and [that] it is the school’s responsibility to explore these different avenues” (Gouvernement du Québec, 2004b).
A very important focus has also been put on environmental issues throughout the secondary level, especially during Grade 10, when four to six specific “environmental problems” are explored (Gouvernement du Québec, 2008a). As recently observed (Potvin & Dionne, 2007), when these changes were first implemented, they were believed to require a “major transformation in the work of teachers, expectations, task definition, style of work and the working culture of the school” (Henchey, 1999, p. 227).
Implementation of these new programs began in 2000 with the beginning of the elementary level and ended in 2010 at Grade 11 (Secondary 5). Up to this point, and since the implementation ended very recently, there have been very few means of measuring to what extent the reform was a success or to what extent it was effective. In 2007, a few authors reported implementation difficulties in the areas of science and technology (Potvin & Dionne, 2007), and other local research initiatives attempted to look at the effects of the reform on learning; however, most of the research was about mathematical education and is still unpublished (Haeck, Lefebvre, & Merrigan, 2011; Théorêt, Leroux, Carpentier, & Bertrand, 2005), or the research merely measured the perceptions of different parties involved instead of students’ actual performances (CRIRES, 2007). International testing seems to show a small setback in Quebec’s science results in TIMSS 2007 “Trends in international mathematics and science study” (Gouvernement du Québec, 2008b) and PISA “Programme for International Student Assessment“ (OECD, 2009); however, the province still maintains its rather enviable rankings. Nevertheless, these results should not be too unsettling because international tests are usually the result of consensus or compromise between countries or provinces, and therefore it is not especially surprising that school systems that become more atypical, unconventional, or innovative do not achieve optimal performance levels. It is noteworthy that the new Quebec curriculum has been given many different labels, such as “progressive” (Henchey, 1999, p. 235), “daring” (Painchaud & Lessard, 1998), as well as “philosophical failure” (Baillargeon, 2006) and “obsessive” (Boutin & Julien, 2000), most of which rarely depict a conventional reform.
Therefore, international and national testing initiatives might provide information on what Quebec’s system is moving away from or coming closer to, but they cannot determine if it is reaching the goals that it has set for itself. We therefore believe that sometimes international testing might be unfair to groundbreaking or unconventional curriculum initiatives.
• Research question 1: Have schools improved students’ performances in scientific problem-solving competency since the reform was implemented?
• Research question 2: In the same context, have students improved their perception of (a) their interest in science and technology, (b) their interest in a scientific career, (c) their attitude toward environmental challenges (d) the use of school to understand real-life issues, and (e) the nature of scientific activity?
Our hypotheses are that the reform produced positive outcomes for every one of these questions and sub questions.
Methodology
Task / Research question 1
Since the use of, and therefore the evaluation of, a complex competency such as “Seek[ing] answers or solutions to scientific or technological problems” involves choices, iterations, and interactions with reality, it would be fair to say that ordinary “pencil-and-paper” testing would be quite limited in terms of evaluating the level of problem-solving competency. Instead, as Dionne (2006) suggests, “computerized tests could be used to evaluate cognitive processes.” In this perspective, a decade ago, Ko (2002) used a game called Find the Flamingo to evaluate problem-solving skills, based on the premise that games involve choices and inferences, just like problem solving. His conclusions suggest that such a game could be very useful to establish differences within subject populations. More recently, it has also been demonstrated that problem-solving skills could be improved by the use of computer simulations or games (Liu, Cheng, & Huang, 2011). The results obtained by these researchers were, however, limited to students that did not express boredom or anxiety while playing the game. Nevertheless, these results suggest that there may be a relevant link between computer games and problem-solving skills.
Kröner, Plass, and Leutner (2005) had also already used a computer simulation to evaluate problem-solving skills. One of the key properties of their simulation was that it did not “involve contents and tasks that increase the influence of prior knowledge acquired under uncontrolled conditions” (p. 350). For these authors, this aspect allowed them to obtain data that avoided “uncontrolled influence of prior knowledge,” and therefore led to a purer evaluation of the skill. The simulation involved a “fictitious machine” that did “not have a common analogy in real life” (p. 351). Students had to infer how it worked in order to perform better. The test was evaluated and deemed suitable for intelligence assessment. Similar attempts at avoiding the interference of prior knowledge in simulations (Johnson, Moher, Cho, Edelson, & Russell, 2004; Kluge, 2008) have also been made in the past. Some of them even developed what they call “a disciplinary simulations” in which no known phenomena could serve as a basis for understanding the logic of the simulation (Couture & Meyor, 2008). For some evaluation specialists, it might be precisely in contexts where discipline does not interfere that “competencies would appear most relevant” (Crahay & Detheux, 2005, p. 61).
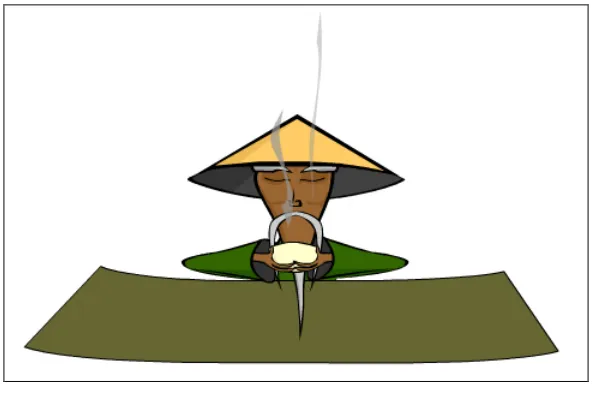
with scientific laboratory experiments and because it is unrelated to any compulsory curriculum concepts. The goal of this problem-solving simulation is to make the ideal soup for a “master taster” (see Figure 1) by mixing the right quantities of three different vegetables.
Figure 1: An image from the computer simulation: the master taster.
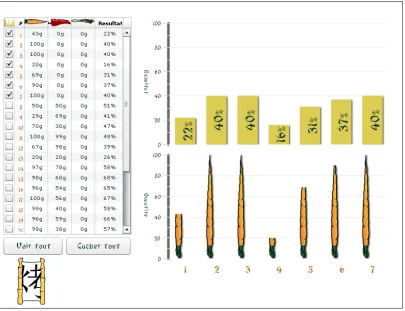
In this game, players can only make one soup for each virtual day of the week; however, Sunday’s soup is an examination soup. Players can freely test the preferences of the master taster every day, but on Sundays, they have to make their best possible soup, using preference statistics displayed in an adjustable graph (Figure 2). At first, players can only use one vegetable (a carrot). Once the master is adequately satisfied, the players have access to a second vegetable (a pepper), and then a third (a green onion). The problem then becomes increasingly complex because of the combination of more and more vegetables. Control of experimental variables and analysis of the given graph information become increasingly important as the game unfolds.
Figure 2: Graphic showing the preferences of the master taster for different amounts of carrot.
Once the master taster is completely satisfied (i.e., satisfaction score of over 98%), the game restarts with a new situation, where all three vegetables are immediately unlocked and there is a new master taster with all-new preferences.
We believe this simulation can be used to evaluate the problem-solving competency in the science and technology curriculum because (a) it simulates a well-defined and clearly constrained problem to be solved, which can be mathematically treated, (b) it suggests that an optimal solution “positively” exists, (c) it simulates manipulation errors, (d) it allows for trial-and-error, iterations, and interactions with the “reality” of the simulation, (e) it involves tweaking and interpreting graphs and/or tables, (f) it requires making choices (exploring different paths) and testing hypotheses, and )g) it requires variable control in order for the players to efficiently infer the preferences of the master taster.
The game also applies components of the problem-solving competency that can be found throughout the provincial science and technology program, such as requiring that the student “use[s] a variety of exploration strategies” (Gouvernement du Québec, 2001, p. 167), “recognizes the elements that seem relevant” (Gouvernement du Québec, 2004b, p. 277), “considers [and chooses] different scenarios,” “adjusts his tests / reviews his plan / looks for new ways of solving the problem,” “looks for trends in the data,” “examines the results in light of the procedure”, and “controls important variables that can influence the result” (Gouvernement du Québec, 2008a, p. 15), etc. All of the above-mentioned are components of the problem-solving competency, so all of them could be useful to its evaluation.
The recording that was made of all the interactions between the players and the simulation allowed us to generate variables that are relevant to the exercise of the problem-solving competency.
Task / Research question 2
A computerized questionnaire was used to test attitudes toward science and technology. For feasibility considerations, we were not able to include more than 23 questions in the task. For the purpose of using questions that have good epistemological and statistical properties, most of our questions were strongly inspired by or adapted from the ones used in the well-known ROSE (Relevance of Science Education) questionnaire. This questionnaire has been used in many studies (more than 35 countries) on students’ views of science education (Jenkins, 2006) and was created to study the “factors of importance in the learning of science and technology as perceived by the learners” (Schreiner & Sjøberg, 2004, p. 1). Questions were selected based on their relevance to Quebec’s educational reform. A panel of three experts was created to design, choose and/or slightly adapt questions based on their relevancy to this context and to the explicit goals of the reform. The list of questions, answered using a 4-level Likert scale, appears in appendix 1. Although it is sometimes recommended to consider scales with many levels, we used a 4-level scale in order to match many questionnaires of past research in the field.
Population
variety in program specialties, such as international programs; school sizes; etc.).All Grade 11 (secondary 5) students from these schools were assigned to complete the two tasks. All of the students were at the end of their elementary-secondary education and had received 11 years of schooling (seven years from Kindergarten to Grade 6, plus five years of secondary school) based on the provincial curriculum. Only those students who received parental consent were included in the study.
The 2011 (N=383) and 2009 (N=468) subgroups were composed of students from the four secondary schools. The students from the 2009 subgroup formed the last cohort of entirely “non-reformed” students. They had been subjected to the precedent “pedagogical objective-based” curriculum. The 2011 subgroup group was composed of the first completely “reformed” students. They had been subjected to the recent “competency-based” curriculum for every year of their academic path. A total of 73% of all grade 11 students from these schools were able to provide written consent from their parents/guardians and were placed in the study (N=851). The two subgroups were composed of a different number of participants only because of an uneven amount of students in 2009 and 2011.
Protocol
Experiments were held in May 2009 and 2011, with a few exceptions in June. This time of year (the end of the secondary school year) was optimal for maximum exposure of the students to the effects of the two different curricula. Students were gathered together in classrooms at their schools. They were then assigned individually to portable computers, with earphones, in order to encourage individual work and avoid any disturbances. We used the LabMECAS (the Mobile Laboratory for the Study of Learning Pathways in Sciences) and provided minimal oral directives in order to have better control of the experiment conditions. After answering questions about the procedure, the researchers gave the order to begin the experiment. First, students had to answer the 23 questions in task 2, and then they had to listen to the directions for task 1 (explanations about the goal of the game and the procedure). After that, students began task 1, which took approximately 45 minutes; however, only 38 minutes of the task were used for analysis. Both the 2009 and 2011 experiments were conducted in the same way and in the same schools.
Analysis
For the analysis of task 1, seven variables that were relevant to the definition and description of the problem-solving competency of the provincial curriculum were considered. The variables fell under four main categories:
• Maximum satisfaction scores
o Variable 1: This variable indicates the best score given by the first master taster on Sundays. Between 0 and 1, the variable is higher if the player was able to better interpret the taster’s preferences with more than one vegetable.
o Variable 2: This variable indicates the best score given by the second master taster on Sundays. Between 0 and 1, the variable is 0 if the player did not reach the second master taster.
o Variable 3: Between 0 and 1, this variable indicates the ratio between 7 (the number of days in one virtual week) and the number of days necessary to reach the threshold of satisfaction for the first vegetable. For example, a player who reached the threshold in just 7 days (the fastest possibility) will obtain a score of 1, and another player who reached the threshold in 14 days will obtain a score of 0.5 for this variable, and so on (0.33, 0.25, 0.2, etc.).
o Variable 4: Between 0 and 1, this variable indicates the ratio between 7 and the number of days necessary to reach the threshold of satisfaction for the combination of two vegetables.
o Variable 5: Between 0 and 1, this variable indicates the ratio between 7 and the number of days necessary to reach the threshold of satisfaction for the combination of three vegetables.
• Graph time
o Variable 6: This variable indicates the proportion of time spent observing the graphs during the game.
• Control of variables
o Variable 7: This variable concerns only the part of the game where three vegetables were unlocked. For each day of exploration, except Sundays, we give a score of 1 if the player changes the quantity of only one vegetable, a score of 0.5 if the player changes two vegetables and 0 if the player changes three. Afterward, the mean of all these scores is calculated. This variable indicates, on a scale of 0 to 1, an appreciation of the player’s tendency to control the experimental variables of the problem.
The sum of these seven variables is the competency score. After a reliability analysis of the data, these variables render a Cronbach’s alpha of 0.682. A t-test was conducted on the competency score to compare the 2009 and 2011 subgroups. Effect size , where μ1 is the mean for
the 2011 subgroup, μ2is the mean for the 2009 subgroup, and σ is the standard deviation, was also calculated as suggested by Schroeder (2007).
For the analysis of the results of task 2, a factor analysis was carried out. Five principal components were identified, based on the results and on our knowledge of the questions. These five components were selected because they all showed both conceptual and statistical coherence and independence to the analysts.
1. General attitude toward science and technology in school (questions 1, 3, 4, 6, 9, 10, 20, 21, 22, and 23; a Cronbach’s alpha of 0.758)
2. Interest in a scientific career (questions 2, 5, and 11; a Cronbach’s alpha of 0.591) 3. Attitude toward the environment (questions 15, 17, 18, and 19; a Cronbach’s alpha of
0.627)
4. The use of school to understand real-life issues (questions 6, 7, and 8; a Cronbach’s alpha of 0.608)
5. The nature of scientific activity (questions 12, 13, and 14; a Cronbach’s alpha of 0.424)
conducted on each of these components to enable comparison between subgroups. Effect sizes were also calculated.
Results
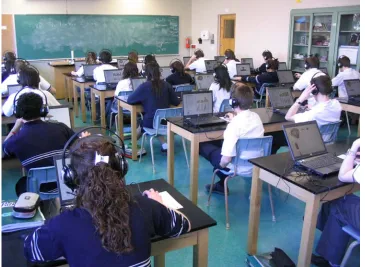
393 boys and 457 girls participated in the study, for a total of 850 students. Both subgroups had a 46% proportion of boys.
Figure 4: Students playing the “Cooking game”.
Research question 1
Table 1 indicates the competency score results (data normally distributed).
Table 1: Competency scores for Task 1
Subgroup N M SD
Std. error mean
t df Sig. (2-tailed) θ Lower Upper
2009 468 2.95 1.07 .049
-2.36 848 0.018* 0.161 -0.314 -0,029 2011 382 3.12 1.04 .053
Note. *p < = 0.05, **p < = 0.005
Research question 2
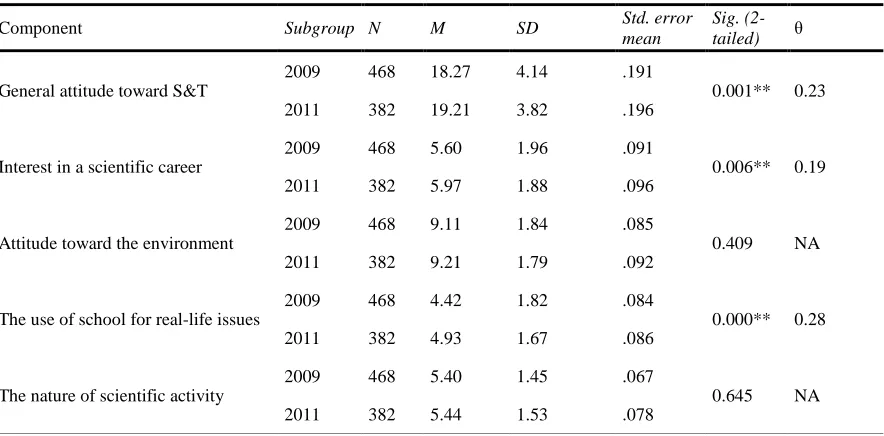
Table 2: Results for each component of the Task 2 questionnaire
Component Subgroup N M SD Std. error mean
Sig. (2-tailed) θ
General attitude toward S&T
2009 468 18.27 4.14 .191
0.001** 0.23 2011 382 19.21 3.82 .196
Interest in a scientific career
2009 468 5.60 1.96 .091
0.006** 0.19 2011 382 5.97 1.88 .096
Attitude toward the environment
2009 468 9.11 1.84 .085
0.409 NA 2011 382 9.21 1.79 .092
The use of school for real-life issues
2009 468 4.42 1.82 .084
0.000** 0.28 2011 382 4.93 1.67 .086
The nature of scientific activity
2009 468 5.40 1.45 .067
0.645 NA 2011 382 5.44 1.53 .078
Note. *p < = 0.05, **p < = 0.005
Discussion and conclusion
This research project attempted to answer—in the most convincing way possible and according to our comprehension of Quebec’s educational reform—whether the reform could reach the goals it set for itself. Among these goals, the achievement of better problem-solving competency and the increase in several perceptions were hypothesized. Two tasks, a computer game simulation and a questionnaire, were administered to students from a “non-reformed” cohort (2009) and compared to a “reformed” (2011) one.
Results show an increase in all the studied variables. Hypotheses were confirmed with statistically significant results for all variables except for “attitude toward the environment” and the “nature of scientific activity.” It is possible that, for these two variables, our selection of questions was insufficient or incoherent (rather weak Cronbach’s alphas, especially for the “nature of scientific activity”). It is also possible that the reform has not been carried through to a sufficient degree for these goals to be achieved yet, or that sound teacher professional development or training have not adjusted yet, or have not been sufficient. It is also possible that an inability on the part of the schools to address these challenges, or some other external factors, have interfered. It is also possible that results could have been stronger if we had asked more questions, or more congruent question, or used another type of Likert scales, with more levels, or that provide a neutral choice.
performances are remote from the mean. Nonetheless, the rather modest effects can mean one of these two things (among others): (1) the reform has just begun to show its effects and it will be possible to record more of its effects once implementation reaches a more mature state or (2) the reform has produced such small effects that the question of the considerable resources that have been invested can be raised.
Nonetheless, it seems that one effect of the reform was to simultaneously move teaching and consequently learning slightly away from the standards (international testing) and slightly closer to the unique and rather exclusive goals it has set for itself. It then appears as something of a compromise instead of a general decrease in quality. In a way, these results can be encouraging for curriculum designers in that it is possible to orient an entire school system by means of curricular changes toward socially shared goals, even if this change causes somewhat of a crisis (media, forums, conferences) such as the one that has happened in Quebec over the last few years, and even with significant and documented implementation difficulties.
Of course, these results cannot be generalized to other disciplines, or even to other competencies of the “science and technology” curriculum. They also cannot be generalized to all competency-based science curriculums, nor extrapolated to the future of Quebec’s school system, because it is possible that the increased results might be temporary, due, for example, to an eventual pedagogical effervescence, that is, a “reform-triggered” occurrence producing a novelty effect. Therefore, more longitudinal studies are needed to understand the real long-term effects of this reform. It could also be argued that a part of the obtained positive results might be due to the smaller number of subjects (N) in 2011 (fewer students in the schools). However, the difference between the cohorts appears rather small (18%), and participation percentages were almost the same for both subgroups (72% and 73%).
It also might be argued that the differences observed between the cohorts were due to something other than the reform. After all, in two years, societies indeed change in many ways, and the educational system is not the only thing that has an effect on learning, performance, and perceptions. Nevertheless, when we consider the considerable effort invested in the design and completion of this study, and the level of rigour we imposed on ourselves as a team, we believe that it might be quite difficult to provide a better look at the effects of this reform (on science and technology) and to better isolate the effects it produces in the context of such a complex thing as an entire society in evolution. In the context of research, we believe that this study is a mere brick in the construction of our understanding of the effects of curricular changes, yet still a valuable one.
We also believe that we provided sufficient evidence to support the idea that computer games can, as Ko (2002) and Dionne (2006) suggested, be used to evaluate complex cognitive processes, like competencies. A stronger research tradition is needed, however, to confirm to what extent computer games can be used to evaluate competencies in specific domains, such as science, or in specific fields, such as chemistry.
technology” competency, the most serious criticism aimed at our work argues that it is possible that we did not measure a domain-specific or “plain” specific competency, but a more generic skill, not as closely related to the reform as we might think. This is possible, but it is not, in our opinion, too much to be concerned about, because the reform had already assumed that competencies are more general and “transversal” (Gouvernement du Québec, 2004b), and had even hoped that a competency learned in one discipline, or domain, would presumably be at least partly transferable to other fields. The “transversality” of competencies is still, however, a controversial matter, and although this aspect of competencies can be presented as a treasure that enriches pedagogical initiatives, it remains a real problem for evaluation.
It appears, however, that concentrating on the development of competencies during “learning situations” (or “situational problems”), has also had an interesting effect on different perceptions about science and technology. This result appears, along with the one on the development of competency, to confirm the conclusions of recent research (Krapp & Prenzel, 2011) which argues that the way in which science is integrated into contexts is very important for performance as well as for interest.
Acknowledgements
We would like to thank Mohammed Izzeroukene, Fréderic Fortin, Julie Robidoux and Yannick Bergeron, for their help while collecting the data. This research has been possible because of the financial participation of the Canada Foundation for Innovation (CFI) and of the Social Sciences and Humanity Research Council of Canada (SSHRC).
References
Baillargeon, N. (2006). La réforme québécoise de l'éducation: une faillite philosophique. Retrieved January 20, 2011, from
Boutin, G., & Julien, L. (2000). L’obsession des compétences: Son impact sur l’école et la formation des enseignants. Montréal (QC): Éditions Nouvelles.
Braslavsky, C. (2001, may). Tendances mondiales et développement des cuccicula. Paper presented at the international conference L'éducation dans tous ses états - influences européennes et internationales sur les politiques nationales d'éducation et de formation, Association francophone d'éducation comparée (AFEC). Retrieved October 23, 2012, from
Council of ministers of education Canada (CMEC). (1997). Common Framework of Science Learning Outcomes K
to 12. Retrieved October 23, 2012, fro
Couture, M., & Meyor, C. (2008). Simulations informatiques adisciplinaires et résolution de problèmes ouverts : une étude exploratoire auprès d’étudiants en formation des maîtres. Revue internationale des technologies en
pédagogie universitaire, 5(2), 50-67.
Crahay, M., & Detheux, M. (2005). L'évaluation des compétences, une entreprise impossible? Mesure et évaluation en éducation, 28(1), 57-78.
CRIRES. (2007). Évaluation du nouveau programme de formation de l'école québécoise : la qualité de sa mise en oeuvre et ses effets perçus à ce jour: enquête auprès des directions d'école, du personnel enseignant, du personnel professionnel non enseignant et des parents des écoles primaires : rapport de recherche. Retrieved October 23, 2012, from
http://www.sehr-csq.qc.ca/fileadmin/FSE/syndicats/z28/documents_pdf/%C3%89valuation_du_nouveau_progra mme_de_formation_de_l%E2%80%99%C3%A9cole_qu%C3%A9b%C3%A9coise.pdf.
Gouvernement du Québec. (2001). Programme de formation de l’école québécoise, Éducation préscolaire et enseignement primaire. Québec: Les publications du Ministère de l'Éducation du Québec (MEQ).
Gouvernement du Québec. (2004a). Calendrier d'implantation du Programme de formation. Québec: Ministère de l'Éducation, du Loisir et du Sport (MELS).
Gouvernement du Québec. (2004b). Programme de formation de l’école québécoise, Enseignement secondaire, Premier cycle. Québec: Les publications du Ministère de l'Éducation du Québec (MEQ).
Gouvernement du Québec. (2006). Bilan de l'application du programme de formation de l'école québécoise - Enseignement primaire. Québec: Ministère de l'Éducation, du Loisir et du Sport (MELS).
Gouvernement du Québec. (2008a). Programme de formation de l’école québécoise, Enseignement secondaire, Deuxième cycle. Québec: Les publications du Ministère de l'Éducation du Québec (MEQ).
Gouvernement du Québec. (2008b). Tendances de l’enquête internationale sur la mathématique et les sciences TEIMS 2007. Retrieved October 23, 2012, from
Haeck, C., Lefebvre, P., & Merrigan, P. (2011). All students left behind: An ambitious provincial school reform in Canada, but poor math achievements from grade 2 to 10. Retrieved October 23, 2012, from
Henchey, N. (1999). The new curriculum reform: what does it really mean? McGill journal of education, 34(3), 227-242.
Jenkins, E. W. (2006). Student opinion in England about science and technology. Research in science and technological education, 24(1), 59-68.
Johnson, A., Moher, T., Cho, Y., Edelson, R., & Russell, E. (2004). Learning science inquiry skills in a virtual field.
Computers & Graphics, 8(3), 409-416.
Jonnaert, P., Masciotra, D., Barrette, J., Morel, D., & Mane, Y. (2007). From competence in the curriculum to competence in action. Prospects, XXXVII(2), 187-203.
Kluge, A. (2008). Performance assessments with microworlds and their difficulty. Applied Psychological Measurement, 32(2), 156-180.
Ko, S. (2002). An empirical analysis of children’s thinking and learning using a computer game context.
Educational Psychology, 22(2), 219-233.
Krapp, A., & Prenzel, M. (2011). Research on interest in science: theories, methods, and findings. International journal of science education, 33(1), 27-50.
Kröner, S., Plass, J., & Leutner, D. (2005). Intelligence assessment with computer simulations. Intelligence, 33, 347-368.
Liu, C.-C., Cheng, Y.-B., & Huang, C.-W. (2011). The effect of simulation games on the learning of computational problem solving. Computers and education, 57, 1907-1918.
Moon, Y.-L. (2007). Education reform and competency-based education. Asia pacific education review, 8(2), 337-341.
OECD. (2009). PISA Equally prepared for life?: how 15-year-old boys and girls perform in school. Retrieved
October 23, 2012, fro
Painchaud, G., & Lessard, C. (1998). La réforme de l'éducation au Québec: le curriculum. Retrieved October 23,
2012, fro
Potvin, P., & Dionne, É. (2007). Realities and Challenges of Educational Reform in the Province of Québec : An Exploratory Research About Science and Technology Teaching. McGill Journal of Education, 42(3), 293-410. Salta, K., & Tzougraki, C. (2011). Conceptual versus Algorithmic Problem-Solving: Focusing on Problems Dealing
with Conservation of Matter in Chemistry. Research in Science Education, 41(4), 587-609. Schreiner, C., & Sjøberg, S. (2004). Sowing the seeds of ROSE. Retrieved October 23, 2012, from
Schroeder, C. M., Scott, T. P., Tolson, H., Huang, T.-Y., & Yi-Hsuang, L. (2007). A meta analysis of national research: effects of teaching strategies on student achievement in science in the United States. Journal of research in science teaching, 44(10), 1436-1460
Théorêt, M., Leroux, M., Carpentier, A., & Bertrand, C. (2005). Analyse de l'appropriation de la réforme du curriculum par des enseignants et évaluation d'impact sur la réussite en mathématiques d'élèves à risque - PROJET TRANSMATHS. Retrieved April 13, 2011, from
Appendix 1: the 23 questionnaire questions
1 Je suis généralement intéressé(e) par les sciences et la technologie (I am usually interested in science and technology)
2 J'envisage une carrière dans un domaine qui touche aux sciences et à la technologie (I consider a career in science and technology)
3 C'est avant tout l'école qui pourra m'intéresser aux sciences et à la technologie (School is the best way for me to get to know science and technology) 4 Ce que j’ai appris en science à l’école m’aidera dans ma vie de tous les jours
(What I have learned in school will help me in my everyday life)
5 Je pense que les sciences que j’ai apprises à l’école augmenteront mes possibilités de carrière
(Things I have learned in science will improve my career possibilities) 6 Les sciences à l’école m’ont permis de développer mon esprit critique
(Science learned in school has improved my judgement) 7 Les sciences à l’école ont développé mon intérêt pour la nature
(School science got me interested in natural phenomena)
8 Les sciences à l’école m’ont enseigné comment prendre plus soin de ma santé (School science convinced me to better take care of my health)
9 Les sciences à l’école sont intéressantes (School science is interesting)
10 La technologie à l’école est intéressante (School technology is interesting)
11 La science et la technologie sont importantes pour la société (Science and technology are important for society)
12* Les scientifiques suivent une méthode scientifique qui les amène toujours à des réponses correctes
(Scientists follow a scientific method that always brings them to right answers) 13* Les scientifiques sont neutres et objectifs
(Scientists are neutral and impartial)
14 Les théories scientifiques se développent et changent tout le temps (Scientific theories develop and change all the time)
15* Les menaces pour l’environnement ne me concernent pas (Threats to the environments do not concern me)
16 Les problèmes environnementaux font que le futur du monde semble peu prometteur et sans espoir
(Environmental problems make me see the future of the world as hopeless) 17* Les problèmes environnementaux sont exagérés
(Environmental problems are exaggerated)
18 Je souhaite que certains problèmes environnementaux soient résolus même si cela signifie certains sacrifices de ma part
(I hope that certain environmental problems will be solved even if it requires sacrifices from me)
20 Quand j’ai de bons résultats en sciences, je me sens valorisé(e) (When I get good grades in sciences, I acquire self-assurance)
21 En classe de sciences, je me sens capable de comprendre et de résoudre des problèmes, mêmes difficiles
(In science classes, I am able to understand and solve problems, even difficult ones) 22* Je me sens désemparé(e) et démuni(e) lorsque je dois résoudre des problèmes en sciences
(I feel discouraged and helpless when I have to solve problems in science)
23* En sciences, qu’il s’agisse de répondre à des tâches à faire (activités, exercices...) ou à des devoirs surveillés, je suis très nerveux(se)
(In science, when I have to accomplish a task (activities, exercises…), or to do important homework, I get really nervous)