Issues
ISSN: 2146-4138
available at http: www.econjournals.com
International Journal of Economics and Financial Issues, 2018, 8(4), 327-334.
Effect of Commitment, Internal Audit, and Financial
Management on Local Government Performance in South
Sumatra
I. G. B Surya Negara
1*, Didik Susetyo
2, Syamsurijal Abdul Kadir
3, Saadah Yuliana
41Doctorate Candidate, Faculty of Economy, University of Sriwijaya, Indonesia, 2Department Economic Development, Faculty
Economic, University of Sriwijaya, Indonesia, 3Department Economic Development, Faculty Economic, University of Sriwijaya,
Indonesia, 4Department Economic Development, Faculty Economic, University of Sriwijaya, Indonesia.
*Email: [email protected]
ABSTRACT
This study aims to determine the effect of affective commitment, continuance commitment, normative commitment, internal control of income accounting system, internal control of expenditure/cost accounting system, budget planning, budget implementation, reporting and budget accountability, budget performance evaluation on local government performance in South Sumatera. The analysis used primary data and secondary data with analysis
technique using multiple linear regression. The result of this research concludes that affective commitment has a significant and positive effect on local government performance and internal control of income accounting system has negative and significant influence to local government performance,
while other variables have no effect. The estimation results also show that the regencies of Empat Lawang, Prabumulih and Ogan Komering Ilir are
better, while the Ogan Komering Ulu Timur, Lubuk Linggau and Lahat districts are lower. The financial performance of local government which is categorized as very effective is OKI Regency and OKUT, efficient category is OI Regency, OKUS, OKUT, OKI, OKU, Empat Lawang, and very
economical is Muratara Regency.
Keywords: Commitment, Internal Control, Financial Management, Performance, Local Government
JEL Classifications:G18, C33, O18
1. INTRODUCTION
Among organizations or entities is the public sector, where public sector organizations are an economic entity that has its own uniqueness. The term economic entity reflects the fact that it governs vast economic resources through economic and financial transactions with an orientation not merely to seek profit (Bloch and Bugge, 2013; Wicaksono, 2015). This public sector organization is emerging within the central government as well as local governments. The success of the organization is seen from its performance, where the performance of a government is a description of the achievement of the results of the implementation of an activity, the program in realizing the goals, objectives, missions and regional vision as contained in the planning document (Carpenter et al., 2012).
Local governments are given wide authority in organizing all government affairs from planning, implementation, supervision, control and evaluation established by government regulations. The granting of autonomy rights to local governments to determine the Regional Revenue and Expenditure Budget (APBD) itself in accordance with the needs and potentials of the region. Regional Revenue and Expenditure Budget as set forth in the form of local government financial policy is one of the triggers of economic growth of a region (Mudhofar and Tahar, 2016; Setyaningrum and Syafitri, 2012; Khikmah, 2014).
will be related to the funds used to finance the activity. Funding sources and expenditures on governance will be reflected in the State Budget (APBN) and the Regional Budget (APBD). Currently regional finances in Indonesia use the Regional Financial Information System (SIKD) therefore as a regional financial management system should always be guided by the applicable legislation. Empirical facts show that of the total 524 local governments (Pemda), 361 or 68.89% have used SIKD, and 163 local governments (31.11%) are not yet known for certain systems used in the management of local finances. Data as of October 2012 provides an overview of the regional financial management used by the local government is still not uniform. A total of 223 LGs use Regional Management Information Systems (SIMDA), 68 Local governments use SIPKD, 123 Local governments use other systems, and 110 LGs do not use information systems (Kementerian Keuangan Republik Indonesia, 2013). This condition illustrates that the local government that has not yet used SIPKD still creates confusion of different intraprestasi reference as well as violation of obligation or authority resulting in disharmonization or inconsistency in local financial management (Halim, 2012).
Susetyo (2008) explains that the management of regional finances can not be separated from the factor of the financial capacity of the region, especially in the era of autonomy. Regional capability and local budgets are basically the ability of local governments to increase local revenue revenues with the expectation that local governments in Indonesia are more self-reliant in the financial sector. South Sumatra Province consists of 13 districts and 4 cities that continue to explore the potential of revenue in the region. The performance of financial management of regency/city government in Sumatera Selat Province can be seen from the result of examination (opinion) of Supreme Audit Board (BPK).
The development of BPK’s opinion on district or city financial report in South Sumatera Province from 2010 to 2016 shows that overall for South Sumatera Province Year 2010 up to 2013 had WDP (reasonable with exception) status then 2014 to 2016 increased to WTP (reasonable without exception) status. In 2010 only one area (6.67%) stated by PAPs by BPK namely Palembang City, while others (93.33%) stated WDP. The increase occurred in 2011 where the area declared WTP increased to 4 districts or cities (26.67%), this number increased to 5 regions (33.33%) got PAPs in 2012. But in 2012 there is one region declared TMP (Not Saying Opinion), that is Empat Lawang District. Until the end of 2016 there is still one area stated WDP, namely North Musi Rawas (Muratara), while others stated WTP (BPK Representative South Sumatra, 2017). BPK Representative of South Sumatera Province stated that the opinion of WTP from BPK indicates that local government financial reporting is not yet fully believed its reasonableness. This is caused by several factors, such as weak internal control system, unregulated state-owned or regional goods, inadequate procurement of goods and services with prevailing regulations, presentation of financial statements not yet in accordance with Government Accounting Standards (SAP), the weak financial reporting system, and the inadequate competence of human resources manager at the local government.
BPK Representative of South Sumatera Province stated that the opinion of WTP from BPK indicates that local government financial reporting is not yet fully believed its reasonableness. This is caused by several factors, such as weak internal control system, unregulated state-owned or regional goods, inadequate procurement of goods and services with prevailing regulations, presentation of financial statements not yet in accordance with Government Accounting Standards (SAP), weak financial reporting system, and inadequate competence of human resources manager in local government. Efforts to improve the performance of government or organizations, especially in South Sumatra can not be separated from the commitment, internal control, and financial management area (Permatasari and Temasmi, 2014; Matari et al., 2014; Mudhofar and Tahar, 2016).
Based on the above description it is necessary to conduct in-depth research related to the influence of commitment, internal control, and financial management on the performance of local governments in South Sumatra. The discussion conducted in this study is based on the theory of expenditure put forward by Musgrave (1959) which states that the development of state expenditure in line with the stage of economic development in a country. According to Musgrave, in the early stages of economic development, large state expenditures are required for government investment, especially to provide infrastructure such as roads, health, and education.
This research also uses the theory of New Public Management (NPM) in discussing the performance of local government. This NPM theory is a new public philosophy, as a step toward a governance approach that places emphasis on transparency, performance management and accountability of employees and public sector managers (Denhardt and Denhardt, 2003; Heyer, 2011).
According to Bovaird and Loeffler (2007) NPM is a streamlining movement of the public sector and makes it more comparative and tries to make public administration more responsive to the needs of society by offering economic, value for money measurements, choice flexibility and transparency. This research is conducted to examine and analyze the influence of commitment variables, internal control and financial management collectively to the performance of local government. This is an update of this research, besides that, this research analyze the performance of regency or city government in South Sumatra by using dummy variable.
2. LITERATURE REVIEW
2.1. Government Expenditure
2.2. NPM
NPM is a decentralized management system with new management tools such as controlling, benchmarking and lean management (Denhardt and Denhardt, 2003). NPM is understood as privatizing as far as possible of government activity. NPM is generally viewed as an approach in public administration that applies the knowledge and experience gained in the world of management and other disciplines to improve the efficiency and effectiveness of the performance of public services in the modern bureaucracy.
The implications of the NPM theory in this study may explain performance as a dependent variable because NPM theory is oriented to performance rather than policy by improving efficiency, effectiveness of public service performance in modern-day democracy. Therefore, in order to achieve the performance of the public sector, the existence of the district/city government as a trustworthy institution to act in accordance with the public interest by performing its duties and functions appropriately, to make the performance accountability mandated so that the economic and public services and the public welfare can be is maximized. In order to carry out these responsibilities goes well, the Bupati, SKPD and DPRD direct all their capabilities and expertise and are committed to optimizing the function of internal control and financial management as desired.
2.3. Government Performance
Performance is always associated with performance is the result of work that can be achieved by a person or group of people within an organization in accordance with the authority and responsibility of each in an effort to achieve the objectives of the organization legally, do not violate the law and does not conflict with the moral and ethics (Mudhofar and Tahar, 2016). Meanwhile Sephi and Darwanis (2013) defines performance as the output/outcome of activities/programs that will or has been achieved in relation to the use of budgets with quality and quantity measured. Performance measurement is the process of recording, measuring the achievement of activities and budget in the direction of achieving the mission through the results shown in the form of products, services, or a public service process.
2.4. Local Government Financial Performance
The financial performance of a government can be measured using the ratio of effectiveness, efficiency ratio, independence ratio and economic ratio according to Bastian (2006), Mihaiu et al. (2010), Hong (1991) and Eckardt and Shah (2006). Mahmudi (2016) public sector finance report is defined as the output of an accounting system useful for the provision of information to parties that will make the financial information as the basis for decision-making. Financial reports other than as a tool to provide financial information also serves as a tool of accountability and evaluation performance especially financial performance.
2.5. Local Government Commitment
Robbins and Judge (2013) defines commitment as a condition in which an individual sides with the organization and its purpose and desire to maintain its membership in the organization. Meanwhile Poznanski et al. (1997) argues that commitment can be defined as: (1) Confidence and acceptance of the organization’s goals
and values; (2) Willingness to work or work for the benefit of the organization; and (3) the desire to maintain membership of the organization. The research associated with the commitment of the organization was undertaken by Allen and Meyer (1990), on antecedent measurement of organizational commitment.
2.6. Government Internal Audit
Mulyadi (2001) states that internal audits include organizational structures, methods and measures coordinated to safeguard organizational wealth, check the accuracy and reliability of accounting data, encourage efficiency and encourage compliance with management policies. Whereas according to Statement on Auditing Standard defines internal supervision: (1) Administration supervision, covering organizational structure, procedures and records related to decision making process to carry out transactions authorized by management; and (2) Accounting oversight, covering organizational structure as well as procedures and records relating to efforts to maintain the security of assets and the trustworthiness of corporate financial records.
2.7. Local Government Financial Management
Bratakusuma and Solihin (2002) states that regional finance is all regional rights and obligations in the context of the conduct of local government which can be assessed by money including all forms of property related to the rights and obligations of the region, APBD. According to Halim (2004) local finance is defined as all the rights and obligations of the government that can be assessed with money. According to the Regulation of the Minister of Home Affairs Number 21 of 2011 on Guidelines for Regional Financial Management, regional finance shall be all regional rights and obligations in the context of the implementation of local government which can be assessed by money including all forms of property related to the rights and obligations of the region.
3. METHODOLOGY
The data is processed in the form of multiple linear regression equation where the regression model is tested by ordinary least square method. To ensure the resulting model is best linear unbias estimation (BLUE), then before testing the significance of the model, first classical assumption test will be performed which includes normality test, heteroscedasticity test, autocorrelation test, and multicollinearity test. If the resulting model is already BLUE, then will be tested significance to analyze the results of the regression. But if the model is not yet BLUE, it will be remedial in accordance with the violation of the assumption that occurred. After getting a model that is BLUE then can be done interpretation and analysis of the resulting model, and compare with existing theory.
The normality test aims to test whether in the regression model the dependent variable and the independent variable both have a normal distribution or not. A good regression model should have a normal or near-normal distribution (Ghozali, 2013). Another normality test in this study used non parametric statistical test Kolmogorov Smirnov (K-S).
between independent variables (independent). A good correlation model should not be correlated among independent variables. If independent variables are correlated then this variable is not ontogonal. Ontogonal variables are independent variables whose correlation values among independent variables equals zero.
According to Ghozali (2013), the heteroscedasticity test aims to test whether in the regression model there is a variance inequality of the residual one observation to the other observations. This research uses Glacier Test to regulate residual absolute values against independent variables (Gujarati, 2011).
According to Ghozali (2013), the coefficient of determination (R2) essentially measures how far the model’s ability to explain variations of independent variables. A small R2 value means the ability of independent variables in explaining the variation of dependent variables is very limited, whereas the value of R2 approaching one means the independent variables provide almost all the information needed to predict the variation of the dependent variable.
Simultaneously, hypothesis testing is done by F-test. According to Ghozali (2013) the F statistical test basically shows whether all independent or independent variables included in the model have a mutual influence on the dependent/bound variable. In this research F test is used to test hypothesis H1, which is the influence of commitment of local government, internal control of government and management of local finance simultaneous to performance of local government.
4. CASE STUDIES
The results of testing all variables are as follows in Table 1. Multiple regression model.
Performance = 33.858 + 0.119 KP1RSi − 0.005 KP2RSi + 0.013
KP3RSi − 0.136 PI1RSi − 0.032 PI2RSi – 0.009 PK1RSi − 0.016
PK2RSi + 0.011 PK3RSi + 0.012 PK4RSi + 0.230 (lAHAT) + 0.612
(MUBA) + 0.302 (BA) − 0.120 (OI) + 0.079 (OKUT) + 0.815 (OKUS) + 0.214 (PA) + 0.989 (OKU) + 0.344 (OKI) + 0.344 (PRA) + 0.296 (ME) + 0.629 (LL) + 1.559 (EL) + 0.376 (MURA)
From the regression equation above shows that the continuous commitment variable, internal control revenue accounting system, shopping/cost accounting system, budget planning and budget implementation have negative regression coefficient (−). The performance of local government having negative regression coefficient (−) is Ogan Ilir Regency.
Performance = 17.232 + 0.035 KP1RSi + 0.015 KP2RSi + 0.024
KP3RSi − 0.024 PI1RSi − 0.004 PI2RSi + 0.027 PK1RSi − 0.022
PK2RSi + 0.074 PK3RSi − 0.017 PK4RSi − 1.178 (lAHAT) + 0.613
(MUBA) + 0.903 (BA) + 0.331 (OI) + 00.434 (OKUT) − 0.580 (OKUS) − 0.220 (PA) − 0.637 (OKU) + 0.229 (OKI) + 0.072 (PRA) − 0.177(ME) − 0.316 (LL) − 0.570 (EL) + 1.082 (MURA)
From the regression equation above shows that internal control variables of income accounting system, internal control of expenditure/cost accounting system, budget implementation
and budget performance evaluation have negative regression coefficient (−). Local government performance with negative regression coefficient (−) are those of Lahat, OKUS, Pagaralam, OKU, Muara Enim, Lubuk Linggau, and Empat Lawang (Table 2).
Table 1: Government performance model with reliable information system dimension (KJ6)
Model Unstandardized coefficients Standardized coefficients
B Std. Error Beta
(Constant) 33.858 7.960
KP1_RS 0.119 0.044 0.253
KP2_RS −0.005 0.027 −0.016
KP3_RS 0.013 0.040 0.031
PI1RS −0.136 0.033 −0.397
PI2RS −0.032 0.023 −0.131
PK1RS −0.009 0.026 −0.033
PK2RS −0.016 0.043 −0.037
PK3RS 0.011 0.042 0.025
PK4RS 0.012 0.041 0.029
Lahat 0.230 0.563 0.042
Muba 0.612 0.402 0.173
BA 0.302 0.433 0.079
OI −0.120 0.399 −0.034
OKUT 0.079 0.677 0.011
OKUS 0.815 0.609 0.133
PA 0.214 0.562 0.039
OKU 0.989 0.555 0.180
OKI 0.327 0.426 0.082
PRA 0.344 0.434 0.086
ME 0.296 0.514 0.059
LL 0.629 0.606 0.103
EL 1.559 0.596 0.254
MURA 0.376 0.685 0.053
Source: Results of research, processed, 2017
Table 2: Government performance model with performance appraisal dimension (KJ5)
Model Unstandardized
coefficients Standardized coefficients
B Std. error Beta
1 (Constant) 17.232 9.331
KP1_RS 0.035 0.052 0.070
KP2_RS 0.015 0.032 0.049
KP3_RS 0.024 0.047 0.055
PI1RS −0.024 0.038 −0.066
PI2RS −0.004 0.027 −0.015
PK1RS 0.027 0.030 0.095
PK2RS −0.022 0.050 −0.047
PK3RS 0.074 0.050 0.165
PK4RS −0.017 0.048 −0.039
Lahat −01.178 0.660 −0.202
Muba 0.613 0.471 0.163
BA 0.903 0.508 0.224
OI 0.331 0.468 0.088
OKUT 0.434 0.794 0.058
OKUS −0.580 0.714 −0.090
PA −0.220 0.659 −0.038
OKU −0.637 0.651 −0.109
OKI 0.229 0.500 0.054
PRA 0.072 0.509 0.017
ME −0.177 0.602 −0.033
LL −0.316 0.711 −0.049
EL −0.570 0.698 −0.088
MURA 1.082 0.803 0.145
Performance = 25.034 + 0.176 KP1RSi − 0.019 KP2RSi + 0.041
KP3RSi − 0.078 PI1RSi − 0.020 PI2RSi + 0.054 PK1RSi − 0.077
PK2RSi + 0.009 PK3RSi + 0.048 PK4RSi − 0.289 (LAHAT) +
0.649 (MUBA) + 0.489 (BA) + 0.163 (OI) + 0.675 (OKUT) + 0.329 (OKUS) + 1.217 (PA) − 0.159 (OKU) + 0.142 (OKI) + 0.519 (PRA) + 1.168 (ME) − 0.130 (LL) + 0.640 (EL) − 0.618 (MURA)
From the regression equation above shows that the continuous commitment variable, internal control revenue accounting system, internal control accounting system expenditure/cost, and budget implementation have negative regression coefficient (−). Regency performance with negative regression coefficient (−) are those of Lahat, OKUT, Lubuk Linggau, OKU, Musi Rawas (Table 3).
The test results indicate that the value of Fcount is 1.874 and
significant is 0.019. The result of this significant number is smaller than 0.1. This means that the variables of commitment, internal control and financial management have a significant influence on the performance of local governments in the province of South Sumatra (Table 4).
The test results show that the value of Fcount is 0.805 and significant
is 0.714. The result of this significant number is >0.1. This means that the variables of commitment, internal control and financial management have no significant effect on the performance of local government in the province of South Sumatra is measured by the dimensions of performance assessment (Table 5).
Test results show that the value of Fcount of 0.777 and significant of 0.749. The result of this significant number is >0.1. This means that the variables of commitment, internal control and financial management have no significant effect on the performance of local government in the province of South Sumatra is measured by the dimensions of performance appraisal (Table 6).
From the Figure 1, the stem shows that the distribution of data is distributed according to the normal curve distribution. Thus it can be said that the data in this study has been normally distributed. These results are supported by the following scatterplot results, which indicate that the data used in the study has spread on the diagonal axis.
Figure 1: Normality test
Table 3: Government performance model with effectiveness dimension (KJ2)
Model Unstandardized
coefficients Standardized coefficients
B Standard
error Beta
1 (Constant) 25.034 12.785
KP1_RS 0.176 0.071 0.259
KP2_RS −0.019 0.044 −0.046
KP3_RS 0.041 0.064 0.068
PI1RS −0.078 0.052 −0.158
PI2RS −0.020 0.037 −0.057
PK1RS 0.054 0.041 0.142
PK2RS −0.077 0.069 −0.121
PK3RS 0.009 0.068 0.015
PK4RS 0.048 0.066 0.080
Lahat −0.289 0.905 −0.036
Muba 0.649 0.646 0.127
BA 0.489 0.696 0.089
OI 0.163 0.641 0.032
OKUT 0.675 1.088 0.066
OKUS 0.329 0.979 0.037
PA 1.217 0.903 0.153
OKU −0.159 0.892 −0.020
OKI 0.142 0.685 0.025
PRA 0.519 0.697 0.090
ME 1.168 0.825 0.160
LL −0.130 0.974 −0.015
EL 0.640 0.957 0.072
MURA −0.618 1.100 −0.061
Source: Results of research, processed, 2017
Table 4: Concurrent test results of government performance reliable information systems dimensions
Model Sum of
squares Df squareMean F Sig. 1 Regression 47,222 23 2,053 1,874 0.019b
Residual 47,504 89 1.096
Total 144,726 112 Source: Results of research, processed, 2017
Table 5: Concurrent testing results of government performance dimensions performance assessment
Model Sum of
squares df squareMean F Sig. 1 Regression 27.886 23 1.212 0.805 0.716b
Residual 133.973 89 1.505
Total 161.858 112 Source: Results of research, processed, 2017
Table 6: Concurrent test results of government performance dimensions of effectiveness
Model Sum of
squares df squareMean F Sig. 1 Regression 50.539 23 2.197 0.777 0.749b
Residual 251.532 89 2.826 Total 302.071 112
4.1. Multicollinearity Test
The Table 7 shows that tolerance is below and close to 1, while the VIF is above 1. It can be concluded that the regression model used in this study with dependent government performance variables with reliable information system dimension is free from multicollinearity problem (Table 8).
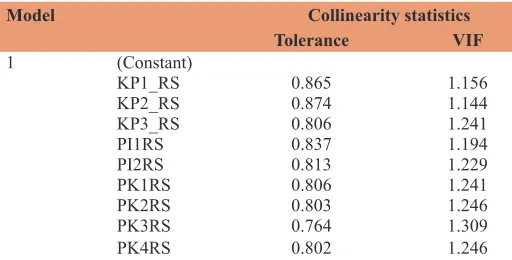
Based on the Table 9 it can be seen that the tolerance is below and close to 1, while the VIF is above 1. It can be concluded that the regression model used in this study with dependent variable of government performance (performance appraisal) is free from multicollinearity problem.
Based on the table below it can be seen that the tolerance is below and close to 1, while the VIF is above 1. It can be concluded that the regression model used in this study with dependent variable of government performance (effectiveness) free from multicollinearity problem.
The basic decision-making is (1) If there is a certain pattern, such as the points that exist form a certain pattern that is regular (wavy, widened then narrowed), then heteroscedasticity occurs, and (2) If there is no clear pattern, the point spreads above and below the number 0 on the Y axis, hence there is no heteroscedasticity. From the Figure 2 it can be seen that the residual residual value of the variable does not show a clear pattern, where the points spread above and below the number 0 on the Y axis. Thus it can be concluded that there is no heteroscedasticity (Figure 2).
4.2. Coefficient of Determination
Results of coefficient of determination testing are as follow:
From the Table 10, it shows that R2 of 0.326 which means that
the independent variable can only explain 32.6% change in the dependent variable. This shows that the independent variable is very low influence on the dependent variable. The coefficient of determination has a positive value (+) indicates the degree of correlation of independent variables to dependent is directly proportional. If there is an increase in the independent variable, then there will be an increase also the value of the dependent variable.
The Table 11 shows that R2 is 0.172 which means that the
independent variable can only explain 17.2% change of
dependent variable. This shows that the independent variable is very low influence on the dependent variable. The coefficient of determination has a positive value (+) indicates the degree of correlation of independent variables to dependent is directly proportional. If there is an increase in the independent variable, then there will be an increase also the value of the dependent variable.
The Table 12 it shows that R2 is 0.167 which means that
the independent variable can only explain 16.7% change of dependent variable. This shows that the independent variable is
Table 7: Multicollinearity testing of government performance model with reliable information system dimension (KJ6)
Model Collinearity statistics
Tolerance VIF
1 (Constant)
KP1_RS 0.865 1.156
KP2_RS 0.874 1.144
KP3_RS 0.806 1.241
PI1RS 0.837 1.194
PI2RS 0.813 1.229
PK1RS 0.806 1.241
PK2RS 0.803 1.246
PK3RS 0.764 1.309
PK4RS 0.802 1.246
Source: Results of research, processed, 2017
Table 8: Multicollinearity testing of government performance model with performance appraisal dimension (KJ5)
Model Collinearity statistics
Tolerance VIF
1 (Constant)
KP1_RS 0.865 1.156
KP2_RS 0.874 1.144
KP3_RS 0.806 1.241
PI1RS 0.837 1.194
PI2RS 0.813 1.229
PK1RS 0.806 1.241
PK2RS 0.803 1.246
PK3RS 0.764 1.309
PK4RS 0.802 1.246
Source: Results of research, processed, 2017
Table 9: Multicolinearity testing of government performance model with effectiveness dimension (KJ2)
Model Collinearity statistics
Tolerance VIF
1 (Constant)
KP1_RS 0.865 1.156
KP2_RS 0.874 1.144
KP3_RS 0.806 1.241
PI1RS 0.837 1.194
PI2RS 0.813 1.229
PK1RS 0.806 1.241
PK2RS 0.803 1.246
PK3RS 0.764 1.309
PK4RS 0.802 1.246
Source: Results of research, processed, 2017
very low influence on the dependent variable. The coefficient of determination has a positive value (+) indicates the degree of correlation of independent variables to dependent is directly proportional. If there is an increase in the independent variable, then there will be an increase also the value of the dependent variable.
5. CONCLUSION
The best local government performance is Kabupaten Empat Lawang, Prabumulih, and OKI, the lowest local government performance is Kabupaten OKUT, Lahat, and Lubuk Linggau. Financial performance which is categorized as very effective is OKI Regency and OKUT, efficient category is OI Regency, OKUS, OKUT, OKI, OKU, Four Lawang, and very economical is Muratara Regency. Affective commitment has a positive and significant impact on the performance of local government in South Sumatra. Internal control of earnings accounting system has a negative and significant effect on the performance of local government in South Sumatra. The management of regional finance has no significant effect on the performance of local government in South Sumatra.
REFERENCES
Allen, N.J., Meyer, J.P. (1990), The measurement and antecedents
of affective, continuance and normative commitment to the
organization. Journal of Occupational Psychology, 63(1), 1-18. Bastian, I. (2006), Public Sector Accounting: An Introduction. Jakarta:
Erlangga.
Bloch, C., Bugge, M.M. (2013), Public sector innovation-from theory
to measurement. Structural Change and Economic Dynamics, 27,
133-145.
Bovaird, T., Loeffler, E. (2007), Assessing the quality of local governance:
A case study of public services. Public Money and Management,
27(4), 293-300.
Bratakusuma, D.S., Solihin, D. (2002), Autonomy of Local Governance
Implementation. Jakarta: P.T. Gramedia Pustaka Utama.
Carpenter, J., Doverspike, D., Miguel, R.F. (2012), Public service
motivation as a predictor of attraction to the public sector. Journal
of Vocational Behavior, 80(2), 509-523.
Denhardt, R.B., Denhardt, J.V. (2003), The new public service: An
approach to reform. International Review of Public Administration,
8(1), 3-10.
Eckardt, S., Shah, A. (2006), Local Government organization and finance: Indonesia. Local Governance in Developing Countries. Washington, D.C.: World Bank. p233-274.
Ghozali, I. (2013), Application of Multivariant Analysis with IBM SPSS
21 Program. 7th ed. Semarang: University of Diponegoro. Gujarati, D.N. (2011). Econometrics. Berlin: Springer Reference. Halim, A. (2004), Public Sector Accounting: Local Financial Accounting.
4th ed. Jakarta: Salemba Empat.
Halim, A. (2012), Legality, Opportunities, and Constraints to Develop
an Integrated State and Regional Financial Information System
(E-SIKD). Jakarta: Indonesian Ministry of Finance.
Heyer, G.D. (2011), New public management: A strategy for democratic
police reform in transitioning and developing countries. Policing: An International Journal of Police Strategies and Management, 34,
419-433.
Hong, H.K. (1991), Management accounting in the public sector. International Journal of Public Sector Management, 4(3), 5-11. Khikmah, A. (2014), Performance measurement of local government of
lamongan regency based on value for money concept. Accountancy
Journal-Unesa, 3(1), 1. Available from: http://www.jurnalmahasiswa.
unesa.ac.id/index.php.
Made, N., Satyawati, R., Suartana, I.W. (2014), Influence of leadership
style and organizational culture on job satisfaction which impacts
financial performance. Accountancy Journal, Udayana University, 61, 2302855617.
Mahmudi, D. (2016), Analysis of Local Government Financial Statements.
3rd ed. Yogyakarta: UPP STIM YKPN.
Matari, E.M., Swidi, A.K., Fadzil, F.H. (2014), The effect of the internal audit and firm performance : A proposed research framework. International Review of Management and Marketing, 4(1), 34-41. Mihaiu, D., Opreana, A., Cristescu, M.P. (2010), Efficiency, effectiveness
and performance of the public sector. Romanian Journal of Economic
Forecasting, 13(4), 132-147.
Ministry of Republic of Indonesia. (2013), Legal Study of Local Financial
Information System. Jakarta: Ministry of Republic of Indonesia.
Mudhofar, K., Tahar, A. (2016), The influence of fiscal decentralization and performance to local government financial reporting accountability
in indonesia: The moderation effect of performance. Journal of
Accountancyand Investment, 17(2), 176-185.
Mulyadi, D. (2001), Accounting System. 3rd ed. Jakarta: Salemba Empat. Musgrave, R.A. (1959), The Theory of Public Finance: A Study in Public
Economy. New York: McGraw-Hill.
Permatasari, T.M., Didied, P. (2014), Influence of employee commitment
and internal control system on performance of local government Table 10: Government Performance Model with Reliable Information System Dimension (KJ6)
Model R R2 Adjusted R2 Standard error of the estimate Durbin-Watson
1 0.571 0.326 0.152 1.0468 2.223
Source: Results of research, processed, 2017
Table 11: Coefficient test results determination dependent variable government performance (performance
appraisal) (KJ5)
Model R R2 Adjusted R2 Standard error of the estimate Durbin-Watson
1 0.415a 0.172 −0.042 1.22691 1.729
Source: Results of research, processed, 2017
Table 12: Coefficient test result determination government performance model with effectiveness dimension (KJ2)
Model R R2 Adjusted R2 Standard error of the estimate Durbin-Watson
1 0.409a 0.167 −0.048 1.68113 1.826
of and pasuruan regency. Student Scientific Journal of Faculty of Economy Business Brawijaya University, 2(1), 1-9.
Poznanski, P.J., Bline, D.M. (1997), Using structural equation modeling
to investigate the causal ordering of job satisfation and organizational
comitment among staf accounting. Behaviour Research in Accounting, 9, 154-171.
Robbins, S.P., Judge, T.A. (2013), Organizational Behavior. Source. Edisi Indo. Vol. 40. Jakarta: Ghalia Indonesia.
Sephi, C., Darwanis. (2013), Performance accountability of government agencies. Journal of Accountancy Study and Research, 6(1), 54-63. Setyaningrum, D., Syafitri, F. (2012), Analysis of the influence of local
government characteristics on the level of financial statement
disclosure. Journal of Accountancy and Finance of Indonesia, 9(2), 154-170.
Susetyo, D. (2008), Economic development performance of regency/ city government budget(APBD) in South Sumatra. Journal of EconomicDevelopment, 6(1), 39-53.
Wicaksono, K.W. (2015), Public sector organization accountability. Journal of Public Policy and Administration, 19(1), 1-16.