1Marmara Uni 2Ministry of N Corresponden
Received: Feb doi:10.11114/j
Abstract Emotional lite quality as we people’s emot reviewed in a field of psych administered t the west of T According to The Cronbach has been calcu literacy was d Keywords: em 1. Introductio
1.1 Problem
Emotional lite transactional a states that bein by improving extensive rese arising from t knowing how interaction.” Despite the f statement emp a potential ari that are develo more appropr capacity are s able recogniz efficient way… because emot teachable conc Literature rev Pearson & Wi * An earlier v Hacettepe Uni
A Stud
Mü iversity, İstanb National Educa nce: Müge Akbbruary 1, 2016 jets.v4i5.1419
eracy is descri ll as people’s tional literacy accordance wit hological coun to 272 univers Turkey. Afterw
the results of h Alpha Coeffi ulated as 0.89 developed.
motional litera on
eracy concept analysis appro ng a literate on
our self-powe earches regard the emotion l w to manage e
fact that emoti phasizing the d ising from birt oped after birt riate as it is q structured at bi ze and underst …” Likewise, tional literacy cept than emot veals that ther ilson, 2008) m version of this iversity, Ankar
dy on Em
üge Akbağ1, Sebul, Turkey ation, İstanbul, bağ, Atatürk Ed
Accepted: U
ibed as being life quality ar in order to be th this aim. Co nseling (n=25) sity students w wards, the fin explanatory a icient is 0.80; t . In conclusion acy, scale deve
t which was f ach theoreticia n the basis of e er and life qua ding emotional ove, which ar emotions, bein ional literacy differences bet th; however, e th. Weare (200 quite contradic irth and, theref tand our self Sharp (2001) is more dyna tional intellige re exist psycho mainly based o
paper was pr ra, Turkey, on
motional L
eval Eminoğlu, Turkey ducation Facu
February 18, 2 URL: http://dx.
aware of our round us. In th e used both in
omposition stu ) regarding em who were recei
nal form whic and confirmato test-retest vali n, a reliable an elopment, relia
first mentioned an involves un emotions mean ality as well as l literacy educ re “being awa ng able to res is often used tween these co emotional litera 04), on the othe ctive to use in
fore, cannot b and other peo ) too advocate amic and mob ence.
oeducational p n emotional w
resented at the June 8-10, 20
Literacy S
Küçüktepe1, Eulty, Marmara U
2016 On doi.org/10.111
own feelings his study, the
descriptive an udy was condu motional litera
iving education ch contains 34 ory factor anal
idity which wa nd valid scale ability and vali
d in literature nderstanding, c ns to recognize s people’s life cation, claims are of one’s o store emotiona d as a synonym oncepts. Bocch
acy is a skill t er hand, propo ntelligence wo e taught. He d ople’s emotion es that the rea bile than emo programs aim wellbeing and p
e II. Eurasian E 15.
Journ I
Scale
Dev
Esra EminoğluUniversity, Ka
nline Published 114/jets.v4i5.14
in order to im aim is to dev nd experiment ucted and asse acy. Initial form
n from differen 4 items was lysis, the scale as repeated twi which can be dity
e in 1970s by controlling and e our emotions quality aroun that emotiona wn emotions, al damage an m to emotion hino (1999) me
that perceives oses using the ord because it defines emotio
nal conditions ason why emo
tional intellige ming to develo
psychological
Educational R
nal of Educatio Vo SSN 2324-805X
Published URL
velopmen
u Özmercan2adıköy, İstanbu
d: February 27 419
mprove our pe velop a Likert tal researches. essed with a g m which cons nt faculties in applied to 34 e has five dime
ice in 15 days’ used to measu
Claude Stein d managing em s in a way that nd us. Steiner ( al literacy invo being able to nd being able
nal intelligence entions that em and controls t emotional liter suggests that nal intelligenc s and to use t tional literacy ence; therefor op emotional l resilience and
Research Cong
on and Training ol. 4, No. 5; M X E-ISSN 2
by Redfame P L: http://jets.redf
nt
*ul, Turkey.
, 2016
ersonal power scale which m Related litera group of exper sists of 52 item
a university lo 45 university s ensions with 3 ’ time with 45 ure people’s em
ner (2003) wh motions. Steine we can benefi (1996, 2003), olves five dim o empathize s to develop em e; researchers motional intelli
the affective p racy concept w t social and em ce as “…the sk
this recognitio y is more pref
re, it refers to literacy (Wear d they are wide
gress that took
g Studies May 2016 324-8068 Publishing fame.com and life measures ture was rts in the ms were ocated at students. 34 items. students motional
ho was a er (2003)
it from it who did mensions, incerely, motional make a igence is processes would be motional kill to be on in an ferable is o a more re, 2004; ely used.
Matsumoto (2012) noted that programs to be prepared concerning emotional literacy have a positive impact on the prevention of children and adolescents from dropping school. Another group of researchers emphasize that emotional literacy skills influence students’ academic skills, friend relationships, mental health, social skills, forming good attitudes towards school, self-concept etc. positively (Antidote, 2003; Kandemir & Dündar, 2008). Furthermore, there are some other researches focusing on adults rather than children or adolescents arguing that emotional literacy is connected with coping behavior, self-efficacy, general and emotional wellbeing (Chan, 2008; Adeyemo, 2007; Carmeli, Yitzhak‐Halevy, & Weisberg, 2009). It can be concluded that besides emotional literacy plays a key role in order to avoid mental health problems (Killick, 2006) it is also a significant factor to build and maintain a healthy interpersonal communication. Consequently, it can be drawn that studies regarding emotional literacy have an outstanding position in terms of preventive and protective psychological counseling and guidance services.
Measuring emotional literacy correctly is an important part of the process. It was observed that in literature, emotional intelligence scales were often used in order to identify the emotional literacy levels, to investigate the relations between emotional literacy and various psychological variables and also to test the efficiency of psychoeducational programs aiming to enhance emotional literacy (e.g.; Bar-On Emotional Intelligence Quotient Inventory, Mayer Slovey Caruso Emotional Intelligence Scale) while scales measuring emotional literacy were happened to be quite limited. So as to assess emotional literacy, some researchers use checklists (Mann, 2014) while some prefer developing a scale. Suhaily and Riah (2004) choose to develop a scale whose main goal is to measure middle-school students’ emotional literacy levels. This scale comprises of five sub-dimensions which are self-regulation, internal motivation, social skill, empathy and self-awareness (Cited by Kandemir & Dündar, 2008). A recent study by Palancı, Kandemir, Dündar and Özpolat (2014) presents another emotional literacy scale which has three sub-dimensions; self-regulation, emotional awareness and social skill. It can be noted that those scales are designed to be used in school environments for students and consists of items based on educational environment and learning processes. On the other hand, in this study, the aim is to develop a Likert scale which measures young adults’ and adults’ emotional literacy on the basis of the five fundamental skills suggestions (being aware of one’s own emotions, being able to empathize sincerely, knowing how to manage emotions, being able to restore emotional damage and being able to develop emotional interaction) made by Steiner (2003) whose field of work is about developing emotional literacy in the lights of interpersonal relationships arising from love. This scale is considered to be useful for the field both for descriptive and experimental researches regarding emotional literacy.
2. Method
2.1 Participants and Procedures
As a very first step of scale development, literature regarding emotional literacy was studied in order to generate items. Afterwards, a composition study was held with a group of experts in the field of psychological counseling (n=25) in order to identify the must-have characteristics concerning emotional literacy. As a result of both of these studies, 58 items were generated in a way that items involved all dimensions of emotional literacy. Items that were generated were firstly presented to the experts in the field of psychological counseling (n=7) to be analyzed in terms of content, clarity and expression similarities. After the intended changes were made in accordance with the experts’ opinions, there left 52 statements; 34 of which presenting high tendency (+) while 18 of which presenting low tendency (-).
Initial form was applied to 281 students who were receiving education in a state university at the Marmara Region in Turkey in 2014-2015 academic year. Nine students who failed to complete the initial form as asked were excluded from the research. This study, in conclusion, was administered with 272 students.
In an attempt to analyze data and form the final scale, item analysis based upon item scale correlation and mean differences between groups and explanatory factor analysis were conducted. Items considered to be qualified according to these three techniques results were selected to the final form.
Final form was applied to 358 students who were receiving education in a state university at the Marmara Region in Turkey in 2014-2015 academic year. Students who failed to complete the final form as asked (n=3) and who could not meet the assumptions of confirmatory factor analysis (n=10) were discarded from the research. This study was administered with 345 participants.
3. Findings
3.1 Item Analysis Based upon Item Scale Correlation
Journal of Education and Training Studies Vol. 4, No. 5; May 2016
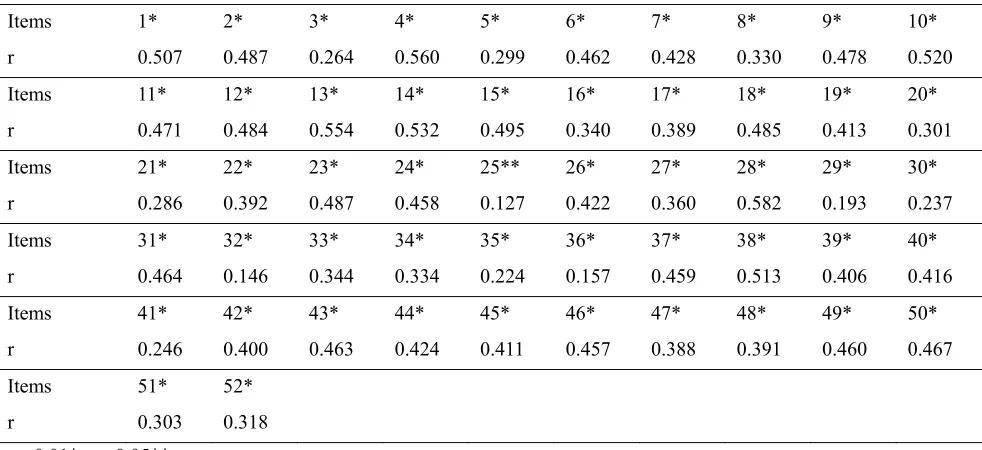
Table 1. Item Analysis Results Based Upon Item Scale Correlation
Items 1* 2* 3* 4* 5* 6* 7* 8* 9* 10*
r 0.507 0.487 0.264 0.560 0.299 0.462 0.428 0.330 0.478 0.520
Items 11* 12* 13* 14* 15* 16* 17* 18* 19* 20*
r 0.471 0.484 0.554 0.532 0.495 0.340 0.389 0.485 0.413 0.301
Items 21* 22* 23* 24* 25** 26* 27* 28* 29* 30*
r 0.286 0.392 0.487 0.458 0.127 0.422 0.360 0.582 0.193 0.237
Items 31* 32* 33* 34* 35* 36* 37* 38* 39* 40*
r 0.464 0.146 0.344 0.334 0.224 0.157 0.459 0.513 0.406 0.416
Items 41* 42* 43* 44* 45* 46* 47* 48* 49* 50*
r 0.246 0.400 0.463 0.424 0.411 0.457 0.388 0.391 0.460 0.467
Items 51* 52*
r 0.303 0.318
p< 0.01*, p< 0.05**
It can be interpreted from the Table 1 that all items in the scale measure the same construct as overall scale does. Hence, items which were utilized in the initial form are qualified enough to be a part of the final scale.
3.2 Item Analysis Based upon Mean Differences between Groups
Scores which were obtained from students’ answer were ranked in a descending order. 73 students who had the lowest scores were grouped as the lower and 73 who had the highest scores were assigned to the higher group. Afterwards, the mean score difference for each item between the lower and the higher groups were analyzed with independent samples t-test. The results are as shown in Table 2.
Table 2. Item Analysis Results Based Upon Mean Differences between Groups
Items 1* 2* 3* 4* 5* 6* 7* 8* 9* 10*
t 53.655 42.228 33.908 34.294 43.624 53.129 23.976 25.783 48.739 34.913
Items 11* 12* 13* 14* 15* 16* 17* 18* 19* 20*
t 43.102 45.025 41.828 62.138 49.350 52.881 64.750 45.694 24.667 49.040
Items 21* 22* 23* 24* 25** 26* 27* 28* 29* 30*
t 24.309 33.344 45.705 58.601 67.772 47.915 39.205 46.757 48.917 34.759
Items 31* 32* 33* 34* 35* 36* 37* 38* 39* 40*
t 61.921 34.847 28.097 49.395 46.300 40.061 48.198 37.216 34.674 41.296
Items 41* 42* 43* 44* 45* 46* 47* 48* 49* 50*
t 24.627 26.536 64.804 50.165 27.933 63.275 43.958 39.215 40.756 54.727
Items 51* 52*
t 47.348 43.741
p< 0.01**, p< 0.05*
Table 2 shows that each item on the scale is sufficient enough to discriminate between people who have the feature which is aimed to be measured by this item and who have not. Therefore, items which were utilized in the initial form are qualified enough to be a part of the final scale.
3.3 Factor Analysis
Table 3. Kaise Kaiser-Meyer
Bartlett’s Test
As shown in T which is 0.70 statistically si factor analysis 3.3.1 Explana Factor analysi First, it was d less than 0.32 differences wa excluded from Table 4. Facto
Factors To
1 6.3
2 2.9
3 2.7
4 2.0
5 1.7
When scree p awareness’ (eg second factor etc.) to peopl emotions’ (e.g the physical ‘emotional-se express my em
er-Meyer-Olkin r-Olkin Measur
t of Sphericity
Table 3, KMO 0 (Şencan, 20 gnificant at 0. s.
atory Factor An is was conduc determined tha 2, that had fa as less than 0. m the scale. Th or Analysis Res
Eigen tal Varianc % 399 18.28 961 8.45 719 7.76 036 5.81 771 5.06
plot is investig g. “I can easily
was named a e.”, “It is hard g. “I recognize
symptoms, I lf efficacy’ (e. motions becau
n (KMO) and re of Sampling
O fitness index 005; Tavşancı
.000 level. It c nalysis (EFA) cted with 52 it at which items actor loading 1 were discard e final form co sults nvalues e Cumulati % 84 18. 59 26. 68 34. 18 40. 61 45.
gated, it is cle y feel other pe s ‘social comp d for me to ap e the differenc
am often una g. “I fear that use of the disa
Barlett’s Test g Adequacy
was calculate
ıl, 2006). Bar can be conclud
tem scale in or s placed thems greater than 0 ded from the sc onstituted of 3
Va ive Total 284 6.399 743 2.961 .511 2.719 329 2.036 391 1.771 Figur ear that the sc eople’s emotio petence’ (e.g. “
pologize when ces between em aware of the I may be ridic appointment I
of Sphericity R
d as 0.771. Th rlett’s test of ded that data o
rder to identify selves under w 0.32 under m cale (Tabachni 5 items. Facto
alues Before R Variance % 18.284 8.459 7.768 5.818 5.061
re 1. Scree plot ale has five d ns”, “I am aw “I deliver posi n I do wrong. motions like lo
feelings that culous, silly et
have experie Results
X2 df p his index is gre
sphericity wa obtained from
fy the fundame which factors. more than one ick &Fidel, 20
r analysis resu
Rotation Cumulative % 18.284 26.743 34.511 40.329 45.391 t dimensions. Fi ware of how my
itive messages ”); the third f ove, hate, joy, causes them” tc. when I am
nced.”; the fif
0.77
eater than the as found to b initial form ca
ental factors re Later, items t
dimension an 001). Total 17 ults were given
Values Total Var
4.576 1 3.759 1 2.704 2.639 2.209
irst factor was y emotions aff s (admiration, factor was nam
shame etc.”, “ ”); the forth emotional.”, “ fth factor was
1
3228. 59 0.00 accepted critic be 3228.499 w
an be employe
elated to the c that had factor nd that factor items, at the e n in Table 4.
s After Rotatio riance % Cum 13.073 10.740 7.726 7.539 6.313
s named as ‘em fect other peop
compliment, med as ‘under “Even though factor was na “I am quite cau s named as ‘re
499 5 00 cal value which is ed to the
Journal of Education and Training Studies Vol. 4, No. 5; May 2016
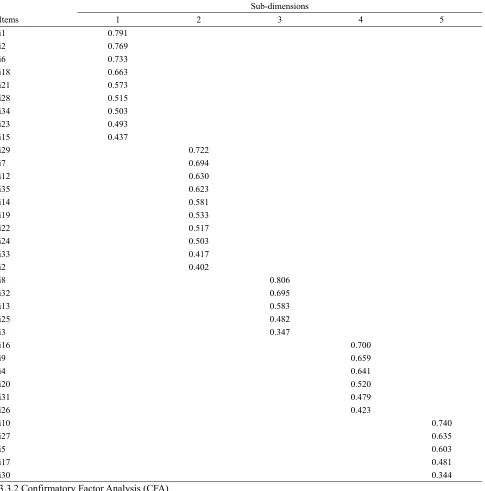
emotions’ (e.g. “I do not hesitate to show my reaction when I am angry.”, “Working under extensive pressure and stress does not affect my productivity (performance) thanks to my being nonchalant”). Table 5 shows the dimension and factor loadings of items.
Table 5. Dimensions and Factor Loadings of Items
Sub-dimensions
Items 1 2 3 4 5
i1 0.791 i2 0.769 i6 0.733 i18 0.663 i21 0.573 i28 0.515 i34 0.503 i23 0.493 i15 0.437 i29 0.722 i7 0.694 i12 0.630 i35 0.623 i14 0.581 i19 0.533 i22 0.517 i24 0.503 i33 0.417 i2 0.402
i8 0.806
i32 0.695 i13 0.583 i25 0.482 i3 0.347
i16 0.700
i9 0.659
i4 0.641
i20 0.520
i31 0.479
i26 0.423
i10 0.740
i27 0.635
i5 0.603
i17 0.481
i30 0.344
3.3.2 Confirmatory Factor Analysis (CFA)
Confirmatory factor analysis was conducted with LISREL 8.37 package program. Confirmatory factor analysis results reveal that all the items are statistically significant at 0.05 level meaning that all items (observed variables) are representing their latent variable except from item 10 under the fifth dimension. Critical value (1.96) is greater than t value calculated for item 10. Therefore, it is considered that this item failed to present its latent variable, as a result, was discarded from the model. Items (n=34) factored under five dimensions were re-analyzed.
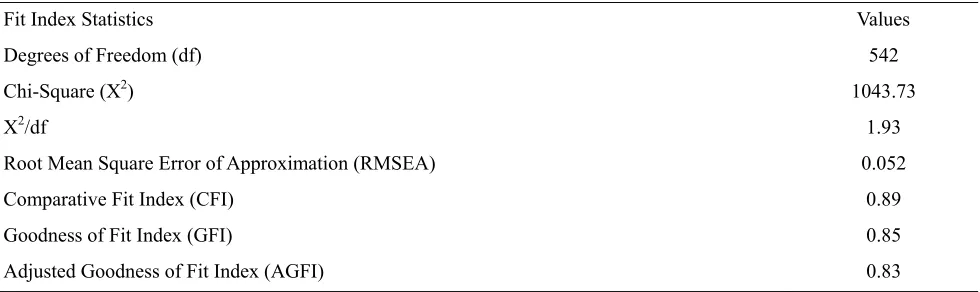
Table 6. Emotional Literacy Scale Measurement Model Fit Indexes
Fit Index Statistics Values
Degrees of Freedom (df) 542
Chi-Square (X2) 1043.73
X2/df 1.93
Root Mean Square Error of Approximation (RMSEA) 0.052
Comparative Fit Index (CFI) 0.89
Goodness of Fit Index (GFI) 0.85
Adjusted Goodness of Fit Index (AGFI) 0.83
The ratio of chi square with degree of freedom is 1043.73/542 = 1.93. This value proves that there is excellent fit (Tabachnick & Fidel, 2001) between the original variable matrix and the suggested matrix. RMSEA value which was calculated as 0.052 shows good fit for the measurement model (Hu & Bentler, 1999). However, CFI fit index which was 0.89 suggests a weak but yet non-negligible fit as the value is smaller than the critical value. GFI and AGFI fit indexes are respectively 0.85 and 0.83. Even though GFI and AGFI values are below the acceptable interval, GFI being greater than 0.85 and AGFI being greater than 0.80 propose that fit indexes are at the lower limits of model acceptance (Anderson & Gerbing, 1984; Cole, 1987; Marsh, Balla & McDonald, 1988 cited by Duyan & Gelbal, 2008; Schermelleh-Engel, Moosbrugger & Müller, 2003).
When the obtained values were compared with expected critical values, it is clear that values obtained from this study are in acceptable interval. Based on this result, it can be concluded that each factor presents the statements.
3.4 Reliability of the Scale
Cronbach alpha reliability coefficient of the scale for the first factor is 0.75; for the second factor is 0.73; for the third factor is 0.71; for the fourth factor is 0.71 and for the fifth factor is 0.72. Reliability coefficient for overall scale was calculated as 0.80. In order to figure out the test-retest validity, final form was administered to 45 people twice in 15 days’ time. The correlation between the administrations were calculated. According to the results, the correlation for the first factor is 0.71; for the second factor is 0.76; for the third factor is 0.73; for the fourth factor is 0.75 and for the fifth factor is 0.78. Validity coefficient for overall scale was determined as 0.89. This value acknowledges that the scale produces consistent results. Those findings support that the scale has a satisfactory level of reliability.
4. Discussion and Conclusion
The scale which was developed in this study and named as Emotional Literacy Scale contains “emotional awareness”, “social competence”, “understanding emotions”, “emotional self-efficacy” and “regulating emotions” sub-dimensions and 34 items. In the lights of the obtained findings, it can be concluded that Emotional Literacy Scale is a valid and reliable measurement tool. According to the explanatory and confirmatory factor analysis results, Emotional Literacy Scale is a multi-dimensional scale. This situation is consistent with the theoretical descriptions of emotional literacy in literature and also is similar with the existing scales presenting multidimensional constructs (Steiner, 2003; Mann, 2014; Palancı et al., 2014).
This scale can be used for the researches which are designed for young adults and adults to investigate the relationship between emotional literacy and various variables and also to test the psychoeducational programs which are developed to enhance emotional literacy. As it is developed in order to measure the young adults’ and adults’ emotional literacy skills, it is also suggested that appropriate versions of the scale for different age groups should be developed.
References
Adeyemo, D. A. (2007). Moderating influence of emotional intelligence on the link between academic self-efficacy and achievement of university students. Psychology Developing Societies, 19(2), 199-213.
http://dx.doi: 10.1177/097133360701900204
Antidote, J. P. (2003). The emotional literacy handbook: Promoting whole-school strategies. London: David Fulton Publishers.
Bocchino, R. (1999). Emotional literacy: To be a different kind of smart. Thousand Oaks, CA: Sage Publications. Carmeli, A., Yitzhak‐Halevy, M., & Weisberg, J. (2009). The relationship between emotional intelligence and
Journal of Edu
http://dx Chan, D. W. teachers
Psycholo
Duyan, V., & Barnett li Hu, L. T., & B
versus http://dx. Kandemir, M literacy a 83-90. Killick, S. (20 Mann, D. (20
doctoral Matsumoto, R
emotiona requirem Palancı, M., güvenirli Sciences, Pearson, M., wellbeing and Heal Schermelleh-E significan
Şencan, H. (20 Sharp, P. (200 Steiner, C. M
Transact
Steiner, C. M. Tabachnick, B Tavşancıl, E. ( Weare, K. (20
This work is l
ucation and Tr
.doi.org/10.110 (2008). Emot
in Hong K
ogy, 28(4), 397 Gelbal, S. (20 iking of childr Bentler, P. M. new alternat .doi:10.1080/1 ., & Dündar, and emotiona 006). Emotiona
14). A mixed m
dissertation). U R. I. M. (2012)
al literacy.A re
ments for the de Kandemir, M ik çalışması. [V
,11(1), 481-49 & Wilson, H g and resilienc
lth,4(1), 1-19. Engel, K., Moo
nce and descri 005). Sosyal ve
01). Nurturing
M. (1996). Emo
tional Analysis
. (2003). Emot
B. G., & Fidel, (2006). Tutum
004). Developin
icensed under
raining Studies
08/026839409 ional intellige ong. Educatio
7-408. http://dx 008). Barnett ç ren scale to Tu
(1999). Cutof tives. Structu
107055199095 H. (2008). D lly literate lea
al literacy at th methods evalu
University of N ). Emotional li
esearch paper
egree of master ., Dündar, H. Validity and re 94. http://dx.do H. (2008). Us ce improving .
osbrugger, H., iptive goodnes
e davranışsal ö emotional lite
otional literacy
s Journal,26(1
tional literacy:
L. S. (2001).
ların ölçülmes ng the emotion
a Creative Co
910922546 ence, self‐eff
onal Psycholo
x.doi:10.1080/0 çocuk sevme ö urkish]. Eğitim
ff criteria for f
ural Equatio
40118 Duygusal okury
arning environ
he heart of the ation of the em
Nottingham, U iıteracy in Sch
r presented to t
r of arts in sch , & Özpolat, eliability study oi: 10.14687/ij sing expressiv therapeutic ou , & Müller, H. s-of-fit measu
ölçümlerde gü racy. David Fu y training: The 1), 31-39. http:
: Intelligence w Using multivar si ve SPSS ile v nally literate sc
ommons Attrib
ficacy, and cop
ogy: An Inter
014434107016 ölçeğini Türkç
ve Bilim, 148( fit indexes in c
on Modeling
yazarlık ve du nments]. Saka school ethos.
motional litera
United Kingdom hools, dropout
the faculty of A
hool counseling A. R. (2014) y of Emotiona
hs.v11i1.2806 ve counselling utcomes with e
(2003). Evalu ures. Methods o üvenirlik ve geç
ulton Publishe e application o
//dx.doi: 10.11
with a heart. F
riate statistics veri analizi. (Ü
chool. London
ution 3.0 Licen
ping among C
rnational Jou
668372 çeye uyarlama (33), 40-48. covariance stru
g: A Multid
uygusal okury
arya Üniversit
Thousand Oak
acy support ass
m.
prevention in
Adler graduate
g.
). Duygusal o al Literacy Sca 6
tools to enh expressive the uating the fit o
of Psychologic çerlik. Ankara ers.
of transactiona 177/036215379
awnskin, CA:
. (4th ed.). MA Üçüncü baskı). n: Sage Publica
nse.
Vo
Chinese prospe
urnal of Expe
a çalışması. [T ucture analysis
disciplinary J
yazar öğrenme
tesi Eğitim Fa
ks, CA: Sage P
sistant (ELSA)
Latino middle
e school. In pa okuryazarlık ö ale]. Internatio
hance emotion erapies. Couns
f structural equ
cal Research O
: Seçkin Yayın
al analysis to t 9602600107
Personhood P A: Allyn & Bac
Ankara: Nobe ations.
l. 4, No. 5; M
ective and in
erimental Edu
he adaptation s: conventiona
Journal 6(1) e ortamları [Em
akültesi Dergi
Publications.
) project (Unp e school studen
artial fulfillme ölçeğinin geçe
onal Journal of
nal literacy, em
selling, Psycho
uation models
Online, 8(2), 23 ncılık.
the study of e Press.
con, Inc. el Yayın Dağıtı
May 2016 ‐service ucational study of al criteria , 1-55. motional
isi, (16),
published nts using nt of the erlilik ve
f Human
motional
otherapy,
: tests of 3-74.
motions.