Issues
ISSN: 2146-4138
available at http: www.econjournals.com
International Journal of Economics and Financial Issues, 2017, 7(1), 524-529.
Analysis of Operating Cash Flow to Detect Real Activity
Manipulation and Its Effect on Market Performance
Andreas*
Department of Accounting, Faculty of Economics, Universitas Riau, Indonesia. *Email: [email protected]
ABSTRACT
Deviating from normal business practices to manipulate reported income is defined as real earnings management (Roychowdhury, 2006). A firm can alter the level of accruals to obtain the desired level of a high stock price and/or earnings. The desire to achieve a high stock price and/or earnings to meet the earnings benchmark induces corporate managers to engage in earning management, inflating current earnings at the expense of the firms’ economic values. To meet a certain earnings target, managers can wait until the year-end to use discretionary accruals to manage reported earnings. However, this strategy runs the risk that the amount of earnings that needs to be manipulated is greater than the available discretionary accruals because the discretion on accruals is bounded by GAAP (Barton and Simko, 2002). Real activities manipulations are less subject to this constraint. The focus of this study is the real activities manipulations because the auditors and regulators are less likely to be concerned with such behaviors. The results suggest that firms are likely to engage in real activity manipulation through operating cash flow. Further analysis reveals that firms more likely to engage in real activity manipulation have higher market performance than do their counterpart.
Keywords: Operating Cash Flow, Real Activity Manipulation, Market Performance
JEL Classifications: M02, M4, M41
1. INTRODUCTION
Managers perform earning management due to information asymmetry between management and owners of the company.
The existence of this information asymmetry condition provides greater flexibility and opportunity to managers for misleading earnings reporting to users of financial statements. Both the owner
as a principal and management as an agent have personal interests
that may pose a conflict of interest. In addition to the interests of
the owner of the company that must be met, managers also have personal goals that may be different from the owner.
Healy and Wahlen (1999) documented two forms of earnings
management. The first form involves choosing appropriate accounting methods to reach desired levels of earnings and the second uses the timing and/or magnitude of operating decisions
to reach desired earnings (i.e., real activities manipulation). The
latter, which, merely contributes to operating decisions, may be
harder for an outsider to observe (Schipper, 1989) and is unlikely
to be judged violations of securities law.
According to Roychowdhury (2006), “Real activity manipulation is defined as departures from normal operational practices, motivated by managers’ desire to mislead at least some stakeholders into believing certain financial reporting goals
have been met in the normal course of operations.” Certain methods for manipulating real activities, such as sales promotions using discounted price and/or a discretionary
expenditures reduction, are optimal given certain economic
circumstances.
Previous studies on the real activities manipulation have been
conducted by several researchers. Gunny (2009) describes four
techniques in real activities manipulation, namely, reducing
discretionary expenses of research and development, reducing discretionary expenses of sales, administration and general affairs, applying fixed assets sales timing with the aim to increase profits,
and giving price discounts or waivers of credit to increase sales
or reduce production costs. Roychowdhury (2006) stated that real activities are manipulated through operating cash flow, production
Oktorina and Hutagaol (2008) discusses the manipulation of real
activities and its impact on market performance. The impact of
real activities manipulation through cash flow from operation on market performance is difference, which is the company’s
market performance that allegedly tends to perform real activities
manipulation through cash flow from operation is higher than the company’s market performance that allegedly tends not to perform real activities manipulation through cash flow from operation.
Roychowdhury (2003) detects abnormally low cash flow from
operations and abnormally high production costs for companies
that report small positive profits at the annual level. The evidence is consistent with firms trying to increase reported annual earnings
beyond zero by giving price discounts to boost sales temporarily and by overproduction. Another evidence suggests that some of
these firms reduce discretionary expenses to report higher margins.
The focus of this paper is the analysis of cash flow from operations
to test whether management undertake real activities manipulation
and its impact on company market performance. It is expected that this paper be useful for studies related to the cash flow because cash flow statement is significant to management for planning
the proper cash and maintaining the proper match between cash
inflows and outflows.
Our findings are consistent with the findings of the studies
conducted by Roychowdhury (2003) and Oktorina and Hutagaol (2008) showing that the company likely to manipulate real activities through cash flow operations have abnormally lower cash flows operating activities than it should be. The company’s
market performance that allegedly tends to perform real activities
manipulation through cash flow from operation is higher than the company’s market performance that allegedly tends not to perform real activities manipulation through cash flow from operation.
The paper proceeds as follows. In Section 2, the authors review the literature and empirical research conducted on both real activities
manipulation through cash flow from operation and company’s
market performance. In Section 3, the authors develop hypotheses the
real activities manipulation can be detected through cash flow from
operating activities; LQ-45 listed companies likely to manipulate the
real activities through cash flow from operating activities tend to have
higher market performance than companies likely not to undertake. In Section 4, the authors introduce the types of data and models used in this paper. Section 5 presents results and interpretation. Section 6 contains the conclusions of this paper and the implications of the evidence and potential areas for further research.
2. LITERATURE REVIEW
2.1. Signaling Theory
Signaling theory is useful for describing behavior when two parties
(individuals or organizations) have access to different information.
Typically, one party, the sender, must choose whether and how
to communicate (or signal) that information, and the other party, the receiver, must choose how to interpret the signal (Connelly, 2011). Signaling theory states that company’s executives who have
better information about the company are encouraged to provide
this information to prospective investors in which the company can enhance corporate value through its reporting by sending a signal through its annual report. The information submitted by the manager about the good condition of the company through
the financial statements is a signal that the company has done
its operations well. Good signal will either be responded well by
other parties (Scott, 2009).
2.2. Earnings Management
The main objective of firms is to maximize shareholders’ value by exploiting the assets acquired by equity capital and debt. To
raise capital, shareholders should be incentivized to invest, which
only occurs if they expect positive future firm performance. It is therefore in the firm’s interest to report positive earnings, positive earnings growth and to meet analysts’ forecasts in order to acquire capital (Degeorge et al. 1999). Scott (2009. p. 403) states that
earnings management is the choice by a manager of accounting
policies to achieve some specific objectives.
Since earnings are composed of cash flow from operations and accruals, firms have two options to manage earnings. First, firms
can manage earnings through deviation from the normal business
operations, so that the cash flow from operations will be affected.
Deviating from normal business practices to manipulate reported
income is defined as real earnings management (Roychowdhury, 2006). Second, a firm can alter the level of accruals to obtain the desired level of earnings. Managers use judgments in financial
reporting which can be defined as accrual-based earnings
management (Healy and Wahlen, 1999).
2.3. Earnings Management through Real Activities Manipulation
Oktorina and Hutagaol (2008) states that real activities
manipulation is manipulation done by management through daily activities of the company during the current accounting period.
Roychowdhury (2006) describes the definition of real activities
manipulation as differences in operating practices carried out with normal operating practices, which are motivated by the desire of management to provide any wrong insight to the shareholders so
that they believe that certain financial reporting objectives have been achieved according to the company’s normal operating practices. According to Roychowdhury (2006), techniques which
can be performed in real activities manipulation include sales management, overproduction, and reduction in discretionary
expenses.
2.4. Operating Cash Flow and Real Activities Manipulation
Operating cash flow is cash flow from the principal
revenue-producing activities, which involve cash effect of transactions that enter into the determination of net income in the income statement.
Operating cash flow is used to determine whether the operation of the company is sufficient to repay short-term debt and to pay the costs related to the operation of the company. Operating cash flow shows cash receipts and expenditures of the company’s operations.
Sales management is the real activities manipulation techniques
by giving discounts and credit term payment for goods sold. This
will increase sales, which in turn makes the profits generated by
the company higher, but the opposite condition affects the cash
flow statement, primarily on cash flow of operational activities. Cash flow of operational activities of the company will be lower
than if the company is selling normally. The company receives this small cash because of an increase in accounts receivable due to the company selling on credit and the discounted price that requires the company to cut the price of the sale. Therefore, the
cash received by the company is smaller than normal sale (Ji’ah and Pujiati, 2013).
2.5. Operating Cash Flow and Market Performance
Abnormal return is one of the indicators used to look at the market
performance of the company. Jogiyanto (2008. p. 549) states that abnormal return is the excess of the return that is actually going
to normal return. Abnormal return is positive if the actual return is
greater than the expected return while abnormal return is negative if the actual return is smaller than the expected return.
Market performance is viewed from a long-term stock return. Market performance is a performance measure based on the
ability of the company doing the return on company’s long-term investment or stock returns. High corporate profit will attract investors to buy company’s shares. Higher demand for the stocks will lead to the company’s higher stock price. The high price of company’s stock makes the rate of return on the stock also high, thus indicating high company’s market performance.
Bowen et al. (1987) found that the operating cash flow has
additional information other than earnings forwarded to the market.
Operating cash flow and aggregate accruals have a relationship with abnormal return (Rayburn, 1986) as well as components of operating cash flows have a relationship with return (Livnat and Zarowin, 1990). The Impact of operating cash flow on the market performance has been investigated by Diana and Kusuma (2004) who found that operating cash flow is important in explaining
returns of securities.
2.6. Free Cash Flow (FCF) Theory
FCF is cash flow in excess of that required to fund all of a firm’s
projects that have positive net present values when discounted at the relevant cost of capital. Such FCF must be paid out to
shareholders if the firm is to be efficient and to maximize value
for shareholders. Payment of cash to shareholders reduces the
resources under managers’ control, thereby reducing managers’
power and potentially subjecting them to the monitoring by the
capital markets that occurs when a firm must obtain new capital.
Financing projects internally avoids this monitoring and the possibility that funds will be unavailable or available only at high
explicit prices (Jensen, 1987).
Positive FCF indicates that the company is generating more cash than is used to run the company and reinvest to grow the business. A negative FCF number indicates the company is not able to
generate sufficient cash to support the business. FCF is similar to
earnings for a company without the more arbitrary adjustments made in the income statement. As a result, FCF can help measure
the performance of a company in a similar way to looking at the net
income line. However, the cash flow statement is a better measure
of the performance of a company than the income statement.
3. HYPOTHESES DEVELOPMENT
To avoid reported losses in order to get the bonus and good performance assessment for both companies and individuals within the company real activities are manipulated. There are many
factors affecting the reported earnings used in practice in profit and loss accounts, for example by increasing sales by offering
rebates, allowing low-interest credit sales, and providing soft loan. In this way, the reported sales increase and accordingly, the reported earnings increase in the period.
These real activity manipulations also have an impact on reported
cash flow in the same period by offering discounts, reduced advertising expenses, reduced sales expenses, overproduction, and reduced research and development expenses. As a result, the cash flow from operating activities is lower than normal condition
or abnormally low.
Cash flow from operating activities will be used to determine
whether the company attempts to manipulate the real activities,
as shown in the mean of “abnormally low” operating cash flow (below zero). The zero mean of ‘abnormal’ operating cash flow implies the same actual cash flow and normal cash flow.This leads
to the following hypothesis:
H1: The real activity manipulation can be detected through cash
flow from operating activities.
Cash flow from operating activities had an impact on market performance (Livnat and Zarowin, 1990). Oktorina and Hutagaol (2008) argue that the real activities manipulation by company
through cash flow from operating activities has significant
difference in mean of abnormal cash flow operations. The impact of real activities manipulation through cash flow of operating
activities on market performance is different. The market performance of companies that allegedly tend to manipulate the
real activities through cash flow of operating activities is higher
than the market performance of companies that allegedly tend
not to manipulate the real activities through cash flow operations because high profit is one of good performance indicator for company that respond to the rise in company’s stock prices. This
leads to the following hypothesis:
H2: Companies likely to manipulate the real activities through
cash flow from operating activities tend to have higher market
performance than the counterpart companies.
4. DATA AND ESTIMATION MODELS
4.1. Data Introduction
capitalization of 45 most liquid and large capitalized being an indicator of liquidity. LQ-45 uses 45 stocks selected based on the
liquidity stock and adjusted every 6 months (every early February and August). Thus, the stocks contained in the index will always change. LQ-45 index consists of 45 stocks that have been chosen
through a variety of selection criteria, which will consist of stocks
with liquidity and high market capitalization. Based on the sample criteria 25 firms were selected as the sample, thus there are 100 firm year observation. The authors use these samples to test the
hypotheses in this paper.
4.2. Estimation Models
Before hypothesis testing, the authors will make regression
analysis to determine the cash flow from normal operating activities. To estimate the model, the authors use Roychowdhury
(2003) model shown below:
CFOt/At−1=α(1/At−1)+β1(St/At−1)+β2(St−1/At−1)+ε
CFOt/At−1: Cash flows from operating activities in year t scaled by total assets at year t−1
α(1/At−1): Intercept divided by total assets at year t−1 in order the
cash flow from operating activities do not have a value of 0 when sales and sales lag is 0
(St/At−1):Net sales in year t divided by total assets at year t−1 (St−1/At−1): Net sales in year t-1 divided by total assets at year t−1.
To calculate the “abnormal” CFO for every firm-year we used the “actual” CFO minus the “normal” CFO calculated using estimated coefficients from the corresponding industry-year model and the firm-year’s sales and lagged assets.
To test the first hypothesis which states the real activity
manipulation can be detected through cash flow from operating activities. The real activities manipulation through cash flow from operating activities, the mean of “abnormal” operating cash flow below 0, determined by the mean and the significance of “abnormal” CFO. If the mean of “abnormal” CFO of all samples were below 0 and significant, it can be said that the companies have
made the real activities manipulation through CFO. Otherwise, if
the mean of “abnormal” CFO is above 0 it means that there is no
real activities manipulation by the companies through CFO. The
mean of “abnormal” CFO resulted from descriptive statistics and the significance level was tested using one samples t-test.
To test the second hypothesis which state that companies likely to
manipulate the real activities through cash flow operating activities
tend to have higher market performance than the counterpart
companies using two independent samples test. Proxy for market
performance is FCF as fundamental indicator for most investors. FCF formula is shown below:
FCF=CFO−(net capital expenditures+change in working capital)
CFO: Increase or decrease in cash flow from operating activities
Net capital expenditure: Ending balance of fixed assets - beginning balance of fixed assets
Change in working capital : Working capital at year-end - working capital at beginning year.
5. EMPIRICAL RESULTS AND
INTERPRETATION
5.1. Descriptive Statistics
As mentioned above the “abnormal” operating cash flow can be
used to detect real activity manipulation by management. The
“abnormal” operating cash flow is calculated with the “actual” operating cash flow minus the “normal” operating cash flow. The “normal” operating cash flow can be calculated using a regression model advanced by Roychowdhury (2003). Table 1 below shows the results of the descriptive statistics of the variables used to
calculate “normal” operating cash flow:
Table 1 presents the results of descriptive statistics. The mean of
operating cash flow is 63.94% relative to total assets. The median is 0.451328 and standard deviation is 0.877970. The mean of sales at t period is greater than the sales at t−1 period 16% relative to total assets. The median of sales at t period is 0.508399 and the sales period t−1 is 0.374394. Subsequent regression coefficients for calculating the ‘normal’ operating cash flows are presented
by Table 2.
Table 2 shows that the two sales variables are statistically
significant, so the coefficient can be used to estimate the “normal” operating cash flow. Furthermore, the “actual” operating cash flow minus the “normal” operating cash flow gives ‘abnormal’ operating cash flow.
Descriptive statistics of “abnormal” operating cash flow (ABN_ CFO) and FCF (FCF) are presented on Table 3.
Table 3 presents the results of descriptive statistics. The mean
of “abnormal” operating cash flow is −7.4861. The median is −52.8216 and standard deviation is 934.7154. The mean, median, and standard deviation of FCF respectively are 38.9375, −1.1992, and 681.5543. The mean of “abnormal” operating cash flow of −7.4861 indicates that the company had manipulated the real activities. Roychowdhury (2003) argues that companies likely
to manipulate do the real activities show lower of operating
cash flow.
Table 1: Descriptive statistics variables used for estimating “normal” operating cash flow
Variables Mean Median Maximum Minimum Standard deviation CFOt/At−1 0.639409 0.451328 8.055740 0.082647 0.877970
1/At−1 0.000001 0.000000 0.000008 0.000000 0.000000 Salest/At−1 0.718454 0.508399 8.922963 0.095011 0.972373
Salest−1/At−1 0.556479 0.374394 6.451829 0.041962 0.710912
Table 2: Coefficients regression for “normal” operating cash flow
Variables Coefficients P
Constanta 0.000299 0.999
Salest/At−1 0.951 0.000
Salest-1/At−1 0.968 0.000
However, to know whether the mean of “abnormal” operating cash flow is statistically significant the one sample t-test was used. The
results are shown in Table 4.
Table 4 presents the probability (P-value) of ABN_CFO is 0.039 that is significant at 5%. Therefore, manipulation of real activities can be detected through cash flow from operating activities.
Descriptive statistics for the market performance in this case is represented by the FCF for the entire sample likely to manipulate
real activities through cash flow from operating activities and likely
not manipulate real activities can be seen in Table 5.
As we see in Table 5 above the mean of companies likely to undertake manipulation is greater than the mean of companies
likely not undertake manipulation (955.1811 > 565.8051). Thus,
the market performances of companies that likely undertake real manipulation through operating cash flow are different from companies that likely do not undertake. Further testing to ensure whether the mean difference between companies likely to undertake manipulation and companies likely not to undertake
manipulation is different significantly, it can be seen in Table 6.
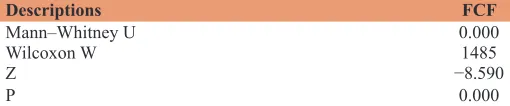
Table 6 shows the P = 0.000, which implies that market performance
of likely undertake manipulation companies and likely not
undertake manipulation companies are significantly different. In
this case, the market performances of likely undertake manipulation companies are higher than likely not undertake manipulation companies. Therefore, these results are consistent with hypothesis
H2. It is understood that in a way manipulation of the real activities
could reach a certain profit target at a certain period, which in turn would increase the company’s market performance as reflected by the increase in the company’s stock price so that more and more
managers have an incentive to manipulate the real activities.
6. CONCLUSION AND FUTURE RESEARCH
This study examines whether operating cash flow could detect the
real activity manipulation and its effect on market performance.
Our study finds evidence consistent with Roychowdhury (2003) and Oktorina and Hutagaol (2008) in that there is a significant mean difference in “abnormal” operating activities cash flow. In other words, the operating activities cash flow might be used to
detect real activities manipulation.
Further analysis reveals that the effect of real activities
manipulation through operating activities cash flow on the market
performances is different significantly. Companies likely to undertake the real activities manipulation will have higher market performances than companies likely not to undertake.
The findings have implications for investors, auditors and
regulators, respectively. Investors should realize that firms that face financial distress or high industry competition might manage
earnings to meet short-term targets. Therefore, it is recommended
to analyze the operating activities cash flow thoroughly before investing in a firm. Furthermore, auditors should be more skeptical when auditing a firm that faces high industry competition and financial distress as it is likely that the firm applies real earnings
management. Regulators should increase the regulations in order
to keep these firms from applying real earnings management.
An important and very interesting issue for further research is to use the categories in the components of operating activities cash
flow in order to see the impact of the components in the cash flow
of operating activities on the market performance. Otherwise, it
can use proxy cumulative abnormal return as a proxy for market
performance.
Table 3: Descriptive statistics of ABN_CFO and FCF
Variables Mean Median Maximum Minimum Standard deviation
ABN_CFO −7.486140 −52.821643 9358.967205 876.197918 934.715451
FCF 38.937599 −1.199245 6583.872590 861.880240 681.554371
FCF: Free cash flow
Table 5: Descriptive statistics for the market performance of companies that likely undertake manipulation of real activities through cash flow from operating activities and companies likely not undertake
Likely undertake manipulation=54’s Likely not undertake manipulation=46’s
Variable Mean Median Standard deviation Mean Median Standard deviation
FCF 955.1811 247.0357 1,602.6589 565.8051 355.0426 9,581.2833
FCF: Free cash flow
Table 6: The statistics result on market performance between the companies likely undertake manipulation and the companies likely not to undertake manipulation
Descriptions FCF
Mann–Whitney U 0.000
Wilcoxon W 1485
Z −8.590
P 0.000
FCF: Free cash flow
Table 4: The results of first hypothesis testing
Variable Mean P Explanation
ABN_CFO −7.486140 0.039* H1 be accepted
REFERENCES
Barton, J., Simko, P. (2002), The balance sheet as an earnings management constraint. The Accounting Review, 77, 1-27.
Bowen, R.M., Burgstahler, D., Daley, L.A. (1987), The incremental information content of accrual versus cash flows. The Accounting Review, LXII(4), 723-747.
Connelly, B.L. (2011), Signaling theory: A review and assessment. Journal of Management, 37(1), 39-67.
Degeorge, F., Patel, J., Zeckhauser, R. (1999), Earnings management to exceed thresholds. Journal of Business, 72(1), 1-33.
Diana, S.R., Kusuma, I.W. (2004), The influence of contextual factors on the usability earnings and operating cash flows in explaining stock returns. Indonesian Journal of Accounting Research, 7(1), 74-93. Gunny, K.A. (2009), The relation between earnings management using
real activities manipulation and future performance: Evidence from meeting earnings benchmarks. Contemporary Accounting Research, 27(3), 855-888. Available from: http://www.Ssrn.Com.
Healy, P., Wahlen, J. (1999), A review of the earnings management literature and its implications for standard setting. Accounting Horizons, 13(4), 365-383.
Jensen, M.C. (1987), The Free Cash Flow Theory of Takeovers: A Financial Perspective on Mergers and Acquisitions and the Economy. “The Merger Boom”, Proceedings of a Conference
Sponsored by Federal Reserve Bank of Boston. p102-143. Ji’ah, A., Pujiati, D. (2013), The differences in dividend payout ratio and
market performance of companies that perform and do not perform real activities manipulation. The Indonesian Accounting Review, 3(2), 121-132.
Jogiyanto, H. (2008), Teori Portofolio dan Analisis Investasi. 5th ed. Yogyakarta: BPFE Yogyakarta.
Livnat, J., Zarowin, P. (1990), The incremental information content of cash flow components. Journal of Accounting and Economics, 13(1), 25-46. Oktorina, M., Hutagaol, Y. (2008), Analysis Cash Flows Operating
Activities in Detect Real Activities Manipulation and their Impact to Market Performance. National Symposium on Accounting XI, Pontianak, Indonesia.
Rayburn, J. (1986), The association of operating cash flow and accruals with security returns. Journal of Accounting Research, 24, 112-133. Roychowdhury, S. (2003), Management of Earnings through the
Manipulation of Real Activities That Affect Cash Flow from Operations, Working Paper, Sloan School of Management MIT. Roychowdhury, S. (2006), Earnings management through real activities
manipulation. Journal of Accounting and Economics, 42(3), 335-370. Schipper, K. (1989), Commentary on earnings management. Accounting
Horizon, 3(4), 91-102.
Scott, W.R. (2009), Financial Accounting Theory. 5th ed. Toronto, Canada: