ISSN: 2374-2380 (Print), 2374-2399 (Online) Copyright © The Author(s). All Rights Reserved. Published by American Research Institute for Policy Development DOI: 10.15640/jpbs.v7n1a3 URL: https://doi.org/10.15640/jpbs.v7n1a3
A Meta-Analysis and Quality of High Probability Request Sequence Studies for Improving
Youth Complianceand Persistence
John W. Maag
1, Ph.D
Abstract
The purpose of this meta-analysis was to conduct a systematic review of the literature on the effectiveness and quality of studies using high probability (high-p) request sequences to improve compliance and persistence in children and adolescents. Included studies had to use high-p request sequences (e.g., ―get a drink of water‖ then ―open your math book to page 34‖) and not high-p task sequences (e.g., easy math problems followed by difficult math problems but with the same direction for both). Three effect sizes standard mean difference (SMD), improvement rate difference (IRD), and Tau-U were computed on the 14 included studies. Study quality was assessed by using the Council for Exceptional Children’s (CEC) 2014 eight quality indicators made up of 22 items. Results indicated high-p and low-p request sequences were moderately to highly effective. Study quality was only in the moderate range. Implications for practice are discussed. Noncompliance and failure to persist completing tasks are problems many children display depending on the context, content, and type of direction (Maag, 2018a). These problems are exacerbated for students with emotional and behavioral disorders (EBD), autism spectrum disorder (ASD), intellectual disabilities, and developmental disabilities (e.g., Humm, Blampied, & Liberty, 2005; Kelly & Holloway, 2015; Planer, Defar, Progar Reeve, & Sarokoff, 2018; Sanchez-Fort, Brady, & Davis, 1995; Vostal & Lee, 2011). Common approaches for dealing with behaviors that make up noncompliant response classes are rearranging antecedents, various schedules of differential reinforcement, and punishment techniques (e.g., Hagopian & Thompson, 1999; Kern, Childs, Dunlap, Clarke, & Falk, 1994; Matson, Dixon,& Matson, 2005; Olmi, Sevier, & Nastasi, 1997; Weston, Hodges, & Davis, 2018).
Keywords: high-p low-p request sequences, meta-analysis, study quality, behavioral momentum, quality indicators
Foundational Precises
A fourth approach is based on the behavioral principle of momentum of compliance which describes two independent dimensions of behavior: (a) rate of responding established and maintained by contingencies of reinforcement and (b) resistance to change when responding is in some way challenged or disrupted. The goal is to establish desirable behaviors that persist through changes in contingencies from external to natural reinforcement. The process begins with ―momentum‖ being a type of discriminated operant that follows a fairly classic A-B-C model (A=antecedent, B=identified response class, C=contingencies of reinforcement). It proceeds when a teacher uses a multiple schedule of reinforcement to present two or more distinctive stimuli successively in regular or irregular alteration for predetermined durations. Nevin (1996) first described behavior momentum as analogous to physical mass in which velocity and resistance to disruption (i.e., persistence) is related to behaviors with a high likelihood of enduring over time. Typical experimental analyses of resistance to disruption involved arranging different degrees of reinforcement andusing variable interval schedules in which acquired reinforcer rates are independent of response rates(Mace & Nevin, 2017).
1 Department of Special Education and Communication Disorders, 202 Barkley Memorial Center, University of
The goal is to improve response strength. A strong response is one with a high probability of being displayedunder certain circumstances(Killeen & Nevin, 2018). Alternative reinforcement both interrupts target responding while simultaneously strengthening the target response throughrespondent conditioning (Fisher et al., 2018).
Momentum of Compliance Techniques
There are threedifferent types of techniques that fall under momentum of compliance principle. First, theinterspersalmethod involves embedding easier work material within an assignment or task. For example, Banda and Kubina (2006) increased compliance for a participant to complete three-digit by three-digit addition problems by having a stack of 10 cards in a sequence of two easy problems and one difficult problem. The second approach involves a high probability (high-p) task sequence. This approach is similar to the interspersal method except the high-p sequence typically appears before any low-p sequencebut do not alter the specific instruction. For example, Ewry and Fryling (2016) wanted to increase the acceptance of different food with an adolescent with autism by first giving him high-p foods followed by low-p foods, but the request was the same in each condition: ―take a bite.‖ The third approach is high-p request sequences. In this approach, a child is given several verbal directions that have a high probability of compliance (e.g., ―put your reading book away,‖ line up for lunch,‖ get out a piece of paper and draw,‖ get a drink of water,‖ ―talk to a classmate‖). The idea is to build compliance momentum before presenting the low-p
request sequence (e.g., ―stop talking to James,‖ ―get out a pencil for the spelling test,‖ ―raise your hand and wait to be called on,‖ ―open your math book to page 42,‖ ―begin writing answers‖).
Arguably, the first study to appear in the literature was conducted by Mace et al. (1988) 30 years ago. Participants were two men with a moderate intellectual disability and two men with a severe intellectual disability. Five experiments were conducted in which observers recorded compliance, compliance latency, and task duration during two 15-minute sessions. Participants received a command to engage in three or four high-p directions immediately followed by a low-p direction. All commands either required participants to either ―do‖ a behavior or ―don't‖ engage in a behavior. Results indicted compliance to low-p directions increased, compliance latency decreased, and duration engaging in tasks (specified in the low-p directions) increased.
Previous and Current Reviews
There have been several previous literature reviews that have included studies from the three categories that fall under momentum of compliance.However, two were published before the Horner et al. (2005) quality indicators for single case research design (SCRD) studies and PRISMA (Liberati et al., 2009) guidelines for systematic reviews were published (Banda, Neisworth, & Lee, 2003; Killu, 1999), and only one of those calculated effect sizes (Lee, 2005).There was one previousreview since 2005 conducted by Brosh, Fisher, Wood, and Test (2018), but they used the now-dated Horner et al. quality indicators instead of the more recent Council for Exceptional Children’s (CEC) 2014 eight quality indicators, and this review did not calculate effect sizes.
There is a current meta-analysis of high-p request sequences that also examined study quality using the CEC criteria (Common, Bross, Oakes, Cantwell, Lane, & Germer, 2018). They reviewed 21 studies and concluded that 16 met or exceeded 80% criterion for quality. However,they included both high-p request sequences and high-p task sequences (i.e., different difficulty tasks but the same verbal direction). However, no meta-analysis has reviewed only high-p request sequences and examined their study quality. A systematic review of this type would add greatly to the extant literature on the momentum of compliance. The reason is because there has been recent and increased attention on researchers providing teachers with low-intensive strategies for enhancing student success both academically and behaviorally (Mooney & Ryan, 2018). Low-intensity interventions are those that are simple, clear, and easy to implement—they have high social validity. High-p request sequences represents on such technique (Bross, Common, Oakes, Lane, Menzies, & Parks Ennis, 2018).
Method
A systematic search was performed to identify the extent research regarding the use of behavioral momentum (i.e., high probability command sequences) results in increased compliance and persistence to tasks. The search methods were consistent with the 12-item PRISMA statement for reporting meta-analyses (Liberati et al., 2009). The purpose was to ensure clarity and transparency of conducting systematic reviews.
Academic Search Premier was the search source with the following selected databases: ERIC, MedLINE, PsycARTICLES, and PsycINFO. The following Boolean terms/phrases were used: (―behavioral momentum interventions‖) OR (―high probability command sequences‖) OR (―high preference directions) AND (―child*‖) OR (―adolescents‖) OR (―youth‖) OR (―teenagers‖) OR (―students‖) OR (―students with disabilities‖). In addition, ancestral searches were conducted of four journals that publish exclusively or primarily SCRD studies: Journal of
Applied Behavior Analysis, Journal of Behavioral Education, Journal of Positive Behavior Interventions, Education and Treatment of
Children, and Behavioral Disorders. Finally, references of four previously published reviews of high-p request sequences
were searched (Banda et al., 2003; Killu, 1999; Lee, 2005; Brosh et al., 2018) in addition to the recent Common et al. (2018) meta-analysis.
Eligibility Criteria and Study Selection
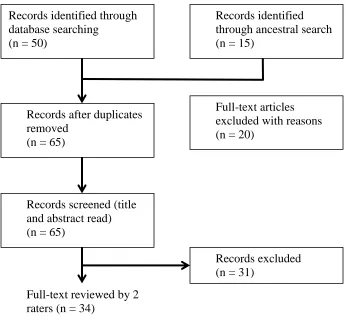
Figure 1. Search Results using PRISMA Guidelines
Records identified through
database searching
(n = 50)
Records identified
through ancestral search
(n = 15)
Records after duplicates
removed
(n = 65)
Records screened (title
and abstract read)
(n = 65)
Records excluded
(n = 31)
Full-text reviewed by 2
raters (n = 34)
Articles included in
meta-analysis (n = 14)
Studies included were those only using SCRDs, had to be in English, and published in peer-reviewed journals between January 1, 1988 and December 30, 2018. The start year of 1988 was selected because it was when the first study on behavior momentum was conducted (i.e., Mace et al., 1988). Participants had to between the ages of 4 and 18 and attend pre-K through grade 12 traditional school settings. This criteria is different than that of Common et all (2018) in which only kindergarten and not pre-kindergarten studies were included. Their rationale for not including pre-K studies was because school-based demands different from those in K-12 settings. However, in the current meta-analysis only high-p request sequences were included in which an adult gave a child a series of directions to engage in desirable behavior (e.g., talk to your neighbor, get a drink of water) before being instructed to engage in a undesirable behavior (e.g., complete this two-digit by two digit math worksheet). Conversely high-p task sequences would contain the same direction (e.g., complete this worksheet) but begin with easier problems (e.g., one-digit by one-digit) on before encountering two-digit by two-digit problems.
Studies were identified and retained at different stages based on PRISMA guidelines, and the results are displayed in Figure 1. There were 65 total records identified that were articles appearing in peer-reviewed journals. Of those, 34 were read in their entirety (i.e., method sections for inclusion/exclusion criteria). Two graduate students were trained by the researcher how to read each of the 34 studies method sections. One graduate student read all 34 studies (i.e., method sections) while the other read 12 randomly selected studies and their interrater agreement was 100%.After engaging in the flow of information process, there were 14 articles retained for the current review.
Coding Procedures
Descriptive characteristics. The 14 articles retained from the search were coded along six variables: (a) participant age, gender, and, diagnosis/educational label, (c) setting, (d) type of design,(e) dependent variables, and (f) type of high-p and low-p requests. Two graduate assistants were trained by the experimenter to code the seven variables. Six studies were randomly selected and the experimenter demonstrated the coding process on three through instructions and modeling. The two graduate assistants coded the remaining three studies with the experimenter providing performance feedback. The two graduate students then each coded the remaining studies independent of each other. Inter-rater reliability (IRR) was calculated for eight randomly selected studies (50%). This percentage was congruent with other published SCRD meta-analyses (e.g., Gage, Lewis, & Stichter, 2012; Losinski, Maag, Katsiyannis, & Parks-Ennis, 2014; Maggin et al., 2013).
Methodological quality. Two graduate assistants appraised the quality of each article based on the Council for Exceptional Children’s (CEC) Standards for Evidence-Based Practices (2014) that consisted of 22 component items across eight quality indicators (QIs) for SCRDs. The same training format used for coding descriptive characteristics was used for coding QIs. A binary score of one (met) or zero (not met) were used in the coding scheme (i.e., absolute coding) rather than using weighted coding (Common, Lane, Pustejovsky, Johnson, & Johl, 2017). The reason for using the more stringent approach was because of the extent to which self-monitoring has been used throughout the decades with positive results as typically determined through visual inspection. In essence, it is a proven evidence-based practice, and the absolute quality of those studies is the focus in the present review. A coding sheet with the 22 components across eight QIs for SCRD studies was created in Excel©. The sheet consisted of three columns. The
first column contained the QI, the second column had the description, and the third column consisted of clarification developed by Common et al. (2017).
Statistical Analysis
Data extraction. Data were extracted from the graph(s) in each study using Enguage Digitizer (Mitchell, 2002)—an open source digitizing software package that converts graphic image files (e.g., .jpg, .bmp) into numerical data. Enguage is a free software package that is comparable to Biosoft’s Ungraph 5.0 that was recommended in the manual developed by Nagler, Rindskopf, and Shadish (2008) for conducting SCRD meta-analyses and used in previous meta-analyses (e.g., Losinski et al., 2014). In addition, Losinski and his colleagues also converted all scores into percentages setting the upper level and lower level of the y axis on all students to 100 and 0, respectively, before extraction. Their rational was to address the inherent subjectivity in which target variables were operationally defined, for example ―aggression‖ versus ―hitting and pushing‖ or different behaviors that make up ―off-task.‖
Therefore, three types of effect sizes were calculated in the present meta-analysis. Standard mean difference (SMD) was calculated because it is the SCRD analog or variation of Cohen’s d statistic where the mean of the baseline phase is subtracted from the mean of the intervention phase and divided by the pooled standard deviation (Busk & Serlin, 1992). The similarity to Cohen’s d makes SMD an important statistic for comparison to non-single-case methods. However, SMD is considered by some unreliable because of small number of observations and floor effects limiting variability and results in overestimates of the parametric treatment effects (Horner et al., 2012; Scruggs & Mastropieri, 2012). Losinski et al. (2014) dealt with this problem by establishing a ceiling value of d at the 3rd quartile
total distribution in order to account for statistical outliers disproportionally affecting the outcomes of the studies when aggregated. This practice (i.e., 3rd quartile ceiling) was also used in the present study resulting in a ceiling of d =
3.86. Improvement rate difference (IRD) was also computed because it provides an effect size similar to the risk
difference used in medical treatment research which has a proven track record in hundreds of studies (Parker, Vannest,
& Brown, 2009). Finally Tau-U values were computed because it controls for monotonic trend (i.e., increasing data during baseline). The IRD and Tau-U were calculated using the www.singlecaseresearch.org/calculators. For studies in which improvement was in the decreasing direction, the correction feature for Tau-U was not used (i.e., only Tau). Effect sizes for SMD were computed using a calculator.
Additional analysis. Age was the only moderator variable addressed in the current meta-analysis. Independent t-testswere computed to compare differences between all three effect size calculations: SMD, IRD, and Tau-U values for each the moderator of age. Participants were assigned to either young and old groups based on the median score for age.
Publication Bias
Publication bias, or the ―file drawer‖ effect refers to presence of potential bias existing because of a greater likelihood that published research shows positive findings (Rosenthal, 1979). In a meta-analysis of group design studies, the Meta-Win’s Fail-Safe function (Rosenberg, Adams, & Gurevitch, 2000) can be used to estimate the number of studies with null results sufficient to reduce observed effect size to a minimal level (i.e., < .20). However, there is no comparable formula in SCRD meta-analyses, at least in the absence of calculating BC-SMD. Therefore, to reduce the likelihood of the ―file drawer‖ effect, the number of cases with no effect (i.e., 0) were added to the group of study effect sizes to reduce the overall effect to insignificant or suspect levels (d<.20; IRD <.37; Tau <.20). This process results with the number of participants in potentially ―filed‖ studies (i.e., not submitted for publication for whatever reasons) needed to reduce effect sizes of included studies to insignificant levels (i.e., no observed effect). Inter-Rater Reliability
Interrater reliability (IRR) data were conducted on six randomly selected articles out of the 14 included studies for a total of 43% of studies on the six coded study characteristics and QIs. Interrater reliability was calculated both for study characteristics and QI components by dividing the total number of agreements by the total number of agreements plus disagreements for each item and averaged for all items. Two graduate research assistants coded the articles for all variables and IRR for study characteristics was 83.7% (range: 60% -100%; SD=15.367) and 78.8% (range 68% - 91%; SD=8.035) for QIs.
Results
Results are presented in three sections. The first section addressed descriptive features obtained from the studies including characteristics of participants and settings, design features, dependent variables, and self-monitoring techniques. The second section presents the extent to which studies met each of the 22 component items pertaining to SCRD across CEC’s eight QIs. The final section contains effect size and moderator results.
Descriptive Features of Included Studies
There were five participants identified as having an emotional and behavioral disorder (Axelrod & Zank, 2012; Davis & Reichle, 1996) and another five with Down syndrome (Davis, Reichle, & Southard, 2000; Davis, Brady, Williams & Hamilton, 1992; Sanchez-Fort et al., 1995; Singer, Singer, & Horner, 1987). There were seven participants at-risk (Ardoin, Martens, & Wolfe, 1999) and two with no diagnosis or condition (Austin & Agar, 2005). There was one participant each with a learning disability (Wehby & Hollahan, 2000), ADHD (Axelrod & Zank, 2012), intellectual disability (Singer et al., 1987), Wolf Hirshorn syndrome (Sanchez-Fort et al., 1995), and tuberous sclerosis (Singer et al., 1987). There were four participants with comorbid conditions: EBD and mild intellectual disability (Davis et al., 2000), autism and intellectual disability (Davis & Reichle, 1992), and developmental delay and cerebral palsy (Killu, Sainato, Davis, Ospelt, & Paul, 1998).
The majority of studies were conducted in a general education classroom (n = 8). Four studies were conducted in special education classrooms. There was one study each that took place in a life skills classroom (Davis et al., 1992) and private school classroom (Ray et al., 1999).
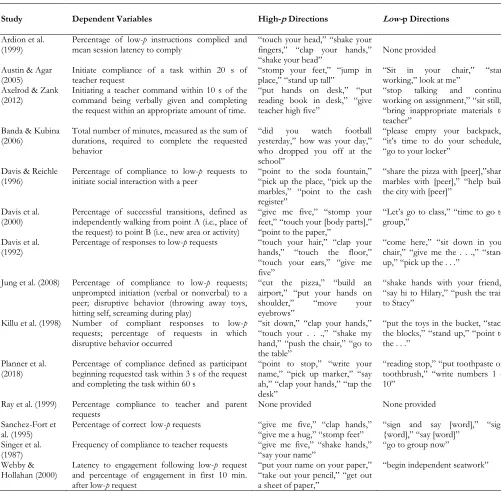
Table 1. Dependent Variables and High-p and Low-p Request Sequences by Study
Study Dependent Variables High-p Directions Low-p Directions
1. Ardion et al.
(1999) Percentage of low-mean session latency to comply p instructions complied and ―touch your head,‖ ―shake your fingers,‖ ―clap your hands,‖
―shake your head‖ None provided 2. Austin & Agar
(2005) Initiate compliance of a task within 20 s of teacher request ―stomp your feet,‖ ―jump in place,‖ ―stand up tall‖ ―Sit in your chair,‖ ―start working,‖ look at me‖ 3. Axelrod & Zank
(2012) Initiating a teacher command within 10 s of the command being verbally given and completing the request within an appropriate amount of time.
―put hands on desk,‖ ―put reading book in desk,‖ ―give teacher high five‖
―stop talking and continue working on assignment,‖ ―sit still,‖ ―bring inappropriate materials to teacher‖
4. Banda & Kubina (2006)
Total number of minutes, measured as the sum of durations, required to complete the requested behavior
―did you watch football yesterday,‖ how was your day,‖ who dropped you off at the school‖
―please empty your backpack,‖ ―it’s time to do your schedule,‖ ―go to your locker‖
5. Davis & Reichle
(1996) Percentage of compliance to low-initiate social interaction with a peer p requests to ―point to the soda fountain,‖ ―pick up the place, ―pick up the marbles,‖ ―point to the cash register‖
―share the pizza with [peer],‖share marbles with [peer],‖ ―help build the city with [peer]‖
6. Davis et al.
(2000) Percentage of successful transitions, defined as independently walking from point A (i.e., place of the request) to point B (i.e., new area or activity)
―give me five,‖ ―stomp your feet,‖ ―touch your [body parts],‖ ―point to the paper,‖
―Let’s go to class,‖ ―time to go to group,‖
7. Davis et al. (1992)
Percentage of responses to low-p requests ―touch your hair,‖ ―clap your hands,‖ ―touch the floor,‖ ―touch your ears,‖ ―give me five‖
―come here,‖ ―sit down in your chair,‖ ―give me the . . .,‖ ―stand up,‖ ―pick up the . . .‖
8. Jung et al. (2008) Percentage of compliance to low-p requests; unprompted initiation (verbal or nonverbal) to a peer; disruptive behavior (throwing away toys, hitting self, screaming during play)
―cut the pizza,‖ ―build an airport,‖ ―put your hands on shoulder,‖ ―move your eyebrows‖
―shake hands with your friend,‖ ―say hi to Hilary,‖ ―push the train to Stacy‖
9. Killu et al. (1998) Number of compliant responses to low-p
requests; percentage of requests in which disruptive behavior occurred
―sit down,‖ ―clap your hands,‖ ―touch your . . .,‖ ―shake my hand,‖ ―push the chair,‖ ―go to the table‖
―put the toys in the bucket, ―stack the blocks,‖ ―stand up,‖ ―point to the . . .‖
10. Planner et al.
(2018) Percentage of compliance defined as participant beginning requested task within 3 s of the request and completing the task within 60 s
―point to stop,‖ ―write your name,‖ ―pick up marker,‖ ―say ah,‖ ―clap your hands,‖ ―tap the desk‖
―reading stop,‖ ―put toothpaste on toothbrush,‖ ―write numbers 1 – 10‖
11. Ray et al. (1999) Percentage compliance to teacher and parent
requests None provided None provided
12. Sanchez-Fort et
al. (1995) Percentage of correct low-p requests ―give me five,‖ ―clap hands,‖ ―give me a hug,‖ ―stomp feet‖ ―sign and say [word],‖ ―sign {word],‖ ―say [word]‖ 13. Singer et al.
(1987) Frequency of compliance to teacher requests ―give me five,‖ ―shake hands,‖ ―say your name‖ ―go to group now‖ 14. Wehby &
Hollahan (2000) Latency to engagement following low-and percentage of engagement in first 10 min. p request after low-p request
―put your name on your paper,‖ ―take out your pencil,‖ ―get out a sheet of paper,‖
Design features.A multiple baseline design across participants was used in five studies, three across participants (Axelrod & Zank, 2012; Jung, Sainato, & Davis, 2008; Killu et al., 1998), and one each across trainers and requests (Davis et al., 1992; Sanchez-Fort et al., 1995). A reversal design was used in four studies (Austin & Agar, 2005; Banda & Kubina, 2006; Singer et al., 1987; Wehby & Hollahan, 2000). There were two studies each that used a multi-element design (Ardoin et al., 1999; Ray et al., 1999) and alternating treatments design (Davis et al., 2000; Planer et al., 2018). There was one study that used a reversal design embedded in a multiple baseline design (Davis& Reichle, 1996).
Dependent variables.The most common dependent variable was percentage of compliance for low-p
directions ( n = 8). Studies typically had a criterion in seconds participants needed to make and then a percentage was calculated using the number of low-p requests followed within the time frame and the number in which compliance did not occur (Austin & Agar, 2005; Axelrod & Zank, 2012; Planer et al., 2018). Two studies simply recorded latency after low-p requests (Ardoin et al., 1999; Wehby & Hollahan, 2000) while an additional two also targeted disruptive behavior (Jung et al., 2008; Killu et al., 1998). One study collected duration data on the length of time it took participants to complete (versus begin) a task (Banda & Kubina, 2006). Table 1 presents the dependent variables by study as well as high-p and low-p directions.
High-p and low-p requests and interventionists. Typical high-p requests involved participants touching a body part (head, hair, ears), clapping hands, giving a ―high five,‖ and stomping feet. Only two studies had academic-related high-p requests such as ―write your name on a piece of paper,‖ take out a piece of paper,‖ or ―get out a pencil‖ (Planer et al., 2018; Wehby & Hollahan, 2000). There were a variety of low-p requests depending on the setting, type of participant, and activity. Some examples included, but are not limited to, ―please empty your backpack,‖ ―share the pizza with [peer],‖ ―put toothpaste on toothbrush‖ (Banda & Kubina, 2006; Davis & Reichle, 1996; Planer et al., 2018). Singer et al. (1987) and Wehby and Hollahan (2000) only had one low-p direction apiece: ―go to group now‖ and ―begin independent seatwork,‖ respectively. Two studies did not provide any examples of low-p requests (Ardoin et al., 1999; Ray et al., 1999).
The interventionist for the majority of the studies was a teacher or instructional aid (n = 9). Ray et al. (1999) had the teacher and a parent in the classroom alternating giving high-p and low-p requests while Davis and Reichle (1996) taught a peer in the classroom to deliver both types of requests. The investigator was the interventionist in two studies (Jung et al., 2008; Killu et al., 1998).
Methodological Quality Indicators
CECs Standards for Evidence-Based Practices (2014) that consisted of 22 component items across eight quality indicators (QIs) for SCRDs were used to determine methodological quality of reviewed studies. One study met all 22 items (Axelrod & Zank, 2012) and one study met 20 (Jung et al., 2008). The lowest score (11) was obtained two studies (Ray et al., 1999; Singeer et al., 1987). Overall, quality of the 14 studies was moderate (mean=16.21, SD=3.238, range 11–22). The lowest score (n=3) was for item 3.1 which required studies to describe characteristics of the interventionist (e.g., race/ethnicity, educational level, licensure). The next lowest scores were for all there items under 5.0 implementation fidelity (n=6, n=7, n=4, respectively).
Further only two of the 22 items were met by all 14 studies: 6.1 Systematic manipulation of independent variable and
7.3 Study reports effects of intervention on all measures. Table 2 displays the results for each component across QIs for all 14
Table 2. Quality Indicators Met by Study
Quality Indicators (22 Items)
Study 1.
1 2.1 2.2 3.1 3.2 4.1 2 4. 5.1 5.2 5.3 6.1 6.2 6.3 6.4 6.5 6.6 7.1 2 7. 7.3 7.4 7.5 8.1 Total
1. Ardion et
al. (1999) 1 1 0 1 1 1 0 0 0 0 1 0 1 1 1 1 1 1 1 0 1 1 15 2. Austin &
Agar (2005)
1 0 0 0 1 1 1 1 1 0 1 1 1 1 1 1 0 1 1 1 1 1 17
3. Axelrod & Zank (2012)
1 1 1 1 1 1 1 1 1 1 1 1 1 1 1 1 1 1 1 1 1 1 22
4. Banda & Kubina (2006)
1 1 1 0 1 1 1 1 1 1 1 0 0 1 1 1 1 1 1 1 1 1 19
5. Davis & Reichle (1996)
1 1 1 0 1 1 1 0 1 0 1 1 1 1 1 1 0 1 1 1 1 1 18
6. Davis et al.
(2000) 1 1 1 0 1 1 1 0 0 0 1 1 1 0 1 0 1 1 1 1 1 1 16 7. Davis et al.
(1992) 1 1 1 1 1 1 1 0 0 0 1 1 1 1 1 1 1 1 1 1 1 1 19 8. Jung et al.
(2008) 1 1 1 0 0 1 1 1 1 1 1 1 1 1 1 1 1 1 1 1 1 1 20 9. Killu et al.
(1998) 1 1 1 0 0 0 1 0 0 0 1 1 0 1 1 1 1 1 1 1 1 1 15 10. Planner et
al. (2018) 1 1 1 0 0 0 1 1 1 1 1 0 0 0 0 1 1 1 1 1 1 1 15
11. Ray et al.
(1999) 1 0 1 0 1 1 1 0 0 0 1 1 1 0 0 0 1 0 1 0 0 1 11 12.
Sanchez-Fort et al. (1995)
1 1 1 0 1 1 1 0 0 0 1 1 1 1 1 0 1 1 1 1 1 0 16
13. Singer et
al. (1987) 1 1 1 0 0 1 1 0 0 0 1 1 0 0 0 1 0 1 1 0 0 1 11 14. Wehby
&Hollahan
(2000) 0 0 1 0 0 1 1 1 1 0 1 0 0 1 1 0 0 1 1 1 1 1 13
Total 13 11 1
2 3 9 12 13 6 7 4 14 10 9 10 11 10 10 13 14 11 12 13
Statistical Analysis
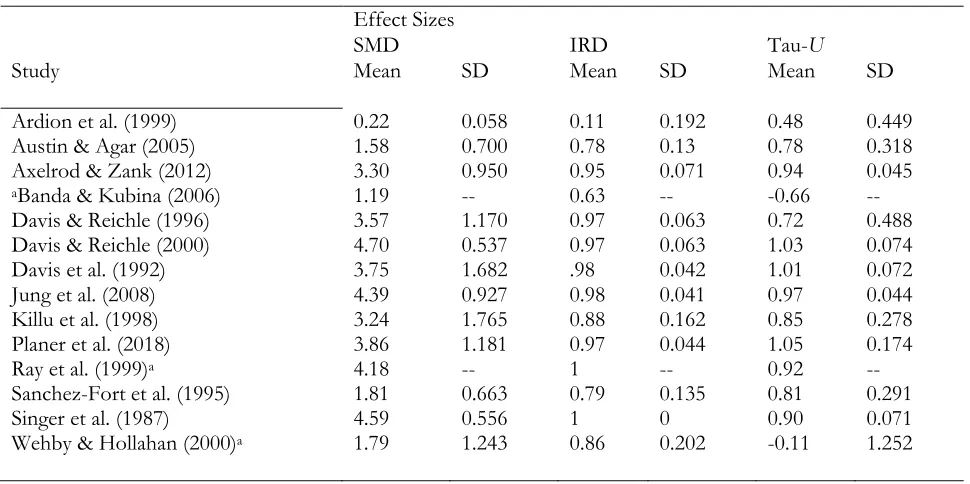
Table 3. Mean Study Effect Sizes
Study
Effect Sizes
SMD IRD Tau-U
Mean SD Mean SD Mean SD
1. Ardion et al. (1999) 0.22 0.058 0.11 0.192 0.48 0.449
2. Austin & Agar (2005) 1.58 0.700 0.78 0.13 0.78 0.318
3. Axelrod & Zank (2012) 3.30 0.950 0.95 0.071 0.94 0.045
4. aBanda & Kubina (2006) 1.19 -- 0.63 -- -0.66 --
5. Davis & Reichle (1996) 3.57 1.170 0.97 0.063 0.72 0.488
6. Davis & Reichle (2000) 4.70 0.537 0.97 0.063 1.03 0.074
7. Davis et al. (1992) 3.75 1.682 .98 0.042 1.01 0.072
8. Jung et al. (2008) 4.39 0.927 0.98 0.041 0.97 0.044
9. Killu et al. (1998) 3.24 1.765 0.88 0.162 0.85 0.278
10. Planer et al. (2018) 3.86 1.181 0.97 0.044 1.05 0.174
11. Ray et al. (1999)a 4.18 -- 1 -- 0.92 --
12. Sanchez-Fort et al. (1995) 1.81 0.663 0.79 0.135 0.81 0.291
13. Singer et al. (1987) 4.59 0.556 1 0 0.90 0.071
14. Wehby & Hollahan (2000)a 1.79 1.243 0.86 0.202 -0.11 1.252
14
a only one participant
Effects of studies. Effect sizes were calculated for each AB contrast. Several studies used a multiple baseline design across three behaviors so those participants would have three AB contrasts. Effect sizes were then averaged for each study and appear in Table 3. Overall omnibus effect sizes for each type were as follows: SMD (mean = 3.15, SD = 1.272, range = 0.183 – 4.98); IRD (mean = .862; SD = 1.580,range = 0 – 1); and Tau-U, mean = .802 , SD = .431, (range = -1 – 1.25). Results of independent samples t-tests with equal variances not assumed displayed were calculatedbetween age for young (n = 53, <13) and old (n = 19, >13) for each effect size. There were no statistically significant differences were obtained for SMD (t = -0.694, p = .24) and IRD (t = -1.526, p = .06), but not for Tau-U(t = -0.993, p = .16).
Publication bias. To address the ―file drawer effect,‖ the number of studies with results of zero required to reduce the overall effect to insignificant or suspect levels was determined for IRD and Tau-U effect sizes. Effect sizes for SMD were not used because of its tendency to inflate scores. It would take an additional 36 cases with an average effect size of 0 to bring the overall IRD into the ineffective range (<.36), and 68 cases with an average effect size of 0 to overall Tau-U into the small to ineffective range (<.20).Most SCRD studies contain between one and six participants. Using the average of three participants per study, at least 22 unpublished SCRD studies will null effects would be needed to reduce currently obtained effect sizes to small or questionable levels.
Discussion
The purpose of the present meta-analysis was to partially replicate Common et al. (2018) in terms of the effectiveness and quality of studies but only focused on high-p and low-p verbal requests given to participants and omitted studies that used high-p and low-p task requests. For example, a high-p and low-p task request would be having a worksheet broken into two sections with the first 15 being addition and the last five being subtraction. The direction would be the same for each part, ―write as many correct answers as you can.‖ The rationale for excluding these studies is because results from high-p and low-p tasks could vary depending on the age and difficulty of the academic content (e.g., addition to subtraction versus geometry to calculus) whereas focusing only on verbal high-p
Characteristics of the Studies
Participants’ diagnoses varied widely in the current systematic review and included, but not limited to, emotional or behavioral disorder, intellectual disability, learning disability, ADHD, and developmental disabilities. There were two rather unusual conditions: Wolf Hirshorn syndrome (Sanchez-Fort et al., 1995), and tuberous sclerosis (Singer et al., 1987). However, previous reviews also had a variety of participant diagnoses. For example, Common et al. (2018) had similar diagnoses for participants from kindergarten through 12th grade. Two other reviews included adults as old as 45 years of age (Killu, 1999; Lee, 2005). The Brosh et al. (2018) review only focused on participants with autism. In spite of the variety of conditions, the unanswered question remains as to whether high-p and low-p request sequences are more effective for some types of conditions than others. An interesting variable across studies was the elementary nature of high-p requests that typically reflect the types of requests given by an adult playing Simon Says with children: ―touch head,‖ ―clap hands,‖ ―give high five.‖ Perhaps those type of high-p
requests make sense since the average age of participants was around seven, although there was a study with teenage participants (Wehby & Hollhan, 2000). Surprisingly, the current review was the only one to provide the specific
high-p request statements. Banda et al. (2003) only categorizedthem as transition, social interactions, general communication, play, and food intake.Brosh et al. (2018) did not specify the type of directions, but rather indicated the nature of the intervention as compliance, social interaction, or food acceptance. Similarly, Killu (1999) did not specify the high-p requests but instead just presented the participants, setting dependent variables and/or measurement, and results. Common et al. (2018) also did not provide the specific high-p directions but rather stated how they were identified (e.g., preference assessment, consultation between researcher and teacher, teacher nomination, observation). Similar to Common et al. (2018), the Lee (2005) review described how high-p requests were generated, but did not provide detailed descriptions of the actualrequests that were generated.
An issue that has not been addressed is the lack of school-based contextually relevant high-p requests for students who display challengingbehaviors but to not have more severe conditions such as intellectual disabilities, pervasive developmental disabilities, or autism. For example, high-p requests such as ―Put your reading book away,‖ ―Line up for lunch,‖ ―Tack pictures on the bulletin board,‖ ―Sharpen these pencils,‖ ―Get a drink of water,‖ or ―Talk to a classmate‖ would be much more relevant to students in elementary or middle schools. These type of high-p and low-p request sequences not only are more contextually relevant to the classroom but also represent a simple, low-impact technique (Mooney & Ryan, 2018).
Quality of the Studies
One of the results obtained from the current analysis was that the studies reviewed were of only moderate quality. Only one study met all QIs (Axelrod & Zank, 2012) but did not include three or more cases. The Common et al. (2018) review found two studies met all 22 quality items, but they too did not include three or more cases.
Interestingly, in their review the Axelrod and Zank study met 21 items with the one missing being 6.3 No or limited access to the independent variable during baseline. This discrepancy shows that there is still some clinical subjectivity in interpreting the extent to which a study meets any given QI. However, a limitation of the current review was that the interrater reliability for coding the 22 items were lower than that obtained by Common and his colleagues. The question remains whether high-p and low-p request sequences could be classified as an evidence-based practice (EBP). Common et al. (2018) concluded, using a weighted criterion, that they met requirements for high-p
and low-p request sequences to be an evidence based practice using a weighted criterion. However, they also included studies with high-p and low-p task sequences, three of which established a function relation across three or more cases. Lee, Belfiore, Scheeler, Hua and Smith (2004) used single digit worksheets (high-p) to increase accuracy on multi-digit (low-p) worksheet. Cates et al. (2003) had participants spell easy words (high-p) before spelling the target words (low-p). Lee and Laspe (2003) increased number of words written in a journal (low-p) by first having participants write words on a ―word wall‖ (high-p). The Brosh et al. (2018) review also concluded that their studies could be considered an EBP using criteria similar to those Horner et al. (2005) developed, although they only focused on participants with autism spectrum disorder.
Effectiveness of High-p and Low-p Request Sequences
baseline designs (Shadish, Hedges, Horner, & Odom, 2015). Their within-case effect size was based on the log response ratio (LLR). They had nine studies that met the technical requirements for this calculation and of these, four displayed a therapeutic effect for increasing participants behavior. Lee (2005) calculated the percentage of nonoverlapping data (PND) and obtained mean ranges between 64.93% (questionable effectiveness) to 93.75% (very effective). However, the acknowledged drawback of PND is its susceptibility to outliers dictating results and lacks a sampling distribution (Parker, Vannest, & Davis, 2011).
In the current study, effect sizes obtained for IRD and Tau-U were in the large range which indicate slightly more effective than those obtained for the Lee (2005) meta-analysis. However, these results should be interpreted with caution because of the relatively low number of cases needed to bring effect size results down to ineffective or suspect levels. However, other researchers have obtained similar or fewer number of cases needed in order to obtain effect sizes to questionable levels (e.g., Losinski et al., 2014).
Implications for Practice
The results are somewhat equivocal in terms of high-p and low-p request sequences being an EBP depending on the type of approach and participant characteristics. Similarly, the effectiveness of this approach is somewhat positive. However, a variable that has not been addressed, and that has important implication for practice, is the skill level of the individual giving the directions. High-p and low-p request sequences, by definition, is a verbal-based intervention. It is not usuallysomething teachers routinely use to engender compliance because the typicalparadigm when students present noncompliance is using verbal reprimands and exclusionary practices (Maag, 2012b). Therefore, an important teacher characteristic is havingpsychological flexibilityfor this approach to be effective. Psychological flexibility is a term used in positive psychology to describe an individual’s ability to modify responses to best match any given situation. Individuals with this characteristic are resilient, have a dynamic ability to momentarily change from typical reactions or preconceived notions to reactions and perceptions responsive to the immediate situation (Block & Block, 2006).
Teachers cannot always predict under what circumstances and which students will display noncompliant behavior. Therefore, high-p and low-p request sequences may need to be used spontaneously. For example, a teacher may tell students to get out a piece of paper to do their math problems and one student refused and says ―I’m not going to do that. I hate what we are studying now in math.‖ A typical teacher response would be to repeat the direction and if the student continues to refuse then attach a negative consequence for further noncompliance. Conversely, a teacher who is psychologically flexible may response by saying ―That’s okay and instead I want you to draw on your piece of paper (high-p) and use your favorite colored pencil (high-p) and then when you are finished to write the answers to the math problems (low-p).‖
Even in this example, the issues of how many high-p directions should be given before the low-p direction, and how long to wait before giving the low-p directions remain unknown or at least problematic. The studies reviewed researched high-p and low-p request sequences in a very planned scripted manner that does not reflect the daily realities of situations for which teachers face.
Conclusion
References
*Ardoin, S. P., Martens, B. K., &Wolfe, L. A. (1999). Using high-probability instruction sequences with fading to increase student compliance during transition. Journal of Applied Behavior Analysis,32, 339-351. doi:10.1901/jaba.1999.32-339
*Austin, J. L., & Agar, G. (2005). Helping young children follow their teachers’ directions: The utility of high probability command sequences in Pre-K and kindergarten classrooms. Education and Treatment of Children, 28, 222-236.
*Axelrod, M. I., & Zank, A. J. (2012). Increasing classroom compliance: Using a high-probability command sequence with noncompliant students. Journal of Behavioral Education, 21, 119-133. doi:10.1007/s10864-011-9145-6 *Banda, D. R., & Kubina, R. N. (2006). The effects of a high-probability request sequencing technique in enhancing
transition behaviors. Education and Treatment of Children,29, 507-516.
Banda, D. R., Neisworth, J. T., & Lee, D. L. (2003). High-probability request sequences and young children: Enhancing compliance. Child and Family Behavior Therapy, 25, 17-29. doi:10.1300/j019v25n02_02
Block, J., & Block, J. H. (2006). Venturing a 30-year longitudinal study. American Psychologist, 61, 315-327. doi:10.1037/0003-066x.61.4.315
Brosh, C. R., Fisher, L. B., Wood, C. L., & Test, D. W. (2018). High-probability request sequences: An evidence-based practice for individuals with autism spectrum disorder. Education and Training in Autism and Developmental
Disabilities, 53, 276-286.
Bross, L. A., Common, E. A., Oakes, W. P., Lane, K. L., Menzies, H. M., & Parks Ennis, R. (2018). High-probability request sequence: An effective, efficient low-intensity strategy to support student success. Beyond Behavior,
27(3), 140-145. doi:10.1177/1074295618798615
Busk, P. L., & Serlin, R. C. (1992). Meta-analysis for single-case research. In T. R. Kratochwill &J. R. Levin (Eds.),
Single-case research designs and analysis: New directions for psychology and education (pp. 187–212). Hillsdale,NJ:
Lawrence Erlbaum Associates.
Cates, G. L., Skinner, C. H., Watson, T. S., Meadows, T. J., Weaver, A., & Jackson, B. (2003). Instructional effectiveness and instructional efficiency as considerations for data based decision making: An evaluation of interspersing procedures. School Psychology Review, 32, 601-616.
Common, E. A., Lane, K. L., Pustejovsky, J. E., Johnson, A. H., & Johl, L. E. (2017). Functional assessment-based interventions for students with or at-risk for high-incidence disabilities: Field testing single-case synthesis methods. Remedial and Special Education, 1-20.
Common, E. A., Bross, L. A., Oakes, W. P., Cantwell, E. D., Lane, K. L., & Germer, K. A. (2018). Systematic review of high probability requests in K – 12 settings: Examining the evidence base. Behavioral Disorders, 1-19. Doi: 10.1177/0198742918800029
Council for Exceptional Children. (2014). Council for Exceptional Children standards for evidence-based practices in special education. Exceptional Children, 80, 504-511. doi:10.1177/0014402914531388
*Davis, C. A., Brady, M. P., Williams, R. E., & Hamilton, R. (1992). Effects of high-probability requests on the acquisition and generalization of responses to requests in young children with behavior disorders. Journal of
Applied Behavior Analysis, 25, 905-916. doi:10.1910/jaba.1992.25-905
*Davis, C. A., & Reichle, J. (1996). Variant and invariant high-probability requests: Increasing appropriate behaviors in children with emotional-behavioral disorders. Journal of Applied Behavior Analysis, 29, 471-482. doi:10.1901/jaba.1996.29-471
*Davis, C. A., Reichle, J. E., & Southard, K. L. (2000). High-probability requests and a preferred item as a distractor: Increasing successful transitions in children with behavior problems. Education and Treatment of Children, 23, 423-440.
Ewry, D. M., & Fryling, M. J. (2016). Evaluating the high-probability instructional sequence to increase the acceptance of foods with an adolescent with autism. Behavior Analysis Practice. 9, 380-383. doi:10.1007/s40617-015-0098-4 Fisher, W. W., Greer, B. D., Craig, A. R., Retzlaff, B. J., Fuhrman, A. M., Kichtblau, K. R., & Saint, V. (2018). The
predictive validity of behavioral momentum theory for mitigating resurgence of problem behavior. Journal of
Gage, N. A., Lewis, T. J., & Stichter, J. P. (2012). Functional behavioral assessment-based interventions for students with or at risk for emotional and/or behavioral disorders in school: A hierarchical linear modeling meta-analysis. Behavioral Disorders, 37, 55-77. doi: 10.1177/0198742912037000201
Hagopian, L. P.,&Thompson, R. H. (1999). Reinforcement of compliance with respiratory treatment in a child with cystic fibrosis. Journal of Applied Behavior Analysis, 32, 233-236. doi:10.1910/jaba.1999.32.233
Horner, R. H., Carr, E. G., Halle, J., McGee, G., Odom, S., & Wolery, M. (2005). The use of single-subject research to identify evidence-based practice in special education. Exceptional Children, 71, 165-179.
doi:10.1177/001440290507100203
Horner, R. H., Swaminathan, H., Sugai, G., & Smolkowski, K. (2012). Considerations for the systematic analysis of single-case research. Education and Treatment of Children, 35, 269-290. doi: 10.1353/etc.2012.0011
Humm, S. P., Blampied, N. M., & Liberty, K. A. (2005). Effects of parent-administered, home-based, high-probability request sequences on compliance by children with developmental disabilities. Child & Family Behavior Therapy,
27, 27-45. doi:10.1300/j019v27n03_03
*Jung, S., Sainato, D. M., & Davis, C. A. (2008). Using high-probability request sequences to increase social interactions in young children with autism. Journal of Early Intervention, 30, 163-187.
doi:10.1177/1053815108317970
Kelly, L., & Holloway, J. (2015). An investigation of the effectiveness of behavioral momentum on the acquisition and fluency outcomes of tacts in three children with autism spectrum disorder. Research in Autism Spectrum Disorders,
9, 182-192. doi:10.1016/j.rasd/2014.10.007
Kern, L., Childs, K. E., Dunlap, G., Clarke, S., & Falk, G. D. (1994). Using assessment-based curricular intervention to improve the classroom behavior of a student with emotional and behavioral challenges. Journal of Applied
Behavior Analysis, 27, 7-19. doi:10.1901/jaba.1994.27-7
Killeen, P. R., & Nevin, J. A. (2018). The basis of behavioral momentum in the nonlinearity of strength. Journal of the
Experimental Analysis of Behavior, 209, 4-32. doi:10.1002/jeab.304
Killu, K. (1999). High-probability request research: Moving beyond compliance. Education and Treatment of Children, 22, 470-494.
*Killu, K., Sainato, D. M., Davis, C. A., Ospelt, H., &Paul, J. N. (1998). Effects of high-probability request sequences on preschooler’s compliance and disruptive behavior. Journal of Behavioral Education, 8, 347-368.
Lee, D. L. (2005). Increasing compliance: A quantitative synthesis of applied research on high-probability request sequences. Exceptionality, 13, 141-154. doi:10.1207/s15327035ex1303_1
Lee, D. L., Belfiore, P. J., Scheeler, M. C., Hua, Y., & Smith, R. (2004). Behavioral momentum in academics: Using embedded high-p sequences to increase academic productivity. Psychology in the Schools, 41, 789-801. doi:10.1002/pits.20014
Lee, D. L., & Laspe, A. K. (2003). Using high-probability request sequences to increase journal writing. Journal of
Behavioral Education, 12, 261-273.
Liberati, A., Altman, D. G., Tetzlaff, J., Mulrow, C., Gotzsche, P. C., Ioannidis, J. P. A., . . . Moher, D. (2009). The PRISMA statement for reporting systematic reviews and meta-analyses of studies that evaluate health care interventions: Explanation and elaboration. PLoS Medicine, 6(7), e1000100. doi:10.1371/journal.pmed.1000100 Losinski, M., Maag, J. W., Katsiyannis, A., & Ennis, R. P. (2014). Examining the effects and quality of interventions based on the assessment of contextual variables: A meta-analysis. Exceptional Children, 80, 407-422. doi: 10.1177/0014402914527243
Maag, J. W. (2012a). Challenging classroom behaviors: Overcoming resistance through uniquely audacious interventions. Port Chester, NY: Dude.
Maag, J. W. (2012b). School-wide discipline and the intransigency of exclusion. Children and Youth Services Review, 34, 2094-2100. doi:10.1016/j.childyouth.2012.07.005
Maag, J. W. (2018). Behavior management: From theoretical implications to practical applications (3rd ed.). Boston, MA: Cengage Learning.
Mace, F. C., Hoch, M. L., Lalli, J. S., West, B. J., Belfiore, P., Pinter, E., & Brown, D. K. (1988). Behavioral momentum in the treatment of noncompliance. Journal of Applied Behavior Analysis, 21, 123-141.
Mace, F. C., & Nevin, J. A. (2017). Maintenance, generalization, and treatment relapse: A behavioral momentum analysis. Education and Treatment of Children, 40, 27-42. doi:10.1353/etc.2017.0001
Special Education, 34, 44-58. doi: 10.1177/0741932511435176
Matson, J. L., Dixon, D. R., & Matson, M. L. (2005). Assessing and treating aggression in children and adolescents with developmental disabilities: A 20-year overview. Educational Psychology, 25, 151-181.
doi:10.1080/0144341042000301148
Mitchell, M. (2002). Engauge Digitizer (version 4.1) [computer software]. Available from http://sourceforge.net/projects/digitizer/
Mooney, P., & Ryan, J. B. (2018). Supporting professionals in becoming skilled classroom managers of behavior.
Beyond Behavior, 27(3), 127.
Nagler, E. M., Rindskopf, D. M., & Shadish, W. R. (2008). Analyzing data from small N designs using multilevel models: A
procedural handbook. Washington, D C: U.S. Department of Education.
Nevin, J. A. (1996). The momentum of compliance.Journal of Applied Behavior Analysis, 29, 535-547. doi:10.1901/jaba.1996.29-535
Olmi, D. J., Sevier, R. C., & Nastasi, D. F. (1997). Time-in/time-out as a response to noncompliance and inappropriate behavior with children with developmental disabilities: Two case studies. Psychology in the Schools,
34, 31-39. doi:10.1002/(sici)1520-6807(199701)34:1<31::aid-pits4>3.0.co;2-y
Parker, R. I., Vannest, K. J., & Brown, L. (2009). The improvement rate difference for single-case research. Exceptional
Children, 75, 135-150.
Parker, R. I., Vannest, K. J. & Davis, J. L. (2011). Nine non-overlap techniques for single case research.Behavior
Modification, 35, 303-322. doi:10.1177/0145445511399147
*Planer, J., Defar, R., Progar, P., Reeve, K., & Sarokoff, R. (2018). Evaluating tasks within a high-probability request sequence in children with autism spectrum disorder. Behavioral Interventions, 33, 380-390. doi:10.1002/bin.1634 *Ray, K. P., Skinner, C. H., & Watson, T. S. (1999). Transferring stimulus control via momentum to increase
compliance in a student with autism: A demonstration of collaborative consultation. School Psychology Review, 4, 622-628.
Rosenberg, M. S., Adams, D. C., & Gurevitch, J. (2000). Metawin. Sunderland, MA: Sinauer.
Rosenthal, R. (1979). The ―file drawer problem‖ and tolerance for null results. Psychological Bulletin, 86, 638-641. doi: 10.1037/0033-2909.86.3.638
*Sanchez-Fort, M., Brady, M. P., & Davis, C. A. (1995). Using high-probability requests to increase low-probability communication behavior in young children with severe disabilities. Education and Training in Mental Retardation
and Developmental Disabilities, 30, 151-165.
Scruggs, T.E. & Mastropieri, M.A. (2012). PND at 25: Past, present, and future trends in summarizing single-subject research. Remedial and Special Education, 34, 9-19. doi: 10.1177/0741932512440730
Shadish, W. R., Hedges, L. V., Horner, R. H., & Odom, S. L. (2015). The role of between-case effect size in conducting,
interpreting, and summarizing single-case research (NCER 2015-002). Washington, DC: National Center for
Education Research, Institute of Education Sciences, U.S. Department of Education.
*Singer, G.H.S., Singer, J., & Horner, R.H. (1987). Using pretask requests to increase the probability of compliance for students with severe disabilities. Journal of theAssociation for Persons with Severe Handicaps, 12, 287-291. doi:10.1177/154079698701200405
Vostal, B. R., & Lee, D. L. (2011). Behavioral momentum during a continuous reading task: An exploratory study.
Journal of Behavioral Education, 20, 163-181. doi:10.1007/s10864-011-9129-6
*Wehby, J. H., & Hollahan, M. S. (2000). Effects of high-probability requests on the latency to initiate academic tasks.
Journal of Applied Behavior Analysis, 33, 259-262. doi:10.1901/jaba.2000.33-259
Weston, R., Hodges, A., & Davis, T. N. (2018). Differential reinforcement of other behavior to treat challenging behaviors among children with autism: A systematic and quality review. Behavior Modification, 42, 584-609. doi:10.1177/0145445517743487