Vol.7 (2017) No. 3
ISSN: 2088-5334
Multi-Layer Perceptron (MLP)-Based Nonlinear Auto-Regressive with
Exogenous Inputs (NARX) Stock Forecasting Model
I. M. Yassin
*#%, M. F. Abdul Khalid#, S. H. Herman
*#, I. Pasya
#, N. Ab Wahab
#, Z. Awang
# *Faculty of Electrical Engineering, Universiti Teknologi MARA, 40000 Shah Alam, Selangor, Malaysia
E-mail: [email protected], [email protected], [email protected], [email protected], [email protected]
#
Microwave Research Institute (MRI), Universiti Teknologi MARA, 40000 Shah Alam, Selangor, Malaysia E-mail: [email protected]
%
Malaysia Institute of Transport (MITRANS), Universiti Teknologi MARA, 40000 Shah Alam, Selangor, Malaysia
Abstract— The prediction of stocks in the stock market is important in investment as it would help the investor to time buy and sell
transactions to maximize profits. In this paper, a Multi-Layer Perceptron (MLP)-based Nonlinear Auto-Regressive with Exogenous Inputs (NARX) model was used to predict the prices of the Apple Inc. weekly stock prices over a time horizon of 1995 to 2013. The NARX model is a system identification model that constructs a mathematical model from the dynamic input/output readings of the system and predicts the future behaviour of the system based on the constructed mathematical model. The One Step Ahead (OSA) and correlation tests were used to validate the model. Results demonstrate the predictive ability of the model while producing Gaussian residuals (indicating the validity of the model).
Keywords— system identification; stock market forecasting; nonlinear auto-regressive with exogenous inputs (NARX); multi-layer
perceptron (MLP)
I. INTRODUCTION
The prediction of stocks in the stock market is important in investment as it would help the investor to time buy and sell transactions to maximize profits. Stock market prediction is a difficult task since it is a complex nonlinear problem, and depends on the interaction of many external factors [4]. The stock market prediction has developed considerable recent research interest due to the discovery of state of the art algorithms and the rapid advancement of computational technology [6].
Two general methods exist to forecast stock prices namely Fundamental Analysis (examines the fundamentals of the company and its history in making an investment decision), and Technical Analysis (relies on statistical indicators that examine past movements patterns of the stock in order to predict its future value) [1].
Technical Analysis presents an interesting opportunity for the application of Artificial Intelligence (AI) techniques as AI can mimic human decision under uncertainty but with the additional computational advantage to processing data beyond the capabilities of a human being. The superior ability of the AI techniques over human experts has been
documented and proven [7]. Artificial Neural Network (ANN)-based technique has received significant attention because of ANN’s ability to capture complex and subtle relationships within data. It has since been proven to be able to outperform most conventional methods in prediction of the stock market.
In this paper, a Multi-Layer Perceptron (MLP)-based Nonlinear Auto-Regressive with Exogenous Inputs (NARX) model was used to predict the prices of the Apple Inc. stock price over a time horizon of 1995 to 2013. The NARX model is one of various system identification models that constructs a mathematical model from the dynamic input/output readings of the system and predicts the future behaviour of the system by feeding past behavior of the system to the constructed mathematical model. The One Step Ahead (OSA) and correlation tests were used to validate the model. Results demonstrate the predictive ability of the model while producing Gaussian residuals (indicating the validity of the model).
discussion of the proposed method in Section III. Finally, Section IV presents concluding remarks.
A. Statistical Methods for Forecasting Stock Markets
Data mining was used to extract important patterns from technical indicators in order to forecast future values of stock prices. Data was mined from several technical indicators namely the Chaikin Money Flow Indicator, Exponential Moving Average, Bollinger Bands and Relative Strength Index. The mined data was then used to generate a prediction of future stock prices of several stocks in the Indian Stock Exchange [1].
The data collected from the Twitter social media service are used to predict stock market reactions to the Federal Open Market Committee (FOMC) meetings. FOMC meetings are held eight times annually to discuss the American monetary policy. Due to the importance of the subject matter, these meetings have a significant effect on the American stock market, as well as receiving high attention from the public in online social media. Based on these above factors, the authors hypothesized the information that collected from social media could be used to gauge the stock market reactions to a meeting. Data related to the United States Federal Reserve was collected from Twitter and analysed using Natural Language Processing (NLP) technique. A mathematical model was then constructed using regression analysis based on the data [8].
The internet search queries were used to predict stock market volatility. Volatility is an indicator of strong market movements. The researchers theorized that the internet search queries indicated investors’ interest towards a stock, thus indicating a possible high volatility prime for strong upward or downward movements. The analysis was conducted on one American (Dow Jones Industrial Average (DJIA)) and three major European indices (FTSE 100, CAC 40 and DAX) from July 2006 to June 2011 using a statistical method called Vector Auto-Regressive (VAR). Their research concluded several findings: (1) There is a correlation between investor attention (internet search queries) with high market movement, (2) High attention leads to higher volatility in the stock trading prices, (3) Therefore, internet search queries carry valuable information that can be used to predict volatility [9].
Several statistics-based technical indicators are used to forecast the volatility of the Bursa Malaysia Plantation Index. The technical indicators used were the random walk, moving average, simple regression and historical mean. Simple regression was found to be the most suitable technique to estimate volatility. However, the proposed method achieved average accuracy compared to the actual index [10].
In a similar study, an empirical study is performed on the relationship between the India VIX (a volatility indicator for the Indian stock market). Based on the results of several models tested, it was found that the VIX was influenced by volatility for the past month, and had the bullish predictive ability over a 60-day prediction horizon [11].
A framework is proposed for forecasting the prices of Indian automotive stocks over a period of five years. Price data was decomposed into trend, seasonal and random components and were evaluated using several models over a
forecast horizon of one year. The proposed method managed to predict the data well while maintaining low error percentage values [6].
B. AI-Based Methods for Forecasting Stock Markets
AI-based methods had gained significant attention in stock market forecasting research because of its ability to mimic human reasoning for complex problems.
A hybrid intelligent model was proposed to forecast several stock market indices. The hybrid method consists of fuzzy exponential time series models with its parameters optimized using Harmony Search (HS) and Particle Swarm Optimization (PSO) algorithms. Results validation was performed on 46 test cases on five stock market indices with good results obtained compared to several other fuzzy-based methods [2].
Adaptive Extreme Learning Machine (AELM) was used to predict outliers indicating the volatility of stock prices using Wavelet Transform (WT) features [12]. AELM is an improved training algorithm for Artificial Neural Networks (ANN), which can train the ANN with minimal parameter settings. Experiments were performed using over the counter daily prices of the Petroleum Sector Index. The AELM model managed to predict outliers with greater accuracy relative to Auto-Regressive (AR) and traditional Extreme Learning Machine (ELM) methods.
A Genetic Algorithm (GA)-optimized ANN was presented to predict the direction of Japanese Nikkei 225 index prices. The GA was used to optimize the weights and biases of the ANN during the training phase. Comparisons with several AI-based techniques proved that the proposed method was superior with 81.27% accuracy in predicting the direction of the index movement [3].
A Fuzzy Logic (FL) approach was taken to forecast stock movement direction in the National Stock Exchange of India (SENSEX) over a prediction horizon of five days based on 14-day historical price (opening, closing, high and low prices) of the exchange [4]. The FL system classifies its predictions per three groups: bearish, bullish and neutral. Implementation was done on a Hadoop cluster to perform computations. The system demonstrated good ability to predict a five-day future direction of the SENSEX based on its 14-day history.
A combined Support Vector Machine (SVM) and Independent Component Analysis (ICA) forecasting model were proposed for market prediction of several stocks in the Bucharest and Baltic Stock Exchanges over a period of six years. The results showed that the SVM-ICA model outperformed the traditional SVM model for forecasting non-stationary time-series data in terms of reduced Root Mean Square Error (RMSE) [5].
C. The NARX Model
various methods such as polynomials, ANNs, and others [14]:
1 , 2 , … , ,
1 , 2 , … , (1)
where:
= prediction model (MLP in this paper). = model output at time, .
= model input. = input lag space. = output lag space. = residual.
II. MATERIAL AND METHOD A. Research Materials
Experiments were conducted on a Lenovo Ideapad 300 with an Intel i7-6700 Central Processing Unit (CPU) with 16 GB Random Access Memory (RAM). All programs were implemented in MATLAB v2016a.
B. Research Method
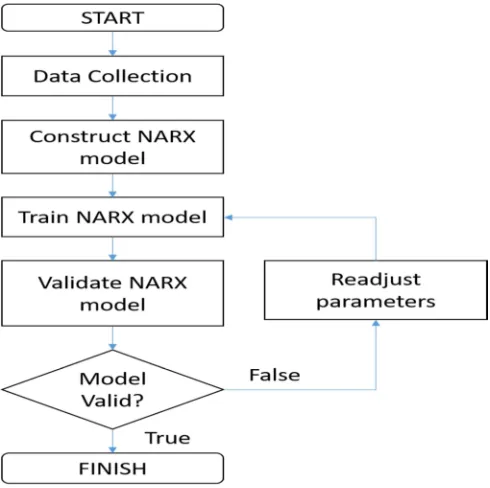
The research method is summarized in Fig. 1. A detailed description of each method is discussed.
Fig. 1 Flowchart of research method
Apple Inc. (ticker AAPL) stock price data was collected from the Yahoo Finance website (http://finance.yahoo.com). The weekly data consisted of week low, high, opening and closing prices as well as trading volume. A total of 1533 data points were collected spanning from September 1995 to August 2013.
The data was divided into training, testing and validation sets per a ratio of 70%: 15%: 15% respectively. The lag spaces and were set to 52 as we wanted the model to capture cyclical patterns from one year back to help future predictions.
MLP training was conducted using the Levenberg-Marquardt algorithm, which has been proven superior in function approximation problems [15]. Hidden units were varied between 5 and 30.
For model validation, the optimal selection of hidden units was based on two factors namely the Mean Squared Error (MSE) (which indicates how closely the prediction fits the original data) and the number of correlation violations (number of correlation coefficient violations from the autocorrelation and cross-correlation tests on model residuals). If the model was not considered as valid, adjustments to the initial parameters of the MLP are made.
C. Model Validation Tests
For the MLP model to be considered as valid and acceptable, the residuals of the model must be sufficiently small and randomly distributed. We used four tests namely the One-Step Ahead (OSA) autocorrelation, cross-correlation and histogram tests to examine the accuracy of the model as well as the randomness of the residuals produced by the MLP model.
OSA is a test that measures the ability of a model to predict future values based on its previous data [13]. It takes the form of:
(1)
where is the estimated nonlinear model and are the regressors. Representation of for the NARX model is shown in Equation (3):
1 , 2 , … ,
, 1 ,
2 , … ,
(2) If necessary, an -step ahead prediction may be obtained by iterative application of Equation (1) and Equation (3), substituting future outputs by OSA predictions.
Mean Squared Error (MSE) is a standard method for testing the magnitude of residuals for regression and model fitting problems [13]. The MSE equation for a residual vector of length is given by:
∑%#&'"# $ ( ∑%#&' #) # $
(
(3)
where * is the observed value, is the number of data points and * is the estimated value at the point +.
As the MSE value is calculated from the magnitude of residuals, low values indicate a good model fit. The ideal case for MSE is zero (when * * 0, + 1, 2, … , ). However, this rarely happens in actual modeling scenarios, and a sufficiently small value is acceptable.
In SI, correlation tests are used to validate the model by determining the whiteness of its residuals. A residual sequence exhibits white noise characteristics if the correlation tests of Equation (5) and Equation (6) hold:
-.. / 0 / 1 2 / (5)
- . / 0 / 1
0, ∀/ (6)
where:
-4'4$ / = correlation coefficient between signals 56 and 57.
0∎1 = mathematical expectation of the correlation function. = model residuals = .
/ = lag space.
= observed output at time, . 2 / = Kronecker delta defined as:
2 / 91, / 00, / ≠ 0 (4)
The confidence band reveals the significance of the correlation and a significantly large correlation is indicated by one or more coefficients lying outside the confidence band. In correlation tests, the 95% confidence band is required because there is a finite amount of data length available. The model is accepted if the correlation coefficients lie within the 95% confidence limits, defined as
±1.96/ with is the number of data points in the sequence
[13].
A histogram is a graphical method to present a distribution summary of a univariate data set. It is drawn by segmenting the data into equal-sized bins (classes), then plotting the frequencies of data appearing in each bin. The horizontal axis of the histogram plot shows the bins, while the vertical axis depicts the data point frequencies [13].
In SI, histogram analysis is used to view the distribution of the residuals. The histogram exhibits white noise as a symmetric bell-shaped distribution with most of the frequency counts grouped in the middle and tapering off at both [13].
III.RESULTS AND DISCUSSION A. Finding the Optimal Number of Hidden Units
A typical MLP structure is organized into three interconnected layers: the input, hidden and output units respectively. Units in the hidden layer are responsible for the MLP’s learning process by adjusting the weights between the layers, like that of synapses in the human brain. The number of hidden units need to be tested to determine the settings to produce the optimal results.
Several different hidden units were tested for the MLP, as shown in Table I. Since initial weight values play an effect on the MLP’s convergence (the Levenberg-Marquardt is a gradient-based optimization algorithm sensitive to the initial values), the initial weights were fixed by adjusting the seed value in the Mersenne-Twister algorithm used by MATLAB to generate values for the initial weight connections. Based on the results, it was discovered that the best number of hidden units was five as it appears to minimize the number
of correlation violations while maintaining a relatively low MSE. Therefore, it was used for further experiments.
TABLEI
MSE AND CORRELATION VIOLATION VALUES FOR DIFFERENT HIDDEN
UNITS
Hidden Units
MSE Correlation Violations (Testing Set)
5 7.72 22
10 20.5 43
15 40.5 55
20 1.06 x 10⁻¹⁰ 65 25 1.17 x 10⁻²⁴ 64
30 1.11 x 10⁻²⁵ 65
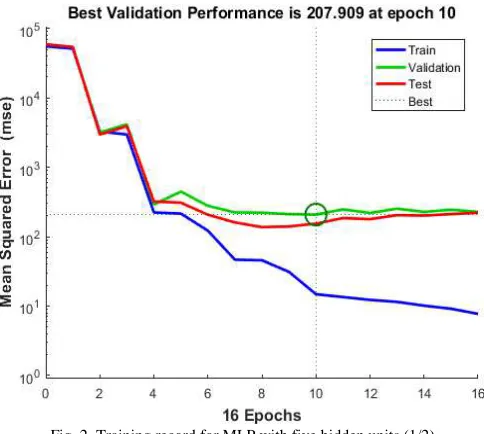
The training record for the optimal MLP is shown in Fig. 2 and Fig. 3. Training appears to have stopped prematurely as the maximum number of iterations (epochs) was set to 1000. This is because of the built-in Early Stopping (ES) algorithm that automatically terminates the training process when MLP starts to over-fit. This is to protect the MLP’s generalization (avoiding the MLP from memorizing known training data, resulting in poor performance in previously unseen cases).
Fig. 2 Training record for MLP with five hidden units (1/2)
With ES, the data is divided into three sets prior to training: the training, validation, and testing set. The training set is used to update the weights of the MLP repeatedly during training. Because of this, naturally, the error of the MSE will reduce to a very small value. However, the MLP would tend to perform well on the training set but would have a problem approximating previously unseen cases (in the testing set).
Fig. 3 Training record for MLP with five hidden units (2/2)
B. Examination of Prediction Accuracy
The One-Step-Ahead (OSA) plots (Fig. 4 and Fig. 5) examines the predictive capability of the MLP by using past data to predict the one-step-ahead output. Both OSA graphs show good agreement between the MLP prediction (red line) and the actual data (blue line), indicating the good predictive performance of the MLP.
Fig. 4 OSA prediction results-training set
Fig. 5 OSA prediction results-testing set
However, the model needs to be validated to ensure that the residuals are Gaussian in nature, an important requirement to ensure that the model is unbiased. We tested this using correlation and histogram tests on the residuals.
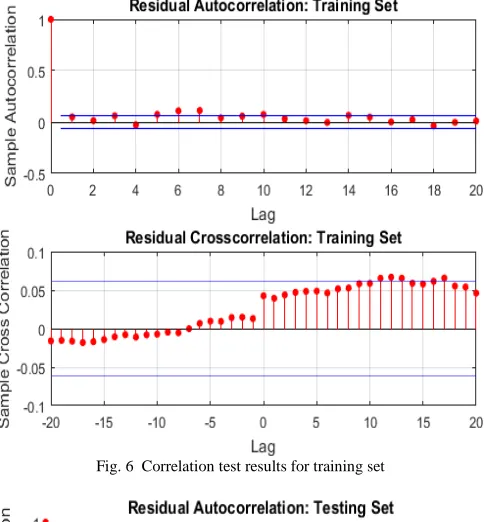
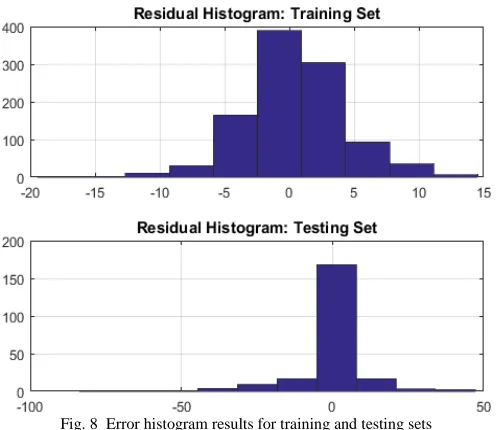
The correlation test results are shown in Fig. 6, Fig. 7 and the histogram test results are shown in Fig. 8. The correlation tests show minimal violations of the 95% confidence limits (except for lag 0 in the autocorrelation plot which is expected). This indicates that the residuals are randomly distributed. This observation is also supported by the error histogram, which shows a Gaussian (normal) distribution of the data (also indicating that the residuals are randomly distributed). According to system identification theory [13], the random distribution of residuals is equivalent to white noise, leading to the model being unbiased and acceptable.
Fig. 6 Correlation test results for training set
Fig. 8 Error histogram results for training and testing sets
IV.CONCLUSION
An MLP-based NARX model is presented for forecasting the Apple Inc. weekly stock prices. Results indicate good agreement between the prediction model and actual data while demonstrating that the model is unbiased and acceptable.
ACKNOWLEDGMENT
The authors would like to thank the Microwave Research Institute (MRI) and FRGS research grant number 600-RMI/FRGS5/3(0105/2016), Universiti Teknologi MARA (UiTM), for funding, equipment, and infrastructure in support of this research.
REFERENCES
[1] S. Kumar, V. Sharma, N. K. Singh, S. Sengar, and A. P. P. Y. Pawar, “Stock market forecasting using hybrid methodology,” Imperial
Journal of Interdisciplinary Research, vol. 2, pp. 16-20, May 2016.
[2] F. Mirzaei, H. Javedani, R. Enayatifar, F. Gadelha, M. Mahmud, and T. Eslami, “Stock market forecasting by using a hybrid model of exponential fuzzy time series,” International Journal of Approximate
Reasoning, vol. 70, pp. 79-98, Mar. 2016.
[3] M. Qiu and Y. Song, “Predicting the direction of stock market index movement using an optimized artificial neural network model,” PLoS
One, vol. 11, pp. 1-11, May 2016.
[4] A. V. Sharma, “Stock market forecasting using fuzzy logic,” Master thesis, University of San Diego, California, USA, 2016.
[5] H. Grigoryan, “A stock market prediction method based on support vector machines (svm) and Independent Component Analysis (ICA),”
Database Systems Journal, vol. 7, pp. 12-21, 2016.
[6] J. Sen and T. D. Chaudhuri, “A framework for predictive analysis of stock market indices-A study of the Indian auto sector,” Calcutta
Business School (CBS) Journal of Management Practices, vol. 2, pp.
1-19, Dec. 2016.
[7] M. Hsu, S. Lessmann, M. Sung, T. Ma, and J. E. V Johnson, “Bridging the divide in financial market forecasting: Machine learners vs. financial economists,” Expert Systems with Applications, vol. 61, pp. 215-234, Nov. 2016.
[8] P. D. Azar and A. W. Lo, “The wisdom of Twitter crowds: Predicting stock market reactions to FOMC meetings via Twitter feeds,”
Journal of Portfolio Management, vol. 42, pp. 123-134, Mar. 2016.
[9] T. Dimpfl and S. Jank, “Can internet search queries help to predict stock market volatility?,” European Financial Management, vol. 22, pp. 171-192, Mar. 2016.
[10] H. Lee, D. C. Ng, T. Lau, and C. Ng, “Forecasting stock market volatility on Bursa Malaysia plantation index,” International Journal
of Finance and Accounting, vol. 5, pp. 54-61, 2016.
[11] R. Kothari, “The forecasting power of the volatility index: Evidence from the Indian stock market,” IRA-International Journal of
Management and Social Sciences, vol. 4, pp. 230-243, Aug. 2016.
[12] N. Hosseinioun, “Forecasting outlier occurrence in stock market time series based on wavelet transform and adaptive ELM algorithm,”
Journal of Mathematical Finance, vol. 6, pp. 127-133, Feb. 2016.
[13] I. M. Yassin, “Nonlinear auto-regressive model structure selection using binary particle swarm optimization algorithm,” Phd thesis, Universiti Teknologi MARA, Selangor, Malaysia, 2014.
[14] I. M. Yassin, M. N. Taib, and R. Adnan, “Recent advancements and methodologies in system identification: A review,” Scientific
Research Journal, vol. 1, pp. 14-33, 2013.
[15] N. Mohamad, F. Zaini, A. Johari, I. Yassin, and A. Zabidi, “Comparison between Levenberg-Marquardt and scaled conjugate gradient training algorithms for breast cancer diagnosis using MLP,” in Proc. CSPA'10, 2010, p. 1.
[16] I. M. Yassin, A. Zabidi, M. S. A. M. Ali, N. M. Tahir, H. A. Hassan, H. Z. Abidin and Z. I. Rizman, “Binary Particle swarm optimization structure selection of nonlinear autoregressive moving average with exogenous inputs (NARMAX) model of a flexible robot arm,” International Journal on Advanced Science,
Engineering and Information Technology, vol. 6, pp. 630-637, Oct.
2016.
[17] M. N. M. Nor, R. Jailani, N. M. Tahir, I. M. Yassin, Z. I. Rizman, and R. Hidayat, “EMG signals analysis of BF and RF muscles in autism spectrum disorder (ASD) during walking,” International