http://www.sciencepublishinggroup.com/j/ijber doi: 10.11648/j.ijber.20170603.11
ISSN: 2328-7543 (Print); ISSN: 2328-756X (Online)
City Brand Competitiveness: Exploring Structural
Relationships Among City Brand Equity Elements in China
Kunjoon Lee
Graduate School of Management, Shanghai University, Shanghai, China
Email address:
[email protected]To cite this article:
Kunjoon Lee. City Brand Competitiveness: Exploring Structural Relationships Among City Brand Equity Elements in China. International Journal of Business and Economics Research. Vol. 6, No. 3, 2017, pp. 32-39. doi: 10.11648/j.ijber.20170603.11
Received: April 10, 2017; Accepted: May 13, 2017; Published: May 16, 2017
Abstract:
Majority of cities in the developing and transitional parts of the world, being a global city has turned into a primary goal. With this trend, managing a brand asset of a city has become an important task for countries, especially China. Therefore, the study explores the causality between the city brand equity factors, and clarifies the correlation between city brand identity and city brand loyalty. Survey with the size of 300 was gathered to be analyzed. Through a rigorous instrument development process, the following five construct were identified: brand awareness, brand image, perceived quality, brand identity, and brand loyalty. The instrument was proven to have a good fit, reliability, and validity. Three factors (brand awareness, brand image, perceived quality) were analyzed on how it affects brand identity and the effect of brand identity on brand loyalty. The purpose of this paper is to provide preliminary strategical data for city development and marketers in China.Keywords:
City Competitiveness, City Brand, Brand Equity, Brand Management1. Introduction
Today, 54 per cent of the world’s population lives in urban areas, a proportion that is expected to increase to 66 per cent by 2050. Projections show that urbanization combined with the overall growth of the world’s population could add another 2.5 billion people to urban populations by 2050, with close to 90 percent of the increase concentrated in Asia and Africa. [1] These city residents are generating more than 80 per cent of global GDP. [2] This is the highest in the history of mankind and the numbers are still growing dramatically.
Therefore, managing urban places has become one of the most important urban management challenges of the twenty-first century. Urban management in the first decade of the twenty-first century was characterized by the use of city marketing and the creation and development of city branding in order to find differentiating factors that enable cities to position themselves in the minds of their different target groups at home and abroad.
City competitiveness can thus be seen as the ability to compete on, possess and control the market in order to create value in a fast, economical manner, and to offer prosperity to its local residents. Economy, science and technology, as well as international influence are all vital driving force for
stronger city competitiveness. [3] Brand assets of different cities may be comprised of common elements. However, each asset of a city brand at a comprehensive level is unique, and this uniqueness becomes a critical managerial subject. [4] It has also been mentioned, by Doel and Hubbard, that competitive advantage arises from the strategic manipulation of local assets, and that the internal characteristics of a city are fundamental to the city’s competitiveness and success. [5]
In parallel with the competition for stronger brand powers among cities, the importance of effective brand management for cities is increasing. However, only limited numbers of studies have depicted urban competitiveness in transitional economies such as China [6], and seems that China’s urbanization and their rapidly changing status are need to be understood with diverse perspective.
developing world will make up 81 percent of urban humanity. [7] As of 2014, China has the largest urban population in the world, reaching up to 758 million urban dwellers, accounting for 20 per cent of the global total. [1]
Many of the previous studies have considered brand identity as the core of the development progress. Cai [8], Kaplanidou and Vogt [9], Konecnik and Go [10], and Konecnik and de Chernatony [11] have developed various theoretical frameworks to study the concept of brand identity, however no consensus has been reached. Therefore, Tsaur, Yen, and Yan [12] have suggested a scale for place brand identity from a customer based perspective and redefined the elements of brand identity more suitable for place branding. This research also follows this customer based perspective and develops the model further by defining the relationship between brand equity factors and brand loyalty which is suggested by Aaker [13] as one of the core element of brand equity.
Furthermore, as noted by Lever and Turok [14], cities do not compete in the same way that companies do, with profit maximization as the most important objective. Cities instead compete for residents, tourist, funding, event, investments, etc. However, many of the city brand research have focused on the tourism aspect only. This research takes into account both internal and external perspectives of brand creation [15] and focused on the consumption of a city brand in general covering residents, tourists, and businesses.
2. Literature Review
2.1. Research on City Brands in China
There is an extensive amount of literature on urban development in China [16]. For example, scholars that have focused on research areas relating to city branding in a Chinese setting have studied the connection between globalization and urban development; place promotion and city image [17] [18] [19], place-making and the planning process of brands in Chinese cities [20] [21].
2.2. The Conceptual Framework
2.2.1. Brand Awareness
Aaker defines awareness as the strength of a brand’s presence in the consumer’s mind. [22] Keller explains that awareness goes through both brand recognition and recall. There are many levels considering brand awareness. These levels range from brand recognition, to brand recall, to top of mind, to brand dominance, to brand knowledge, and to brand opinion. [23] As one moves from brand recognition to brand opinion, the brand awareness increases. [22] When a destination wants to be successful, it must first achieve tourist awareness and second a positive image [24]
Keller suggests three roles of brand awareness in consumer decision making. [23]
1) It is important that consumers think of the brand when they think about the product category
2) Brand awareness can affect decisions about brands in
the consideration set, even if there are essentially no other brand associations.
3) It affects consumer decision making by influencing the formation and strength of brand associations in the brand image
It can be said that most models of consumer behavior argues that awareness is a first and necessary. However, brand awareness will not always lead to purchase, because it results, at best, in product curiosity. [25]
H1: Brand awareness has a direct effect on brand identity in consuming a city brand.
2.2.2. Brand Image
City image has been studied since 1950s, and Boulding was the first person to define city image. He defined it as ‘a comprehensive outcome of subjective minds and experiences’. [26]
Kevin Lynch, in his book ‘The image of the city’, states that the contents of city images which are related to physical forms, can conveniently be classified into five types of elements: paths edges, districts, nodes, and landmarks. Even though his analysis conducted limited itself to the effects of physical, perceptible objects, it well explains the mechanism of city image. He explains that the image was not a precise, miniaturized model of reality, reduced in scale and consistently abstracted. As a purposive simplification, it was made by reducing, eliminating, or even adding elements to reality, by fusion and distortion, by relating and structuring the parts. It was sufficient, perhaps better for its purpose if rearranged, distorted, or even ‘illogical’. However distorted, there was a strong element of topological invariance with respect to reality. [27]
More recently, Kotler defined place image as a series of belies that a person of a group of people have towards that area, in order to show the place in a more preferable way. These series of beliefs imply that the character of a product can be explained by the sum of consumer’s assessments. [28] [29]
In overall, sum of consumer’s assessments through experience on a place leads to a belief and this creates image of that place.
H2: Brand image has a direct effect on brand identity in consuming a city brand.
2.2.3. Perceived Quality
Quality is a consumer’s subjective opinion on the extent to which particular product or service will meet his expectations. [13] It therefore is about consumer’s judgement about a product’s overall excellence or superiority. [30]
Gill and Dawra explains that it is important consumers perceives a brand to be high at its quality, since it will directly relate to the brand preference and increase brand equity pie. [31]
quality is a vital element affecting consumer behavior [32]. The research was designed to infuse the above-mentioned perspectives. In this study, quality is represented by how people feel and judge that a brand is of the best quality and is consistent with quality.
H3: Perceived quality has a direct effect on brand identity in consuming a city brand.
2.2.4. Brand Identity
Brand identity is created by organizations and reflects the contribution of all brand elements to image and awareness. [33] Brand identity also provides a direction or meaning to the brand and is central to a brand’s strategic vision. [22] Also, it differentiates the brand from its competitors and signifies what the organization will and can do over time. [34]
Taking the frame of brand identity onto cities, it can largely be explained in two aspects, conformity and individuality. Conformity is about changes and continuity. Regardless of the changes that are happening in the city, people think that ‘there is something constant about this city’. As the time goes, people will identify themselves to this continuity and think ‘this city and I have are alike’ or ‘my character fits this city well’. On the other hand, there is individuality. Individuality is about when people find the city unique and superior in a way. Therefore, people are more likely to think that ‘this city is special and better than other cities’. [35]
Moreover, the identity of a city brand is about being distinguishable from other cities. It is stretched from the city’s unique appearance and characters. Thus, it is not only about the past but also about the process itself. [36]
In this research, the questions were designed to measure how people identity to the city characters and see how people distinguish one city from another.
H4: Brand identity has a direct effect on brand loyalty in consuming a city brand.
2.2.5. Brand Loyalty
Aaker defines brand loyalty as “attachment that a customer has to a brand”. [13] Another definition is by Oliver, that brand loyalty is “an attained state of enduring preference to the point of determined defense”. [37] Mellens cited the definition of brand loyalty as “the biased behavioral response expressed over time by some decision making unit with respect to one or more alternative brands out of a set of such brands and is a function of psychological process. [38]
The concept of brand loyalty has been extensively studied in the marketing literature. Keller operationalized brand loyalty as the main source of customer-based brand equity. [39] Opperman argued that loyalty should not be neglected when examining destination brands. [40] However, in terms of measurement, a review of the literature highlights the lack of clarity about the conceptual nature of brand loyalty. This has resulted in the use of a variety of measurement tools producing inconsistent findings [41]. As Gill and Dawra has incorporated in their research, this paper follows the definition which consist both the behavioral and attitudinal
dimensions. [31] Behavioral loyalty means that there is repeated purchase by the consumers, which can be translated as repeated visit in this paper. Attitudinal loyalty means the attitude, beliefs, and intentions of the consumer towards the brand, such as feelings.
H5-1: Brand identity mediates the effect between brand awareness and brand loyalty
H5-2: Brand identity mediates the effect between brand image and brand loyalty
H5-3: Brand identity mediates the effect between perceived quality and brand loyalty
3. Analysis
3.1. Methodology
Since the major purpose of this research is to clarify the relationships between brand equity factors in consumers’ perceptions towards Chinese cities, a self-structured questionnaire was developed to collect the required primary data from the visitors and residents. The questionnaire is designed to contain five main distinct sections, each of which consisted relevant questions pertaining different parts of the study. Questionnaires were made in Chinese and English version and were distributed on both online and offline.
In order to list the Chinese cities for the survey, top ten cities has been chosen according to the ‘Chinese cities’ brand power index 2015 ( 国 国)”. This is an annual report by Tsinghua University research center for nation brand which measures the brand power of cities in China. The selected cities were Beijing, Shanghai, Guangzhou, Chengdu, Chongqing, Wuhan, Nanjing, Hangzhou, and Tianjin.
Initially, 30 items were rewritten to produce an original questionnaire. The wordings of all items were designed with the meanings of each brand equity concept. Respondents indicated their agreement with each item, using a five-point Likert-type scale ranging from five (strongly agree) to on (strongly disagree). Several questions were included to obtain the respondents’ demographic attributes and visit information. Prior to data collection, a pilot survey was conducted in order to ensure the reliability of the questionnaire. The questionnaire was distributed to 65 tourists in Shanghai. Based on the survey results, several items were revised or deleted. Finally, 23 items were selected in the final format.
Survey data were collected from 24 September 2016 to 8 October 2016. The online questionnaires were distributed through major social networking service (QQ, Wechat). The offline questionnaires samples were collected randomly from populated districts in Shanghai (Baoshan, Jing’an, and Huangpu). A total of 300 of the collected samples were found valid for analysis.
Table 1. Profile of respondents.
Variables Description N (%)
Nationality Chinese 193 (64.3)
Foreign 107 (35.7)
Current residence
Beijing 11 (3.7)
Shanghai 230 (76.7)
Guangzhou 2 (0.7)
Chengdu 6 (2.0)
Chongqing 6 (2.0)
Nanjing 2 (0.7)
Hangzhou 4 (1.3)
Others 39 (13.0)
Gender Male 96 (32.0)
Female 204 (68.0)
Age
Under 20 27 (9.0)
20 ~ 29 200 (66.7)
30 ~ 39 58 (19.3)
40 ~ 49 13 (4.3)
More than 50 2 (0.7)
Marriage Single 241 (80.3)
Married 59 (19.7)
Education
Elementary/ Secondary/High school 14 (4.7)
Undergraduate 193 (64.3)
Post graduate or higher 93 (31.0)
Occupation
Student 173 (57.7)
Government organization 24 (8.0)
Company employee 65 (21.7)
Self-employed 22 (7.3)
Others 16 (5.3)
Income level
Less than $600 137 (45.7)
$600~$1000 48 (16.0)
$1000~$1500 41 (13.7)
$1500~$3000 45 (15.0)
$3000~$4500 14 (4.7)
More than $4500 15 (5.0)
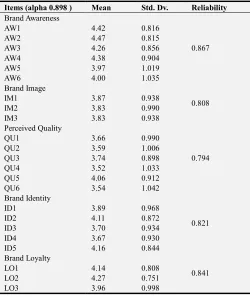
Table 2. Reliability analysis.
Items (alpha 0.898 ) Mean Std. Dv. Reliability Brand Awareness
0.867
AW1 4.42 0.816
AW2 4.47 0.815
AW3 4.26 0.856
AW4 4.38 0.904
AW5 3.97 1.019
AW6 4.00 1.035
Brand Image
0.808
IM1 3.87 0.938
IM2 3.83 0.990
IM3 3.83 0.938
Perceived Quality
0.794
QU1 3.66 0.990
QU2 3.59 1.006
QU3 3.74 0.898
QU4 3.52 1.033
QU5 4.06 0.912
QU6 3.54 1.042
Brand Identity
0.821
ID1 3.89 0.968
ID2 4.11 0.872
ID3 3.70 0.934
ID4 3.67 0.930
ID5 4.16 0.844
Brand Loyalty
0.841
LO1 4.14 0.808
LO2 4.27 0.751
LO3 3.96 0.998
Table 3. KMO and Barlett’s test.
Kaiser-Meyer-Olkin measure of sampling adequacy 0.856
Bartlett’s test of sphericity
Approx. Chi-square 3396.751
Df 253
Sig. 0.000
3.2. Results
3.2.1. Reliability Coefficient
Reliability coefficient tested by using Cronbach’s alpha analysis. In order to measure the reliability for a set of two or more constructs, Cronbach alpha is commonly used method where alpha coefficient values range between 0 and 1 with higher values indicating higher reliability among the indicators. [42] Hence, 1 is the highest value that can be achieved. According to Table 2, the total scale of reliability for this study varies from 0.794 ~ 0.867 indicated that all factors were found to be reasonably reliable with Cronbach’s alpha values of greater than 0.70. [43] The reliability of this study is substantial in every perspective.
3.2.2. Confirmatory Factor Analysis
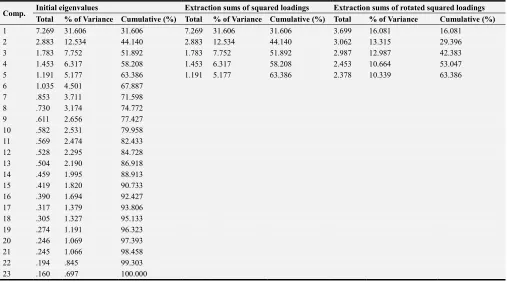
Samples from 310 respondents had been thoroughly analyzed and the outputs of the results have been clearly explained in this section. Applying SPSS, Principal Component Analysis (PCA) was carried out to explore the underlying factors associated with 23 items. The constructs validity was tested applying Barlett’s Test of Sphericity and the Kaiser-Mayer-Olkin (KMO) measure of sampling adequacy analyzing the strength of association among variables. In order to verify whether the data are suitable of using factor analysis, the KMO measure of sampling adequacy was computed beforehand. KMO is used to assess which variables to drop from the model due to multicollinearity problem. The value of KMO varies from 0 to 1, and KMO overall should be 0.60 or higher to perform factor analysis. If not achieved, it is necessary to eliminate the variables with lowest values and adjust the KMO overall. Result of the Barlett’s test of sphericity and the KMO revealed that both were highly significant and eventually concluded that these variables was suitable for the factor analysis (Table 3). Deciding upon the number of factors that can be retained is difficult but initial runs- based on eigen values showed 5 factors. To determine the minimum loading necessary to include an item in its respective constructs, Hair et al. (1992) suggested that variables with loading greater than 0.30 is considered significant, loading greater than 0.40 more important, and loading 0.0 or greater are very significant. In this research, the general criteria were accepted items with loading of 0.60 or greater. Not a single factor has dropped out which means the factor analysis was a success. The result of Table 4 highlighted the amount of variance explained by these five factors (63.386%).
The findings of this study indicate that each of the five dimensions (brand awareness, brand image, perceived quality, brand identity, and brand loyalty) were homogeneously
loaded to the different factors. This means that each of the items was successfully loaded into five different factors.
Table 4. Total variance explained.
Comp. Initial eigenvalues Extraction sums of squared loadings Extraction sums of rotated squared loadings Total % of Variance Cumulative (%) Total % of Variance Cumulative (%) Total % of Variance Cumulative (%)
1 7.269 31.606 31.606 7.269 31.606 31.606 3.699 16.081 16.081
2 2.883 12.534 44.140 2.883 12.534 44.140 3.062 13.315 29.396
3 1.783 7.752 51.892 1.783 7.752 51.892 2.987 12.987 42.383
4 1.453 6.317 58.208 1.453 6.317 58.208 2.453 10.664 53.047
5 1.191 5.177 63.386 1.191 5.177 63.386 2.378 10.339 63.386
6 1.035 4.501 67.887
7 .853 3.711 71.598
8 .730 3.174 74.772
9 .611 2.656 77.427
10 .582 2.531 79.958
11 .569 2.474 82.433
12 .528 2.295 84.728
13 .504 2.190 86.918
14 .459 1.995 88.913
15 .419 1.820 90.733
16 .390 1.694 92.427
17 .317 1.379 93.806
18 .305 1.327 95.133
19 .274 1.191 96.323
20 .246 1.069 97.393
21 .245 1.066 98.458
22 .194 .845 99.303
23 .160 .697 100.000
3.2.3. Validity, Reliability, and Invariance Test
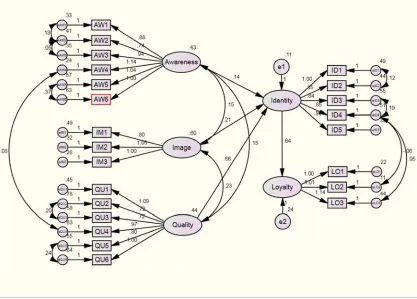
Before analyzing the variable model, the validity and reliability of the constructs must be calculated in advance. Uni-dimensionality measures must also be established before their convergent and discriminant validity are assessed. [44] Uni-dimensionality measures the extent to which the items in a scale all measure the same construct. [45] Confirmatory Factor Analysis (CFA) can be used to assess uni-dimensionality. A CFA was conducted for each of the five factors to determine whether the 23 indicators measured the construct they were assigned adequately. The SEM program AMOS 18.0 was used throughout the study to conduct the analyses. Empirical evidence in CFA (and SEM in general) is generally assessed using criteria such as the CMIN/DF (minimum discrepancy/degrees of freedom), RMR (root mean square residual), RMSEA (root mean square error of approximation), GFI (the goodness of fit index), and CFI (comparative fit index).
The structural equational model (SEM) was examined to test the relationship among the constructed model using AMOS 18.0. The statistical results show CMIN/DF = 2.001, RMR = 0.05, GFI ≒ 0.90 (0.89), CFI = 0.934, HI 90 = 0.923, RMSEA = 0.058 (Tale 6). It has been verified that the model has a good fit.
3.3. Hypothesis Testing
Figure 1 depicts the full model of the four paths
hypothesized in the model; all the paths were significant at p < 0.05. Every hypothesisses, except H1, showed great significance at p < 0.00.
First, it is accepted that brand awareness directly effects brand identity when consuming a city brand. H1 is accepted with the percentage of p = 0.019. However, it is shown that this factor had comparatively less effect than other two factors affecting brand identity. Still, it is fair to say that high brand awareness leads to stronger brand identity when consuming a city brand.
The statistical findings also revealed that brand image has a direct effect on brand identity when consuming a city brand. H2 is accepted at p < 0.00. Positive brand image of a city can lead to a stronger brand identity.
Regarding H3, perceived quality has a direct effect on brand identity in consuming a city brand. H3 is also accepted at p < 0.00. Experience of a city can lead to building a stronger brand identity of a city.
H4 was accepted at p < 0.00. The brand identity has a direct effect on brand loyalty. Table 7 summarizes the results mentioned above from H1 to H4.
Table 5. Factor loading matrices.
Descriptions F1 F2 F3 F4 F5 Awareness
AW1 .787
AW2 .767
AW3 .707
AW4 .823
AW5 .747
AW6 .711
Image
IM1 .674
IM2 .814
IM3 .830
Quality
QU1 .596
QU2 .668
QU3 .659
QU4 .656
QU5 .635
QU6 .684
Loyalty
LO1 .767
LO2 .782
LO3 .665
Identity
ID1 .743
ID2 .570
ID3 .713
ID4 .772
ID5 .621
Extraction method: principal component analysis. Based on five- factors specification.
Rotation method: Varimax with Kaiser Normalization. Loadings that are 0.50 or less are not shown
Table 6. Fit measures.
Fit measures Main model
CMIN/DF 2.001
RMR 0.05
GFI ≒ 0.90 (0.89)
CFI 0.934
HI 90 0.923
RMSEA 0.058
Table 7. Standard estimation of the main model.
Standardized regression weight Estimate S.E. C.R. P H1 Awareness (AW) → Identity .138 .060 2.345 .019 H2 Image (IM) → Identity .659 .093 7.117 *** H3 Quality (QU) → Identity .245 .056 3.807 *** H4 Identity (ID) → Loyalty .656 .075 8.617 ***
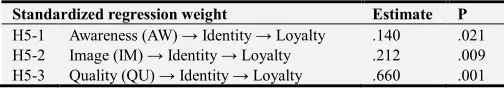
Table 8. Standard estimation of the mediated model.
Standardized regression weight Estimate P H5-1 Awareness (AW) → Identity → Loyalty .140 .021 H5-2 Image (IM) → Identity → Loyalty .212 .009 H5-3 Quality (QU) → Identity → Loyalty .660 .001
4. Conclusion
A city’s brand is increasingly considered as an important asset for urban development and an effective tool for cities to distinguish themselves and set marketing strategies aiming to generate revenue from tourism and secure investment, as well as attract qualified workers. This research aimed to reveal the relationship between brand equity factors of Chinese cities and find implications for the potential marketing strategies.
The result of this study provides several implications. Firstly, from the previous literatures on brand equity, five factors were selected. Within the brand equity factors, brand awareness, brand image, and perceived quality were chosen as the factors which affect brand identity. The level of influence among the three brand equity factors was greatest in the order of brand image, perceived quality, and brand awareness. Higher brand awareness, brand image, and perceived quality will lead to building a stronger brand identity. However, within the brand equity factors, it is possible to conclude that brand identity is mostly affected by the image and least by the recognition of a city. City brand marketers should provide consistent effort to enhance the experience that one person receives in terms of a city. Thus, not only tangible assets but also intangible assets, such as brand image, are crucial when developing a strong brand identity.
Secondly, the study reveals the effect of brand identity on brand loyalty. It is possible to conclude that possessing a strong brand identity will strengthen loyalty of residents, travelers, and businesses regarding a specific city. Both familiarity of a city and individuality to a city is creating better condition for higher brand loyalty to a city.
Lastly, a mediating role of brand identity between awareness, image, quality and loyalty has been tested. All
three variables showed significance affecting brand loyalty. This test has implied that among three variables, perceived quality showed the most significance affecting brand loyalty mediated by brand identity. Considering the fact that brand image was the most significant factor affecting brand identity, the results conclude that the decisive factor which eventually leads to brand loyalty is perceived quality of a brand.
This research had several limitations. The offline survey was conducted only in Shanghai. Even though online survey was distributed nationwide, the resultant measurement scale is limited. Moreover, 35 percent of the respondents were Non-Chinese, whom were from different countries and spoke various languages. The questionnaires were provided in two languages age: simplified Chinese and English. The respondents language skills varied and may had insufficient understanding of the questions provided.
In addition, for future research, further exploratory research needs to be conducted to establish other factors that build brand equity, and the interrelationships between brand equity factors need to be studies in detail.
References
[1] United Nations Department of Economic and Social Affairs/Population Division, World Urbanization Prospects: The 2014 Revision, 2014, pp. 21
[2] UN-Habitat The World Cities Report, Urbanization and Development: Emerging Futures, 2016
[3] Jiang and Shen, ‘Measuring the Urban Competitiveness of Chinese cities in 2000, Cities, 27, 307-314
[4] Soon-Hwa An, A Study On The Effect of City Brand Personality on Relationship Quality and Loyalty, 2008
[5] M. Doel and P. Hubbard, ‘Taking World Cities Literally: Marketing The City In A Global Space Of Flows’, 2002, City, 6(3), 351-368)
[6] Jiang Y. and Shen J., Measuring The Urban Competitiveness Of Chinese Cities In 2000, 2010, Cities, 27, pp.307-314
[7] McKinsey Global Institute, Urban World: Mapping The Economic Power of Cities, 2011, pp5-6.
[8] Cai, A., Cooperative Branding For Rural Destinations, Annals of Tourism Research, 2002, 29(3), pp. 720-742.
[9] Kaplanidou K., & Vogt C., Destination branding: Concepts and Measurement. Working paper, Michigan State University, Department of Park, Recreation and Tourism Resources, 2003.
[10] Konecnik M. and Go F., Tourism destination brand identity: The case of Slovenia, Journal of Brand Management, 2008, 15(3), pp. 177-189
[11] Konecnik M., & de Chernatony L., Developing and applying a place brand identity model: The case of Slovenia, Journal of Business Research, 2013, 66(1), pp.45-52.
[13] Aaker, D. A., Managing Brand Equity, New York, NY: Free Press, 1991.
[14] Lever W. F. and Turok I., Competitive Cities: Introduction to the Review, Urban Studies, 1999, Vol. 36, Nos 5-6, pp.791-793.
[15] Park O. J., Cai L. A. and Lehto X. Y., Bridgin Tourism Theory and Practice: Chapter 6 Collaborative Destination Branding, Emerald Group Publishing Limited, 2009, Volume 1, pp.75-86
[16] Xu, J. and Yeh, A, City repositioning and competitiveness building in regional development: new development strategies in Guangzhou, International Journal of Urban and Regional Research, 2005, 29, pp. 283-308.
[17] Wu F., Place Promotion in Shanghai, PRC, Cities, 2000, 17(5), pp. 349-361
[18] Wu F., Globalization, place promotion and urban development in Shanghai, Journal of Urban Affairs, 2003, 25(1), pp.55-78
[19] Zhu H., Qian J., and Gao Y., Globalization and the production of city image Guangzhou’s metro station advertisements, 2011, Cities, 28(3), pp. 221-229.
[20] Friedman, J, Reflections on place and place-making in the cities of China, International Journal of Urban Regional Research, 2007, 31(2), pp. 257-279.
[21] Karvelyte, K. and Chiu J-H, Planning process of city brands: a case study of Taipei city, Place Branding and Public Diplomacy, 2011, 7(4), pp. 257-270.
[22] Aaker, D. A, Measuring brand equity across products and markets, California Management Review, 1996, 38(3), pp. 102-120.
[23] Keller, K. L., Conceptualizing, measuring and managing customer-based brand equity, Journal of marketing, 1993, 57(1), pp. 1-14.
[24] Milman, A., and A. Pizam, The role of awareness and familiarity with a destination: The central Florida case. Journal of travel research, 1995, 33(3), pp. 21-27.
[25] Fesenmaierm D., C. Vogt, and Stewart, Investigating the influence of welcome center information on travel behavior. Journal of travel research, 1993, 32(3), pp. 47-51.
[26] Boulding, K. E., The Image: Knowledge in Life and Society, Ahn Arbor, MI : University of Michigan Press, 1956, pp. 1-18
[27] Kevin Lynch, The Image of the City, The MIT Press, Vol.11, 1960.
[28] Kotler, P., Principles of marketing, Prentice- Hall, 1986.
[29] Kotler, P., Analysis Planning. Implementation and Control. Marketing management, 1988.
[30] Zeithaml, V. A., Consumer perceptions of price, quality, and value: A means-end model and synthesis of evidence, Journal of Marketing, Vol. 52, No. 3, 1988, pp 3
[31] Gill M. S. & Dawra J., Evaluating Aaker’s sources of brand equity and the mediating role of brand image, Journal of targeting, Measurement and Analysis for marketing, 2010, Vol 18, 3/4, 189-198.
[32] Konecnik M., & Gartner W. C., Customer-based brand equity for a destination, Annals of Tourism Research, 2007 Vol. 34 No2, pp 400-421.
[33] Keller K. L., Strategic brand management: Building, measuring, and managing brand equity, Upper Saddle River, NJ: Prentice Hall, 1998.
[34] Wagner O., Peters M., and Schukert M, Internal branding in tourism destinations: The need for future research. Proceedings of the 4th World Conference for Graduate Research in tourism, Hospitality and Leisure, Antalya, Turkey, 2008, pp. 470-486.
[35] Yoo B. L., & Hwang K. W., Research on developing city culture environment, Seoul, Korea Arts & Culture Education Service, 1992.
[36] Chris Murray, Marketing sense of place: New approach to place marketing. Bournes Green, England. Comedia Publications, 2001.
[37] Oliver R. L., Whence consumer loyalty? Journal of Marketing, 1999, 63, pp.33-44.
[38] Mellens, M., Dekimpe, M. G. and Steenkamp, E. M., A review of brand-loyalty measures in marketing. Tijdschrigt voor Economie en Management, 1996, XLI (4): 07-553.
[39] Keller K. L., Brand Synthesis: The Multidimensionality of Brand Knowledge, Journal of Consumer Research, 2003, 29(4), pp.595-600
[40] Opperman, M, Tourism Destination Loyalty. Journal of Travel Research, 2000, 39, pp. 78-84.
[41] Odin Y., Odin N., and Valette-Florence P., Conceptual and operational aspect of brand loyalty: an empirical investigation, Journal of Business research, 2001, Vol. 53, Issue 2, pp. 75-84.
[42] Hair J. F., Anderson R. E., Tatham R. L., Black W. C., Multivariate Data Analysis, Macmillan: New York, 1992.
[43] Bagozzi, R. P., & Yi, Y., On the evaluation of structural equation models. Journal of the Academy of marketing science, 1988, 16(1), pp. 74-94.
[44] Anderson JC, Gerbing RV, “Some methods for repecifying measurement models to obtain unidimensional construct measurement”, 1982, Journal of Marketing Research., 19(4), pp. 453-460.