Published online August 30, 2013 (http://www.sciencepublishinggroup.com/j/ajtas) doi: 10.11648/j.ajtas.20130205.12
Efficiency of Neyman allocation procedure over other
allocation procedures in stratified random sampling
Olayiwola Olaniyi Mathew
1, Apantaku Fadeke Sola
1, Bisira Hammed Oladiran
2,
Adewara Adedayo Amos
31Department of Statistics, Federal University of Agriculture, Abeokuta, Ogun State, Nigeria 2Department of Mathematics, Lagos State Polytechnic, Ikorodu, Lagos State, Nigeria 3Department of Statistics, University of Ilorin
Email address:
[email protected] (O. M. Olayiwola)
To cite this article:
Olayiwola Olaniyi Mathew, Apantaku Fadeke Sola, Bisira Hammed Oladiran, Adewara Adedayo Amos. Efficiency of Neyman Allocation Procedure over other Allocation Procedures in Stratified Random Sampling. American Journal of Theoretical and Applied Statistics. Vol. 2, No. 5, 2013, pp. 122-127. doi:10.11648/j.ajtas.20130205.12
Abstract:
In sampling, we have interest in precision and in order to create the precision, we make use of prior knowledge of the population. We try to put the population into series of homogeneous groups and by this, the precision will be increased. When the population of interest can be divided into k homogeneous groups and the sample of observation is taken from each group, we have a stratified random sample and each group is called a stratum. The study was therefore designed to investigate the efficiency of Neyman allocation procedure over equal and proportional allocations. The data used for this research were primary data collected from ten Markets in Abeokuta, Ogun State, Nigeria on the prices of Peak Milk (Nigeria made). A stratified random sampling scheme was used in selecting 10 markets in Abeokuta, Ogun State, Nigeria. Each market stands as a stratum. From each stratum, independent sample was selected randomly based on equal, proportional and Neyman/Optimum allocation procedures. Statistic was obtained from each stratum and combined estimate of the separate statistic was also obtained for each of the allocation procedure. Considering the analysis and estimates obtained, the mean and variance under Neyman allocation procedure were 1356.672 and 21.45 respectively. For proportional allocation, the mean was 1349.3069 and variance was 38.98 while equal allocation gave mean of 1352 and variance of 170.3238. Neyman/Optimum allocation procedure gave the least variance. This was followed by Proportional allocation and Equal allocation. Neyman allocation procedure is the best selection procedure. Hence, for estimating the average and the variance of the prices of Peak Milk (Nigeria Made) in the markets in Abeokuta, of all the three sample allocation procedures considered in this paper, Neyman allocation procedure is the best and hence the most efficient.Keywords:
Efficiency, Stratified Random Sampling, Neyman Allocation, Procedure1. Introduction
Sampling methods are designed to provide valid, scientific and economical tools for research problems. According to Kish (1965) and Hunt and Tyrell (2004), sampling plays a vital role in research design involving human population and commands increasing attention from social scientists, chemists, engineers, accountants, biologists and medical practitioners. Sampling problems are in general to practitioners engaged in marketing, commerce, industry, public health, biostatistics, education, public administration, economics, sociology, anthropology, psychology, political Science and even social workers.
Sampling methods are developed as means to an end
would result in different standard errors, and choosing the design with the smallest error is the principal aim of sampling design.
An effective sampling technique within a population represents an appropriate extraction of useful data which provides meaningful knowledge of the important aspects of the population (Garcia and Cortez, 2006). Probability samples are usually designed to be measurable, that is, so designed that statistical inference to population values can be based on measures of variability, usually standard errors, computed from the sample data.
In general, there is need to devise a sampling scheme which is economical and easy to operate, that yields unbiased estimates, and minimizes the effects of sampling variation.
Usually in sample surveys more than one population characteristics are estimated and these characteristics may be of conflicting nature. Stratified sampling has been designed to ensure that all important views are represented in samples. Stratification is a means of sample design by which the population of interest is divided into groups, called strata, according to some known characteristic(s). Stratified sample designs are employed for several reasons. These include: to increase the precision of estimates for the whole population for one or more key data items being collected in the survey, to obtain more precise estimates for interesting domains, to allow the use of different sampling, non-response adjustment, editing, or estimation methods for domains with differing characteristics affecting the choice of method, and to facilitate administration of the survey. Stratified sampling is always more restrictive than simple random sampling.
Moreover, in the context of stratified sampling, some multivariate approaches have been proposed whereby the sample size and its allocation within strata take diverse characteristics into consideration (Sukhatme et al., 1984 and Arthanari and Dodge 1981). The multivariate stratified sample design is different with two steps from the univariate stratified sample design. The first step is to decide strata using stratified variables which are multivariate. The second step is to decide a sample size and the optimal allocation, that is, to decide a sample size of each stratum using interest variables which are multivariate.
There are many methods for allocation to strata in the multivariate stratified sample design. The first method is the proportional allocation, and the second is the multivariate allocation using one interest variable which is selected of multivariate interest variables. The third is a compromise allocation which is a weighted average of sample size of strata using individual allocation (Cochran, 1977; Chatterjee, 1972). The fourth is the optimal allocation for a loss function of characteristic values which combine variances of all variables (Kish, 1976; Sukhatme
et al, 1984; Bethel, 1989; Khan and Ahsan, 2003; and Diaz-Garcia and Cortez, 2008).
In multivariate stratified sample design, correlation is considered among interest variables. The first method is a
compromise allocation weighted by correlation coefficients or covariances, and the second method is the optimal allocation for a loss function of characteristic values of variance-covariance matrix. A variation of one variable with lower correlation is more important than others. The third method is to use weighted object function by the importance of interest variables in a mathematical programming and of importance is the error of estimation, the correlation coefficient or the covariances. The multivariate stratified sample design is used for multi-objective surveys in which there is difference among the importance of interest variables.
The problem of allocation with more than one characteristic in stratified sampling is conflicting in nature, as the best allocation for one characteristic will not in general be best for others. Some compromise must be reached to obtain an allocation that is efficient for all characteristics. This problem was first considered by Neyman (1934), Dalenius (1957), Ghosh (1958), Kokan and Khan (1967), Khan and Ahsan (2003), Khan, Jahan and Ahsan (1997). Attempts were made for an acceptable allocation by either suggesting new criteria or exploring existing criteria further.
One of the problems of stratification is that loss in precision in the estimate of a characteristic increases if the characteristic in a stratum is not internally homogenous. To refrain from the increase in loss of precision is to assign a maximum weight to the jth characteristic.
2. Data Used
The data used for this research were primary data collected from ten Markets in Abeokuta, Ogun State, Nigeria on price of Peak Milk (Nigeria made).
3. Methodology
Theorem:
1. The average of stratified sampling is:
∑ (1)
2. The variance of stratified sampling:
Recall V ( ) = (SRSWOR)
( ) = (∑ )
∑ (2)
1
Where is the sampling factor per stratum and " "
If the stratified sampling is carried out under proportional allocation, the variance for mean is derived below:
Recall: # (4)
( ) ∑ $ (5)
%
1 & 1'
1 &
# 1'
1 (
# 1)
1 & 1'
&1 1' *∑ ∑
& '
1
+ ∑
(6)
If allocation of sample over strata is done using Neyman allocation procedure, the variance for the mean of the stratified random sample is derived below. (If the cost of
selecting sample per stratum is equal). Recall:
, -∑./0, - #
(Since the costs are equal)
∑ $
(7)
∑ ( 1)
1
"
∑ #
1
1 ∑ # 1 $, - # #
∑ ( ∑ 2 2 #
2 # )
1
# ∑ 1
∑./02 ∑./02 ! (8)
345 4634 5 7 287
Proof
Recall: 7 287 (9)
4634 ∑ ∑
34 ∑ ∑
From analysis of variance:
∑1:/09: 9! If N; ∞ (10)
= >
=
= >
=
> =
2 =
=
= >
=
Recall that: ∑= =
( 1) ∑= =
@ 1 >
=
1 >∑ ∑=
If ; A BC * 1
>∑ ∑=
>∑ ∑=
Recall D ED F
∑ > ∑./0∑1:/0F F (11)
= G∑ 2 ! ∑ 2 ! H > G +H ∑ ∑= F F! (12)
D ED I J KJ
Now compare the variance of optimal/Neyman allocation
with the variance of proportional allocation under stratified sampling.
∑ 2 ! ∑ 2 ! ∑./02 ! ∑ 2 !> ∑ 2 ! ∑ 2 ! ∑./02 !> ∑ 2 ! 0
∑
0
Multiply through by n
0
Since ∑ ∑ I 0
∑ I ∑ (13)
Hence J KJ I KJM
@ KJM 5 J KJ 5 D ED.
4. Summary of Results
In the selection of sample in each stratum, for equal allocation, 16 samples were taking from each stratum making total of 160 samples across 10 strata (markets). For proportional allocation, sample size varies depending on the total number of milk sellers in each market. Cost of selecting sample from each stratum (market) was put into consideration in optimum allocation. Few samples were selected from the market where the cost of sample selection is high, while many samples were selected from where there is low cost of sample selection. The results obtained are as shown in the table 1.
Table 1: Stratification of abeokuta markets into ten strata with corresponding sample size for different allocation procedures
Strata
Equal allocation sample size
Proportional allocation sample size
Neyman/optimum allocation sample size
1 16 14 17
2 16 20 8
3 16 13 29
4 16 10 24
5 16 25 13
6 16 14 22
7 16 18 16
8 16 20 10
9 16 14 17
10 16 12 4
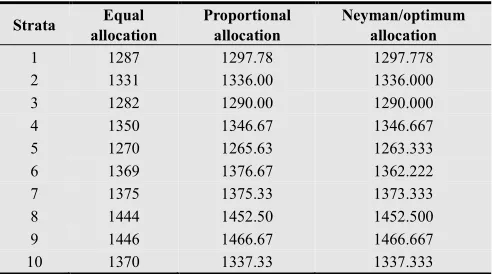
Table 2: Mean per stratum based on different allocation procedures
Strata Equal allocation
Proportional allocation
Neyman/optimum allocation
1 1287 1297.78 1297.778
2 1331 1336.00 1336.000
3 1282 1290.00 1290.000
4 1350 1346.67 1346.667
5 1270 1265.63 1263.333
6 1369 1376.67 1362.222
7 1375 1375.33 1373.333
8 1444 1452.50 1452.500
9 1446 1466.67 1466.667
Table 3: Variance per stratum based on different allocation procedures
Strata Equal allocation
Proportional allocation
Neyman/optimum allocation
1 1801.0687 1532.95 1535.948
2 1128.4896 2268.57 2268.571
3 2076.6249 1,057.14 1057.143
4 6666.6245 8380.95 8380.952
5 2333.2764 1906.25 2309.524
6 5248.8576 3317.65 2630.065
7 1805.4851 1698.09 1738.095
8 2471.0841 2500.00 2500
9 6048.7951 6494.12 6494.118
10 30064.092 21878.09 31878.1
Table 4: Combine mean for stratified sampling using different allocation procedures
Neyman/optimum 1356.6720
Proportional 1349.3069
Equal 1352.0000
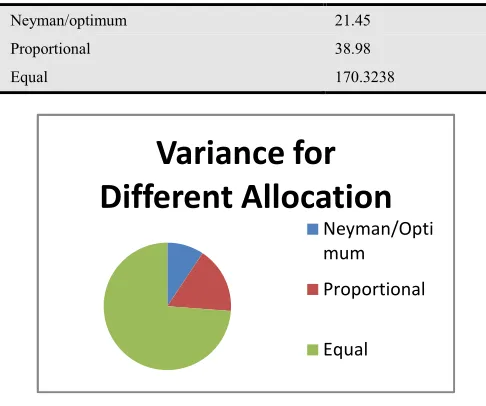
Table 5: Combine variance for stratified sampling using different allocation procedures
Neyman/optimum 21.45
Proportional 38.98
Equal 170.3238
5. Discussion of Results
In the selection of sample in each stratum, for equal allocation, 16 samples were taking from each stratum
making total of 160 samples across 10 strata (markets). For proportional allocation, sample size varies depending on the total number of milk sellers in each market. Cost of selecting sample from each stratum (market) was put into consideration in optimum allocation. Few samples were selected from the market where the cost of sample selection is high, while many samples were selected from where there is low cost of sample selection.
The mean and variance under Neyman allocation procedure were 1356.672 and 21.45 respectively. For proportional allocation, the mean was 1349.3069 and variance was 38.98 while equal allocation gave mean of 1352 and variance of 170.3238. Neyman/Optimum allocation procedure gave the least variance. This was followed by Proportional allocation and Equal allocation. Neyman/Optimum allocation procedure is the best selection procedure in this paper.
Fig1. Variance for different allocation procedures
6. Conclusion
Finally, for estimating the average and the variance of the prices of Peak Milk (Nigeria Made) in the markets, out of all the three sample allocation procedures considered in this paper, Neyman/Optimum allocation procedure is the best and hence the most efficient.
References
[1] Kish, L. 1965. Survey sampling. New York, Wiley.
[2] Hunt, N. and Tyrell, S. (2004), Stratified sampling. Coventry UniversityPress.
http://www.coventry.ac.uk/ec/¬nhunt/meths/strati.html (accessed February 28, 2011)
[3] Arthanari, T.S and Dodge, Y. 1981. Mathematical programming on statistics. A Wiley-Interscience, Publication, John Wiley & Sons Inc.
[4] Bethel, F. 1989. Bayes and Minimax prediction in finite population. Journal of Statistical Planning, 60, 127 – 135.
[5] Chatterjee, S. 1972. A study of optimal allocation in multivariate stratified surveys. Skand Akt. 73, 55 – 57.
[6] Cochran, W. G. 1977. Sampling Techniques (3rd Edition), New York, Wiley.
Mean for Different
Allocation
Neyman/Optim um
Proportional
Variance for
Different Allocation
Neyman/Opti mum
Proportional
[7] Dalenius, T. 1957. Sampling in Sweden: Contributions to the methods and theories of sample survey practice,
Almavist and wicksell, Stockholm.
[8] Diaz-Garcia, J.A and Cortez, L.U. 2008. Multi-objective optimisation for optimum allocation in multivariate stratified sampling. Survey Methodology, Vol. 34, No 2, 215-222.
[9] Ghosh, S.P., 1958. A note on Stratified Random Sampling with Multiple Characters. Col.Stat. Bull, 8, 81-89.
[10] Hunt, N. And Tyrell, S. 2004. Stratified sampling. Coventry UniversityPress.
http://www.coventry.ac.uk/ec/~nhunt/meths/strati.html (accessed February 28, 2011).
[11] Khan, M.G.M and Ahsan, M.J. 2003. A note on Optimum Allocation in Multivariate Stratified Sampling. South
Pacific Journal Natural Science, 21, 91-95.
[12] Khan, M.G.M, Jahan, N. and Ahsan, M.J. 1997. Determining the optimum cluster size. Journal of the Indian Society of Agricultural Statistics. Vol. 50 (2), 121-129.
[13] Kish, L. 1965. Survey sampling. New York, Wiley.
[14] Kokan, A.R and Khan, S.U., 1967. Optimum allocation in mutivariate surveys. An analytical solution. Journal of Royal Statistical Society. Series B, 29, 115-125.
[15] Neymaan, J. 1934. On the two different aspects of the representative methods. The method stratified sampling and the method of purposive selection. Journal of Royal Statistical Society, 97, 558-606.