Web Ecol., 13, 49–67, 2013 www.web-ecol.net/13/49/2013/ doi:10.5194/we-13-49-2013
©Author(s) 2013. CC Attribution 3.0 License.
RGB
Geoscientific
InstrumentationMethods and
Data Systems
Discussions
Geoscientific
InstrumentationMethods and
Data Systems
Open
Access
Web Ecology
Open
Access
Rural–urban gradient and land use in a millenary
metropolis: how urbanization affects avian
functional groups and the role of old villas
in bird assemblage patterning
L. Vignoli1,2, S. Scir`e1, and M. A. Bologna1
1Dipartimento di Scienze, Universit`a Roma Tre. Viale G. Marconi, 446, 00146 Rome, Italy 2Center for Evolutionary Ecology, Largo San Leonardo Murialdo, 1, 00146 Rome, Italy
Correspondence to: L. Vignoli ([email protected])
Received: 31 August 2012 – Revised: 9 June 2013 – Accepted: 11 June 2013 – Published: 8 July 2013
Abstract. Urbanization generally leads to a complex environmental gradient, ranging from almost undis-turbed natural areas to highly modified urban landscapes. Here we analyse the effects of a rural–urban gradient on breeding bird communities and functional species groups in remnant natural and semi-natural areas of Rome. A total of 69 breeding bird species were found in the study area. Species richness decreased with in-creasing urbanization at two spatial scales: the point count station and the landscape scales. Evenness showed a negative trend from periphery to city centre, whereas for dominant species the opposite was true. Functional species groups responded to the urbanization gradient with functional group-specific patterns. Those groups linked to open habitats (nesting and habitat functional groups) decreased in abundance along the rural–urban gradient, whereas those associated with forests exhibited a mixed trend. Generalist species’ occurrence in-creased with urbanization. As for predators and granivorous species, we found a negative relationship with urbanization whereas for omnivorous species the opposite trend was true. The distribution of old villas (large-sized remnant green areas) in the inner city areas influenced species composition along the studied gradient, usually showing higher species richness than surrounding fragments. Agricultural areas hosted richer and bet-ter balanced bird assemblages in respect to those found in urban and forested areas. Our findings proved that an urban gradient plays a major role in structuring bird communities, although the extent and distribution of land use categories was another factor that influenced avian assemblages. The presence of historical villas also influenced bird assemblages, making it possible to preserve high bird diversity even in inner city-areas.
1 Introduction
Urbanization can have a drastic effect on natural and semi-natural habitats. Recent progress in this field notwithstand-ing, our understanding about the consequences of such an effect still needs improvement (Alberti, 2005; Chace and Walsh, 2006; McDonnell and Hahs, 2008; Berland, 2012; Pellissier et al., 2012). Studying the effects of urbanization on bird communities has been a research field since 1950 (Marzluff, 2001). Most studies of urban bird communities have reported that species richness generally decreases with urbanization and that total avian density or biomass
and Pickett, 1990; McDonnell et al., 1993, 1997; Melles et al., 2003; Crooks et al., 2004; McDonnell and Hahs, 2008). Large metropolitan areas may represent a peak of urbaniza-tion, even though they may include remnant green areas of variable sizes. The Municipality of Rome, Central Italy, is one of the western metropolitan areas with the highest pro-portion of green spaces (67 %), half of these being protected areas (Vignoli et al., 2009). Rome’s millennial-old natural heritage includes an extraordinary high number of old vil-las, most deriving from the enclosure of the Roman coun-tryside and estates, mainly located within the inner city area. The presence and the distribution of such different typologies of remnant green areas make Rome a patchwork of semi-natural vs. man-made environments that can be used as a good model for analysing the effect of urbanization in its most pronounced form (Vignoli et al., 2009).
The discovery and interpretation of significant ecosystem processes have found a valuable tool in the functional group approach (e.g. D´ıaz and Cabido, 2001; French and Picozzi, 2002; Llop et al., 2012). These biotic associations have been widely discussed in the literature (e.g. Simberloffand Dayan, 1991, for a review of the “functional group” concept); Tilman (2001) defining them as “a set of species that have similar traits and are thus likely to have similar effects on ecosystem functioning”. According to Petchey et al. (2004), functional diversity can be considered one measure of biodiversity (such as species richness, functional group richness, functional at-tribute diversity) for quantifying resource use complemen-tarity and thereby explaining and predicting ecosystem func-tioning. Functional groups have been widely used in ecolog-ical studies, including in an urban context (e.g. Sattler et al., 2010: insects; Bogosian et al., 2012: amphibians, reptiles, mammals; French and Picozzi, 2002; Fraterrigo and Wiens, 2005; Kark et al., 2007: birds). Contrary to the prevailing notion that bird abundance usually increases in cities, stud-ies reporting increases or decreases of bird abundances are, in fact, about equal. The mechanisms underlying patterns of urban biodiversity are complex and not well understood yet (Faeth et al., 2012).
Few studies have been carried out on the urbanization ef-fects on bird functional groups in large cities (Ortega-Alvarez et al., 2009: Mexico City; Strohbach et al., 2009: Leipzig), particularly in old ones. Our research is thus one of the few contributions carried out in a millenary city, which, after an 1800 yr period of remaining more or less the same size, sud-denly after 1870 underwent a progressive and circular ex-pansion, leading to old villas and relict natural areas being incorporated into the urban fabric.
In this paper, we have focused on the possible effects of the urbanization gradient, effects of land use and the distribution of green areas in a dense urban area on avifauna community parameters and traits (habitat, nesting and feeding functional groups). We predicted that (a) bird communities (i.e. species richness, evenness) are, in general, negatively affected by ur-ban development (land-cover transformation and urur-baniza-
urbaniza-tion gradient); (b) bird species respond to urbanizaurbaniza-tion and changes in land use cover in different ways depending on their habits and requirements; in other words, different func-tional groups may take advantage of increasing urbanization or in other cases be harmed by it (urban adapters vs. urban avoiders; Blair, 1996); and (c) the distribution of old villas in the inner rings along the urbanization gradient likely pro-duces disruption in the trends predicted in (a) and (b).
2 Methods
2.1 Study area
The area under consideration in the present study is the por-tion (36 000 ha) of the Municipality of Rome (Central Italy, approximately: 41◦N, 12◦E) encircled by the GRA ring road (“Grande Raccordo Anulare”), made up of 165 km2of built-up areas and 175 km2of green areas (urban gardens, archae-ological zones, protected natural areas, ancient historical vil-las, lawns, cultivated zones, pastures for sheep and cows). Typically, in the city outskirts, green areas are characterised by residual wooded patches surrounded by pastureland and various mostly non-intensive cultures (Blasi et al., 2001; So-race, 2001). Conversely, in the city centre, the green areas with forested land use (almost all coinciding with the old vil-las) host very reduced open-land habitats sited at the borders of larger expanses of wood (Sorace, 2001). The old villas date as far back as 15–16th century and show a very high number of spontaneous plant species and high habitat het-erogeneity and environmental quality due to the presence of remnant woods, meadows, ponds, springs and fountains (Ce-lesti Grapow, 1995; Blasi et al., 2001). The same villas also represent “hot spots of biodiversity” in the city centre (Ri-cotta et al., 2001). In a typical old villa, 46.4 % of the area consists of meadows, 37.9 % of woods and 15.7 % of bushes or meadows with scattered trees. Public access is unlimited during daytime and the land management is limited to grass cutting (Sorace, 2001).
L. Vignoli et al.: Rural–urban gradient and land use in a millenary metropolis 51
57 Figure 1.
1000
1001
1002
1003
1004
1005
1006
1007
1008
1009
1010
1011
1012
1013
1014
1015
1016
1017
1018
1019
1020
1021 1022
A
B
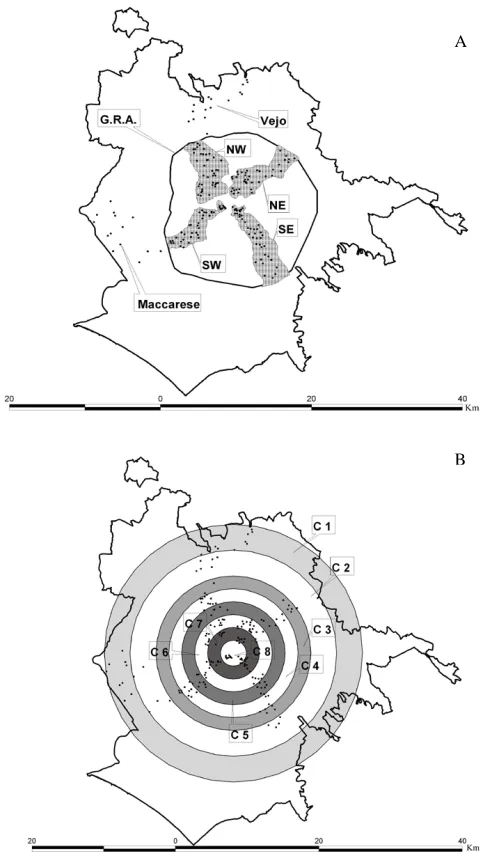
Figure 1.GIS-built maps of the study area showing (A) Municipal-ity of Rome’s borders, G.R.A. ring road, point counts’ (black dots) distribution into four sectors (grey shading), and (B) eight urbaniza-tion gradient rings (UGRs; C8-C1, urban to rural gradient).
typologies (e.g. oak, pine and chestnut forests, Mediter-ranean maquis).
In the study area, we selected four wedge-shaped sample plots (sectors) placed along the cardinal points (NW, NE, SE, SW), delimited by main roads and tapered towards the city-centre (Fig. 1a) (Vignoli et al., 2009). This procedure allowed us to investigate the whole range of urbanization levels in the town through representative samples. Each sector extends linearly from the surrounding countryside to the city centre, comprising remnant natural and semi-natural areas and eight protected areas. Two further external rural zones were con-sidered outside the GRA’s borders, these serving as
compar-ison sites for gradient analysis. These are represented by the Vejo site, northwest of Rome (in the Regional Natural Park of Vejo) and the Maccarese site, southwest of the city (in the Natural State Reserve of Litorale Romano). Within each sec-tor and the two external zones, we identified all the remnant green-space areas (Fig. 1).
2.2 Urbanization gradient rings
Eight concentric rings (UGRs), covering the entire surveyed area, were defined a priori (Fig. 1b). Six rings spaced at about 1.8 km (mean distance from city centre to GRA’ borders) were included inside the GRA territory; two further rings, covering external rural zones, were spaced at 3.6 km, taking into consideration the more diffuse development that occurs in the peripheral areas. The increased distance value for the outer rings is due to the distribution of point counts on a wider area relative to the Vejo and Maccarese sites. As re-gards to the distribution of historical green areas (old villas;
N=12) in the city, they are present only in the three inner rings (UGRs 6–8) and in three out of four sectors (NE, SE and SO).
2.3 Land use categories
Each point count station of the bird survey was assigned to one or several land use categories (LUCs), these being de-fined by taking into account (i) type, (ii) amount (percentage) and (iii) prevailing land use categories inside a 200 m circu-lar buffer surrounding the point (Taffon and Battisti, 2006). The point count stations were chosen by a random stratified sampling approach (i.e. to achieve a minimum of five stations per land use category) within the entire study area (Table 1). Nonetheless, for some land use categories, such as Mediter-ranean scrub, canebrake, quarries, urban forests (non-native deciduous trees, with dominance of the alien species Robinia
pseudoacacia), we were not able to pass the threshold (i.e. n<5). The considered land use categories can be classified as follows: habitat mosaics (UM – urban mosaics, NM – natural mosaics, AM – agricultural mosaics), forests (F – woodlands), pastures (P), cultivations (UC – urbanized cul-tivations, NC – natural cultivations), urban matrix (U) and artificial green areas (AG). On the whole, the considered (n>5) LUCs were represented by 176 point counts and were grouped into the three categories, namely urbanized, agricul-tural and naagricul-tural, based on the CORINE codes (Table 1).
2.4 Sampling methods
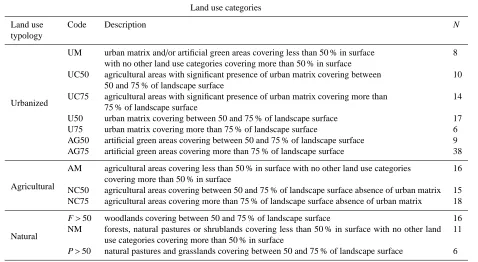
Table 1.Synoptic table summarizing the land use categories selected in the study area. To each land use category belonging to a main land use typology a code is assigned and a concise description is provided. The number of total point count station (N) falling into each land use category is also given.
Land use categories
Land use typology
Code Description N
Urbanized
UM urban matrix and/or artificial green areas covering less than 50 % in surface with no other land use categories covering more than 50 % in surface
8
UC50 agricultural areas with significant presence of urban matrix covering between 50 and 75 % of landscape surface
10
UC75 agricultural areas with significant presence of urban matrix covering more than 75 % of landscape surface
14
U50 urban matrix covering between 50 and 75 % of landscape surface 17 U75 urban matrix covering more than 75 % of landscape surface 6 AG50 artificial green areas covering between 50 and 75 % of landscape surface 9 AG75 artificial green areas covering more than 75 % of landscape surface 38
Agricultural
AM agricultural areas covering less than 50 % in surface with no other land use categories covering more than 50 % in surface
16
NC50 agricultural areas covering between 50 and 75 % of landscape surface absence of urban matrix 15 NC75 agricultural areas covering more than 75 % of landscape surface absence of urban matrix 18
Natural
F>50 woodlands covering between 50 and 75 % of landscape surface 16 NM forests, natural pastures or shrublands covering less than 50 % in surface with no other land
use categories covering more than 50 % in surface
11
P>50 natural pastures and grasslands covering between 50 and 75 % of landscape surface 6
no obstacle (buildings or anthropogenic structure) could af-fect (visually and/or acoustically) sampling accuracy and ef-fectiveness. All the point count stations used in the different analyses are included within the 191 as well as the ones ex-cluded from LUC-analyses. The point count stations of the bird survey were located (from outskirts to the city centre) in the UGRs as follows, their number being proportional to the heterogeneity of land-cover use in each UGR: UGR1 N=18, UGR2 N=16, UGR3 N=15, UGR4 N=25, UGR5 N=25, UGR6 N=45, UGR7 N=31 and UGR8 N=16. The sam-pling effort (number of point counts per ring) is linked to the land use categories’ distribution among rings. The point count stations were localised by a random stratified crite-rion and the differences in the number of point count stations among rings reflect the effective land use diversity of each ring.
A modified version of E.F.P. was applied (Fuller and Langslow, 1984; Bibby and Burgess, 1992; Sorace et al., 2000), reduced to 50 for point count from the original 10’ and repeated twice during the breeding season in 2005 (early period: March–April; late period: May–June) (Garaffa et al., 2009; Gagn´e and Fahrig, 2011). In order to optimise our data set we surveyed early and late breeders and also species with different phenology (migrant and resident species). This ap-proach is frequently suggested for temperate zones (Fuller and Langslow, 1984; Bibby and Burgess, 1992) and its re-sults are particularly suitable for covering wide and
L. Vignoli et al.: Rural–urban gradient and land use in a millenary metropolis 53
here defined as (a) potential breeder: a bird observed during its breeding season in a potentially adequate habitat, with no other indication of reproduction; (b) probable breeder: a bird observed in singing activity, territory defence or courtship; and (c) confirmed breeder: adult birds observed during trans-port of food, faecal refuse or nest building material, recovery of nest with eggs and/or clutches or an empty nest.
Species were classified in functional groups (Clergeau et al., 2006a) based on their nesting, habitat and foraging re-quirements (Wiens, 1997). Bird species were categorised into (a) five nesting functional groups according to their nest typology and nesting behaviour, (b) five habitat func-tional groups identified considering the land-cover typolo-gies which birds are strictly related to (functional group A, linked to open habitats, was subdivided into three more spe-cific subgroups) and (c) five feeding functional groups de-fined according to the species diet requirements. Data on species traits were obtained from Cramp (1998).
2.5 Study scales
In complex biotic organizations such as urban areas it is necessary to define different hierarchical levels of ecologi-cal functioning so as to avoid confusing the different mech-anisms that operate at different spatial scales (Clergeau et al., 2006b). They can be defined as follows: (i) the local (or habitat) scale, which is defined by elements such as green area vegetation composition and structure or the closeness to buildings and other artificial surfaces; and (ii) the landscape level, such as districts that can differ structurally between the centre and the edge of a town for the level of urbanization and the green area availability (Clergeau et al., 2006b). We investigated our study system according to two different spa-tial scales. At the local scale (e.g. single point count station), we analysed the species richness as a function of three main variables: (a) distance from the city centre, (b) land use cat-egory, (c) location in or out old villas. Moreover, as the dis-tribution of the green areas in the study system produces a mosaic of different items, which differ in terms of structure (e.g. size, shape, dominant land use type) and function (man-agement and position within the urban texture), we tested the effect of the interactions between these three main factors on community parameters. At this scale we do not estimate evenness or dominant species because at each point count we recorded species occurrence only and not abundance.
At the landscape scale (i.e. urbanization rings – UGRs), we analysed some avian community parameters measured by pooling all the point count stations within a single UGR in terms of their relationships with (a) the urbanization gradi-ent, (b) land use (natural, rural and urban) and management standards (old villas vs. others) and (c) the distribution and abundance of functional groups. As for the local scale, the interactions between the categorical and the continuous pre-dictors are also evaluated to better understand the observed patterns of community parameter trends.
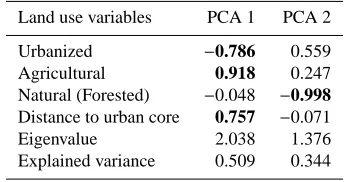
Table 2.Factor loadings of land use variables for the first two Fac-tors derived from principal component analysis. In bold the land use categories significantly associated to each PCA factor.
Land use variables PCA 1 PCA 2
Urbanized −0.786 0.559
Agricultural 0.918 0.247
Natural (Forested) −0.048 −0.998 Distance to urban core 0.757 −0.071
Eigenvalue 2.038 1.376
Explained variance 0.509 0.344
2.6 Data analysis
Data from point counts were grouped as follows: eight ur-banization gradient rings – UGRs (191 point counts) and 13 land use categories (176 point counts). At the landscape scale (UGRs), adequate data performance was tested by build-ing accumulation curves (one for each UGR) to avoid non-representative comparisons due to a non-exhaustive point count sampling. Due to the number of point counts (range 1–16), we could not build accumulation curves for single green area. To assess a valid data set each curve must reach a plateau.
As far as community parameters are concerned, at the local scale (point station) we assessed species richness (S ) as the number of checked species inside 50 survey time (We con-sidered the maximum value pooling the two survey periods; Gagn´e and Fahrig, 2011) and for each green area the fol-lowing parameters were assessed: species richness (S ) (we considered the maximum value pooling all the point count stations within a given green area), relative frequency of each species among point count stations within a given green area (pi), evenness (J) (J=H0/Hmax0 (Lloyd and Ghelardi, 1964) where H0=−piPln·pi and Hmax0 =ln S ), this index varies between 0 and 1 and focuses on an equilibrium in the dis-tribution of species’ abundance in a community and number of dominant species (Nd), i.e. species with frequency>0.05. As regards to landscape scale (UGR), community parameters were estimated by pooling all the point count stations at that scale.
species richness, evenness, dominant species frequency and absolute abundance of functional groups) we built different general linear models. For the various models we built, all the estimated community parameters were normally distributed and were considered as dependent variables. We built one analysis of co-variance model (GLM) to test the linear ef-fects of two fixed factors (PCA1 and PCA2 factor sores), one random factor (sectors) and the interactions between the fixed and random factors on the number of bird species (S ) recorded at each point count station. Another GLM was per-formed to test the effects of two fixed factors (distance from the city centre and land use category), one random factor (sector) and the interactions between fixed and random fac-tors on the number of bird species (S ) recorded at each point count station. All these models were performed by using all the point count stations and then repeated without consider-ing the green areas belongconsider-ing to the old villas. Another GLM was built to test the effects of one fixed factor (distance from the city centre), one random factor (functional group type) and the interaction between them on the absolute abundance of the studied functional groups. In this model the predictor “distance” represents eight increasing values estimated as the average distances from the city centre of each urbanization ring (UGR). In order to compare the bird communities of the old villas with those of the remaining green areas, we esti-mated the community parameters of each green area consid-ered. As these data did not follow a normal distribution, we performed generalised linear models (GLZs) to test the dif-ference in community parameters (dependent variables) be-tween green area types (old villas vs. the remaining green ar-eas, fixed categorical predictors) belonging to the same UGR (fixed categorical predictor). We built three models (one for each community parameter) testing for the linear effect of green area type, gradient (measured by UGRs) and the inter-action between these two terms on the community parame-ters (link function: identity; error distribution: normal). With regards to functional groups, due to an uneven sampling ef-fort, we analysed their absolute abundance estimated after rarefaction procedures by using a null model approach. Null model regressions were used to test the community param-eters estimated at the landscape scale (e.g. UGRs) against the urbanization gradient represented by the PCA1 factors. This analysis gives the probability test in which the observed product–moment correlation coefficient r is compared to the average r obtained in simulated communities by means of 1000 randomizations. The randomization reshuffles the y val-ues only, which is sufficient to scramble the pattern with respect to the x values (Gotelli and Entsminger, 2001). A multivariate analysis of variance (MANOVA) was applied to test for differences in community parameters among LUCs. Parametric tests were only used when assumptions of nor-mality were met; when such assumptions were not met, we performed non-parametric tests (e.g. GLZ) or tests based on null model analyses (e.g. regression), which do not require any data distribution assumptions. All the statistical analyses
were performed by Statistica (Statsoft, 2008; version 8.0) ex-cept for the rarefaction null model analyses, which were per-formed using Ecosim (version 7.72; http://garyentsminger. com/ecosim/index.htm), with two tails and alpha set at 5 %.
3 Results
The environmental changes caused by different LUCs that occurred from the city centre to the periphery were explained by rural and urban land use categories. The first PCA factor was highly and negatively correlated with urbanized cover-age and positively with rural covercover-age (Table 2). The first PCA factor was also highly and negatively associated with the distance from the urban core. These results indicate that the considered PCA factor represented primarily a gradient of increasing rural and decreasing urbanized coverage from the urban core to the periphery. The second PCA factor was significantly linked to natural land use categories but not to the distance from the city centre.
3.1 Local scale
Considering all 191 point counts carried out, a total of 90 bird species were surveyed during the study, 69 of them be-ing considered as breedbe-ing in Rome (potential, probable and confirmed breeders). For the analyses, 64 species were con-sidered, after exclusion of those sighted flying over the sam-pling station due to their uncertain link to the samsam-pling site (Table 3) and 176 point counts belonging to those land use categories with n>5. The species richness at this study scale was clearly influenced by the rural–urban gradient. The re-lationships between species richness and the study gradient was unimodal (humpbacked); the curve that best fitted the data distribution was a second order polynomial (difference in AICc with a linear model=8.946, R=−0.365, p<0.001. Non-linear PCA regression was performed by using PCA1 factor scores against number of species (Fig. 2). The species richness showed a quadratic relationship with the PCA2 fac-tor (curve not shown) but with an inverse pattern (i.e. con-cave) in respect to PCA1 (difference in AICc with a linear model=7.558, R=0.07, p=0.002).
L. Vignoli et al.: Rural–urban gradient and land use in a millenary metropolis 55
58 Figure 2.
1023 1024
-2.0 -1.5 -1.0 -0.5 0.0 0.5 1.0 1.5
Urban Rural
8 10 12 14 16 18 20 22 24
S
p
ec
ie
s
ri
ch
n
es
s
1025 1026
Figure 2. Non-linear principal component analysis regression showing the relationship between bird species richness (recorded at each point count station) and rural–urban gradient associated to the Factor 1 obtained from PCA. Best function fitting data distribution:
y=15.600−0.821·x−0.463·x2. R=−0.370; N=182; p<0.001.
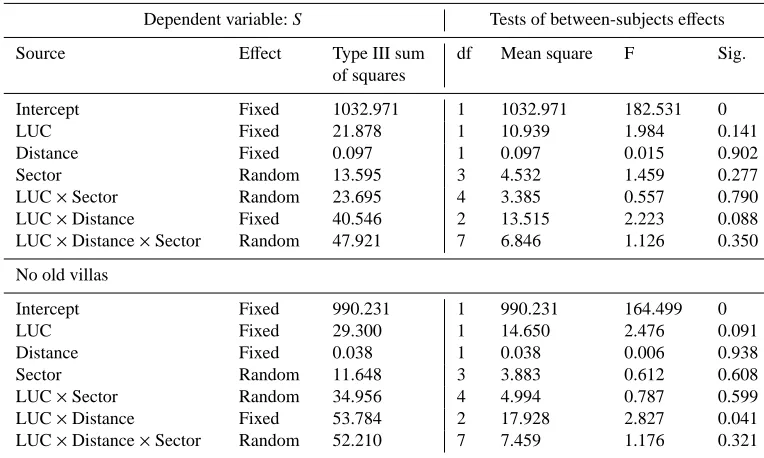
count station), the land use typology (LUC) had no effect on species richness either when analysed as single factor or in interaction with distance and sector. When the same analysis was performed, excluding the data belonging to the old vil-las, the species richness was significantly affected by the in-teraction between LUC and the distance from the city centre (Table 5). Hence, the exclusion of point counts representing mainly human modified land uses (old villas) and sited in the inner portion of the city, revealed a negative effect of the ur-banization gradient comprising all the land use categories on the species richness. In other words, the old villas mitigate the effect of urbanization in the inner portion of the city by reducing the gap between natural and human modified land uses as far as the number of bird species is concerned.
3.2 Landscape scale
3.2.1 Urbanization gradient rings (UGRs)
In the inner rings the green areas are higher in number but smaller in surface than those in the outer rings and conse-quently they present a smaller number of point count sta-tions per green area (Table 4). The accumulation curves (the number of new recorded species against the sampling effort – number of point counts) performed for UGRs stabilised after reaching a plateau (see Appendix Fig. A1). Despite a different sampling effort among UGRs, nearly all the accu-mulation curves reached the plateau value when truncated at the minimum number of samples (N=15) shared by all the rings.
Inside the eight concentric rings, all 64 study species were checked. Three species were dominant (Fr>0.05) inside all rings: Turdus merula, Sylvia atricapilla and Corvus corone.
Species richness decreased with increasing urbanization. If the old villas are removed from the bird community analysis, the species richness decrease showed a much higher signifi-cant trend (Table 6). Evenness showed a signifisignifi-cant negative trend from periphery to city centre, whereas for the num-ber of dominant species the opposite trend was found (Ta-ble 6). The comparison of community parameters between the bird assemblages from the old villas and those from the other fragments showed no significant differences (S : Wald1=1.926, p=0.165, J: Wald1=0.160, p=0.689, ND: Wald1=0.106, p=0.744, GLZ). The comparisons within rings 6, 7 and 8 (i.e. those containing the old villas, n=3, 6 and 3, respectively) showed that in two out of the three anal-ysed rings (the inner UGR7 – nearly significant – and UGR8) the assemblages belonging to the historical villas were, on average, richer in respect to those found in the remaining fragments of the same ring (UGR7: n=11, U=5, p=0.068, UGR8: n=8, U=0.5, p=0.037), whereas evenness and dominant species showed no significant pattern (Fig. 3).
3.2.2 Functional groups
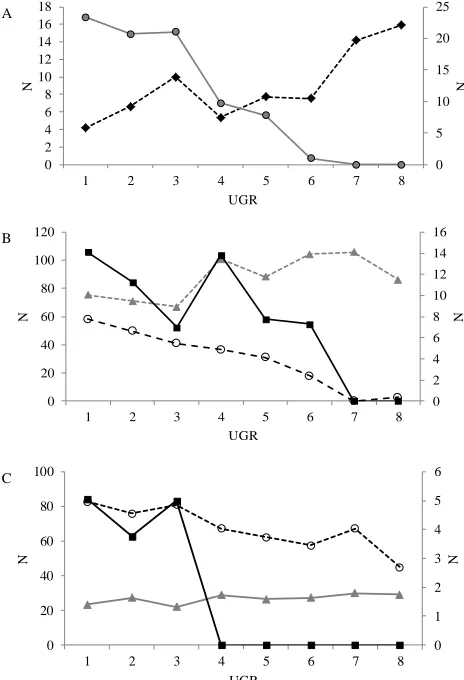
By and large, all the functional groups categories were influenced by the study gradient, the various functional groups responding in different ways to the distance from the city centre (Table 7). The analysis of the nesting func-tional groups (see Table 3 for funcfunc-tional group composi-tion) revealed that the absolute abundance of ground (T) and artificial cavity (AC) breeders showed two contrast-ing trends from external to internal UGRs along the rural– urban gradient (T: robs=−0.960, p=0, AC: robs=0.805,
p=0.009). The abundance of ground nesting species exhib-ited a significant negative trend from periphery to city cen-tre, whereas the opposite was true for the species exploit-ing artificial cavities (Fig. 4a). The analysis of the habitat functional groups showed that species linked to open habi-tats sensu lato (Functional group A), which include cereal cultivations, semi-natural pastures and bushy meadows, un-derwent a clear reduction in numbers from external to inter-nal UGRs (robsr=−0.970; p=0; Fig. 4b). The three open habitat sub-functional groups responded in the same way, the exception being the open Mediterranean shrubby habitat, which showed no significant relationship with the urbaniza-tion gradient (AE: robs=−0.966, p=0, AE2: robs=−0.488,
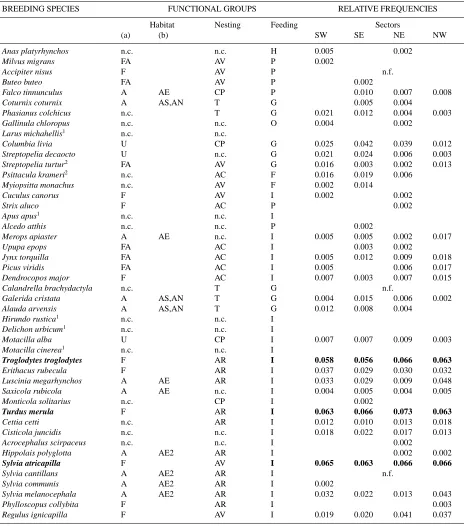
Table 3.Complete list and relative frequency of the observed breeding species in the study area grouped by habitat and nesting site functional groups. Dominant species (i.e. with relative frequency>0.05) are in bold. Abbreviations: SW, SE, NE, NW: sector codes referring to their cardinal position. n.f.: species not found inside sectors, but inside two selected external areas;1=species flying over the station, not strictly breeding in the study area and not considered in the analyses;2=alien species. Habitat functional groups: A=open habitats (from cultivations to arboreal shrublands); FA=open forested habitats (mixture of wooded areas and open habitats); F=forested habitats with prevalence of woodlands; U=urban habitats, with prevalence of urban matrix; MX=mixed categories (A, U and UV); n.c.=species not strictly related to the used habitat categories. Functional group A was subdivided into four further subgroups: AE=open heterogeneous environments; AE2 =open environments, xeric, usually represented by Mediterranean scrubs assessments; AS=cultivations, AN=open natural environments with prevalence of grasslands, without trees or shrubs. Nesting site functional groups: AC=tree cavities; AR=shrubs, bushes; AV=open trees; CP=artificial anthropic cavities; T=ground; feeding functional groups: FR=frugivorous; G=granivorous; H=herbivorous; I= insectivorous; O=omnivorous; P=predators (species feeding at least in part on vertebrates).
BREEDING SPECIES FUNCTIONAL GROUPS RELATIVE FREQUENCIES
Habitat Nesting Feeding Sectors
(a) (b) SW SE NE NW
Anas platyrhynchos n.c. n.c. H 0.005 0.002
Milvus migrans FA AV P 0.002
Accipiter nisus F AV P n.f.
Buteo buteo FA AV P 0.002
Falco tinnunculus A AE CP P 0.010 0.007 0.008
Coturnix coturnix A AS,AN T G 0.005 0.004
Phasianus colchicus n.c. T G 0.021 0.012 0.004 0.003
Gallinula chloropus n.c. n.c. O 0.004 0.002
Larus michahellis1 n.c. n.c.
Columbia livia U CP G 0.025 0.042 0.039 0.012
Streptopelia decaocto U n.c. G 0.021 0.024 0.006 0.003
Streptopelia turtur2 FA AV G 0.016 0.003 0.002 0.013 Psittacula krameri2 n.c. AC F 0.016 0.019 0.006
Myiopsitta monachus n.c. AV F 0.002 0.014
Cuculus canorus F AV I 0.002 0.002
Strix aluco F AC P 0.002
Apus apus1 n.c. n.c. I
Alcedo atthis n.c. n.c. P 0.002
Merops apiaster A AE n.c. I 0.005 0.005 0.002 0.017
Upupa epops FA AC I 0.003 0.002
Jynx torquilla FA AC I 0.005 0.012 0.009 0.018
Picus viridis FA AC I 0.005 0.006 0.017
Dendrocopos major F AC I 0.007 0.003 0.007 0.015
Calandrella brachydactyla n.c. T G n.f.
Galerida cristata A AS,AN T G 0.004 0.015 0.006 0.002
Alauda arvensis A AS,AN T G 0.012 0.008 0.004
Hirundo rustica1 n.c. n.c. I Delichon urbicum1 n.c. n.c. I
Motacilla alba U CP I 0.007 0.007 0.009 0.003
Motacilla cinerea1 n.c. n.c. I
Troglodytes troglodytes F AR I 0.058 0.056 0.066 0.063
Erithacus rubecula F AR I 0.037 0.029 0.030 0.032
Luscinia megarhynchos A AE AR I 0.033 0.029 0.009 0.048
Saxicola rubicola A AE n.c. I 0.004 0.005 0.004 0.005
Monticola solitarius n.c. CP I 0.002
Turdus merula F AR I 0.063 0.066 0.073 0.063
Cettia cetti n.c. AR I 0.012 0.010 0.013 0.018
Cisticola juncidis n.c. n.c. I 0.018 0.022 0.017 0.013
Acrocephalus scirpaceus n.c. n.c. I 0.002
Hippolais polyglotta A AE2 AR I 0.002 0.002
Sylvia atricapilla F AV I 0.065 0.063 0.066 0.066
Sylvia cantillans A AE2 AR I n.f.
Sylvia communis A AE2 AR I 0.002
Sylvia melanocephala A AE2 AR I 0.032 0.022 0.013 0.043
Phylloscopus collybita F AR I 0.003
L. Vignoli et al.: Rural–urban gradient and land use in a millenary metropolis 57
Table 3.Continued.
BREEDING SPECIES FUNCTIONAL GROUPS RELATIVE FREQUENCIES
Habitat Nesting Feeding Sectors
(a) (b) SW SE NE NW
Muscicapa striata n.c. AR I 0.002 0.002 0.003
Aegithalos caudatus F AV 0.005 0.003 0.007 0.005
Cyanistes caeruleus F AC I 0.061 0.037 0.058 0.051
Parus major F AC I 0.063 0.054 0.069 0.060
Sitta europaea F AC I 0.004
Certhia brachydactyla F AC I 0.030 0.036 0.045 0.032
Remiz pendulinus n.c. AV I 0.002
Oriolus oriolus FA AV I 0.002
Lanius collurio A AE AR P 0.002
Lanius senator A AE AR P n.f.
Garrulus glandarius FA AV O n.f.
Pica pica A AE AV O n.f.
Corvus corone MX AV O 0.070 0.066 0.067 0.063
Corvus monedula n.c. CP O 0.002 0.008
Sturnus vulgaris MX n.c. O 0.056 0.064 0.062 0.056
Passer domesticus U AV G 0.053 0.054 0.052 0.038
Passer montanus U AV G 0.002
Fringilla coelebs F AV G 0.030 0.015 0.036 0.030
Serinus serinus MX n.c. G 0.049 0.059 0.062 0.051
Carduelis carduelis MX AV G 0.023 0.030 0.026 0.032
Carduelis chloris MX AV G 0.047 0.052 0.058 0.055
Emberiza cirlus A AE AR G 0.005 0.012
Miliaria calandra A AE T G 0.008 0.002 0.002
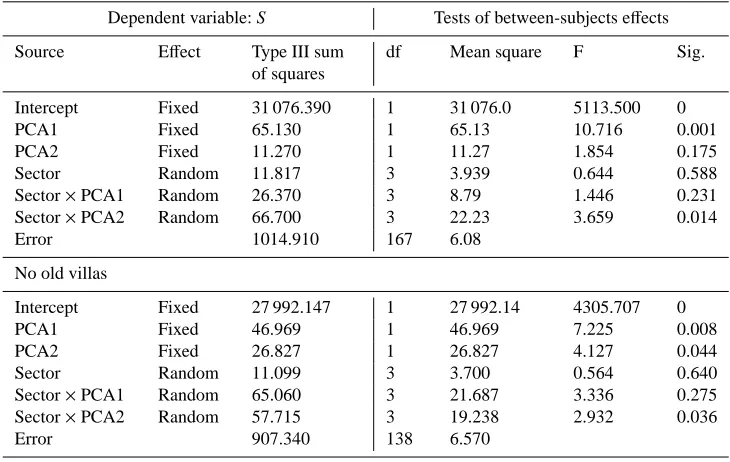
Table 4.Analysis of co-variance (GLM) of the effects of two fixed factors (PCA factor sores) and one random factor (sectors) on the number of bird species (S ) recorded at each point count station. The models were performed by using all the point count stations (above) and then repeated without considering the green areas belonging to the old villas (below).
Dependent variable: S Tests of between-subjects effects
Source Effect Type III sum of squares
df Mean square F Sig.
Intercept Fixed 31 076.390 1 31 076.0 5113.500 0
PCA1 Fixed 65.130 1 65.13 10.716 0.001
PCA2 Fixed 11.270 1 11.27 1.854 0.175
Sector Random 11.817 3 3.939 0.644 0.588
Sector×PCA1 Random 26.370 3 8.79 1.446 0.231
Sector×PCA2 Random 66.700 3 22.23 3.659 0.014
Error 1014.910 167 6.08
No old villas
Intercept Fixed 27 992.147 1 27 992.14 4305.707 0
PCA1 Fixed 46.969 1 46.969 7.225 0.008
PCA2 Fixed 26.827 1 26.827 4.127 0.044
Sector Random 11.099 3 3.700 0.564 0.640
Sector×PCA1 Random 65.060 3 21.687 3.336 0.275
Sector×PCA2 Random 57.715 3 19.238 2.932 0.036
Table 5.GLM analyses of the effects of two fixed factors (distance and land use category – LUC) and one random factor (sector) on the number of bird species (S ) recorded at each point count station. The models were performed by using all the point count stations (above) and then repeated without considering the green areas belonging to the old villas (below).
Dependent variable: S Tests of between-subjects effects
Source Effect Type III sum
of squares
df Mean square F Sig.
Intercept Fixed 1032.971 1 1032.971 182.531 0
LUC Fixed 21.878 1 10.939 1.984 0.141
Distance Fixed 0.097 1 0.097 0.015 0.902
Sector Random 13.595 3 4.532 1.459 0.277
LUC×Sector Random 23.695 4 3.385 0.557 0.790
LUC×Distance Fixed 40.546 2 13.515 2.223 0.088
LUC×Distance×Sector Random 47.921 7 6.846 1.126 0.350
No old villas
Intercept Fixed 990.231 1 990.231 164.499 0
LUC Fixed 29.300 1 14.650 2.476 0.091
Distance Fixed 0.038 1 0.038 0.006 0.938
Sector Random 11.648 3 3.883 0.612 0.608
LUC×Sector Random 34.956 4 4.994 0.787 0.599
LUC×Distance Fixed 53.784 2 17.928 2.827 0.041
LUC×Distance×Sector Random 52.210 7 7.459 1.176 0.321
Table 6.Distribution of green areas and structural parameters of bird communities inside eight urbanization rings and correlation with the distance to the city centre and the urbanization gradient (from periphery to centre). The distance is expressed in meters. The gradient is represented by the average PCA1 scores of all local point in a given UGR; for each community parameter the r values for regression with distance (above) and gradient (below) are reported; robs=observed r in null model regression. Abbreviations: UGR=urbanization ring; N GA=number of green areas; PCS/GA=number of point count stations per green area; S=species richness; S (woOV)=species richness without old villas; J=evenness; Nd=dominant species.
Parameter Urbanization ring statistics
robs p level
Ring UGR1 UGR2 UGR3 UGR4 UGR5 UGR6 UGR7 UGR8
N GA 2 2 6 6 8 14 11 8 0.799 0.014
PCS/GA 9.0 8.0 2.5 4.2 3.1 3.2 2.8 2.0 −0.861 0.005
Distance 14 202 13 034 10 053 8352 7142 4399 2915 1739 Gradient 1.145 1.014 0.448 0.591 0.061 −0.340 −1.057 −1.159
S 41 41 40 46 39 42 33 29 0.633 0.052
0.782 0.017
S (woOV) 41 41 40 46 39 38 28 22 0.748 0.013
0.869 0.004
J 0.92 0.92 0.91 0.89 0.91 0.88 0.87 0.89 0.835 0.033
0.762 0.025
Nd 0.12 0.20 0.20 0.13 0.21 0.22 0.34 0.39 −0.845 0
−0.932 0.002
to that observed for the forest habitat functional group (robs= 0.578, p=0.073). Species associated with mixed categories did not show any significant trend (robs=0.018, p=0.461). The functional groups based on diet requirements showed contrasting correlations to the urbanization rings: omnivo-rous bird abundance was positively related to the increasing urbanization (robs=0.702, p=0.035), whereas for
granivo-rous (robs=−0.881, p=0.001) and predator (robs=−0.835,
p=0.012) functional groups the opposite trend was found (Fig. 4c).
3.2.3 Land use categories (LUCs)
Turdus merula, S. atricapilla and C. corone were
L. Vignoli et al.: Rural–urban gradient and land use in a millenary metropolis 59
Table 7.General linear model analyses of the effects of one fixed factor (distance) and one random factor (group) on the absolute abundance of the studied functional groups. The predictor “distance” represents eight increasing values estimated as the average distances from the city centre of each urbanization ring (UGR).
Dependent variable: S Group Tests of between-subjects effects
Source Effect Type III sum df Mean square F Sig. of squares
Nesting
Intercept Fixed 13 014.00 1 13 014.00 9.686 0.035
Group Random 5374.26 4 1343.57 29.232 0
Distance Fixed 128.10 1 128.10 0.610 0.478
Group×Distance Random 839.33 4 209.83 4.565 0.005
Error 1378.84 30 45.96
Habitat
Intercept Fixed 12 113.79 1 12 113.79 14.353 0.012
Group Random 4343.74 5 868.75 21.860 0
Distance Fixed 108.49 1 108.49 0.229 0.651
Group×Distance Random 2360.29 5 472.06 11.878 0
Error 1430.64 36 39.74
Trophic
Intercept Fixed 21 869.96 1 21 869.96 4.973 0.111
Group Random 13 190.88 3 4396.96 50.391 0
Distance Fixed 225.48 1 225.48 0.967 0.397
Group×Distance Random 698.92 3 232.97 2.670 0.070
Error 2094.14 24 87.26
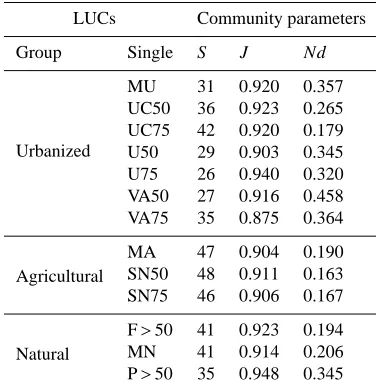
Table 8.Structural parameters of bird communities inside 13 se-lected land use categories (LUCs). See Table 1 for land use codes and groups. Community parameter abbreviations: S=species rich-ness; J=Evenness; Nd=dominant species.
LUCs Community parameters
Group Single S J Nd
Urbanized
MU 31 0.920 0.357 UC50 36 0.923 0.265 UC75 42 0.920 0.179 U50 29 0.903 0.345 U75 26 0.940 0.320 VA50 27 0.916 0.458 VA75 35 0.875 0.364
Agricultural
MA 47 0.904 0.190 SN50 48 0.911 0.163 SN75 46 0.906 0.167
Natural
F>50 41 0.923 0.194 MN 41 0.914 0.206 P>50 35 0.948 0.345
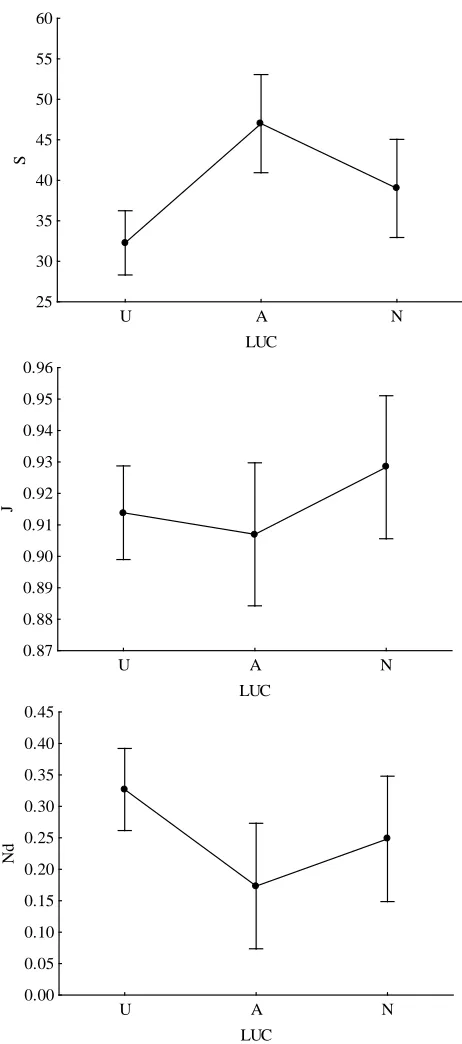
community parameters differed significantly among the LUC groups “urbanized”, “agricultural” and “natural” (Wilks lambda=0.218, F12,6=3.050, p<0.036, MANOVA). Agri-cultural LUCs showed, on average, significantly higher num-ber of species than urban LUCs (p=0.003, Tuckey HSD post hoc test) while for Nd (number of dominant species) the con-trary was true (p=0.045) (Table 8, Fig. 5).
When all the sampling points of a particular land use type (urbanized, agricultural and natural) within a particular UGR are aggregated and the mean distance to the centre of each point is used, the models built with LUCs (categorical pre-dictor) and the distance (continuous prepre-dictor) confirmed the effect of the terms LUCs and distance on species richness and evenness (for all tests and effects: Wald≥8.196, p≤0.017, generalised linear models) but not for dominant species, which showed no effect. Moreover, the interaction term “LUCs×distance” had an effect on bird community param-eters (for all tests and effects: Wald≥10.078, p≤0.006). In particular, the agricultural land use categories showed a de-creased species richness (B=−6.910×10⁻⁶, Wald=21.628,
p=0) with increasing urbanization; the same patterns were found for evenness in natural land use categories (B=0.001, Wald=9.156, p=0.002) and dominant species in natural habitats increased with the proximity to the city centre (B= 2.398×10⁻⁵, Wald=7.603, p=0.006).
4 Discussion
4.1 General considerations
We found a negative effect of urbanization at both local and landscape scales in regards to bird community richness and evenness. Functional groups revealed contrasting patterns linked to the rural–urban gradient by responding in a group specific way to the degree of urbanization.
Figure 3.Bird community parameters estimated in the old villas and in the remaining green areas within UGRs 6, 7, and 8. The comparisons were performed by means of generalised linear mod-els with the green area typology and UGR used as categorical pre-dictors. In the plots the marginal means for the interaction effect between the predictors are shown. (A) Species richness (S )×UGR (Wald:χ2
(2)=10.286, p=0.006); (B) Evenness (J)×UGR (Wald: χ2
(2)=0.523; p=0.769); (C) Dominant species (Nd)×UGR (Wald: χ2
(2)=0.523; p=0.770). Black circles=old villas; Empty squares =remaining green areas.
60 1075
1076 1077 1078 1079 1080 1081 1082 1083 1084 1085 1086 1087 1088 1089 1090 1091 1092 1093 1094 1095 1096 1097 1098 1099 1100 1101 1102 1103 1104 1105
1106
1107
1108
1109
1110
1111
1112
0 2 4 6 8 10 12 14 16
0 20 40 60 80 100 120
1 2 3 4 5 6 7 8
N
N
UGR
0 5 10 15 20 25
0 2 4 6 8 10 12 14 16 18
1 2 3 4 5 6 7 8
N
N
UGR
0 1 2 3 4 5 6
0 20 40 60 80 100
1 2 3 4 5 6 7 8
N
N
UGR A
B
C
Figure 4.Different significant trends showed by functional groups belonging to the nesting (A), habitat (B), and feeding (C) functional groups in terms of absolute abundance along the eight urbanization gradient rings (1–8 rural to urban gradient). (A) – grey circles and continuous line: ground nesters (T; right y-axis); black rhombuses and dotted line: artificial anthropic cavities nesters (CP; left y-axis). (B) – black squares and continuous line: open forest dwellers (FA) (left y-axis); grey triangles and dotted line: forest dwellers (F; left y-axis); empty circles and black dotted line: open habitat dwellers (A: right y-axis). (C) – black squares and continuous line: predators (P; right y-axis); empty circles and black dotted line: granivorous (G; left y-axis); grey triangles and dotted line: omnivorous (O; left y-axis).
sampling years) (Cignini and Zapparoli, 1996) accounts for 75 breeding species. If aquatic and nocturnal species are ex-cluded and Apus spp. are counted as one species due to the difficulty in distinguishing them in flight, the checklists from the two studies are similar (66 – Cignini and Zapparoli, 1996 vs. 68 – present research). Particularly noteworthy from a faunistic and conservation viewpoint is the widespread ob-servation of two breeding alien parrot species, Myiopsitta
monachus and Psittacula krameri, not previously recorded,
L. Vignoli et al.: Rural–urban gradient and land use in a millenary metropolis 61
61
U A N
LUC 0.00
0.05 0.10 0.15 0.20 0.25 0.30 0.35 0.40 0.45
Nd
U A N
LUC 0.87
0.88 0.89 0.90 0.91 0.92 0.93 0.94 0.95 0.96
J
U A N
LUC 25
30 35 40 45 50 55 60
S
Figure 5. 1113
1114
1115
1116
1117
1118
1119
1120
1121
1122
1123
1124
1125
1126
1127
1128
1129
1130
1131
1132
1133
1134
1135 1136
1137 Figure 5.MANOVA plots illustrating average structural parameter
values of bird communities for 13 selected land use categories be-longing to urban (U), agricultural (A) and natural (N) habitats. Ver-tical bars denote 0.95 confidence intervals. Community parameter abbreviations: S=species richness; J=Evenness; Nd=dominant species.
62 APPENDIX A
1138
Accumulation curves elaborated for all the studied urbanization gradient rings (UGR). 1139
Vertical dotted line represents the minimum number of samplings (N = 15) shared by all 1140
the rings. Nearly all the accumulation curves rich the plateau value at sampling N =15.
1141
1142 1143 1144 1145 1146 1147 1148 1149 1150 1151 1152 1153 1154 1155 1156 1157 1158 1159
Figure A1.Accumulation curves elaborated for all the studied ur-banization gradient rings (UGR). Vertical dotted line represents the minimum number of samplings (N=15) shared by all the rings. Nearly all the accumulation curves rich the plateau value at sam-pling N=15.
Some previous studies carried out on birds in cities have found urbanization to have an overall negative effect upon bird communities, such as a reduction in both species rich-ness and some specialised functional groups abundance (i.e. Blair, 1996; Bolger et al., 1997; Clergeau et al., 1998, 2006a; Jokim¨aki et al., 2005), whereas others have highlighted that local features (such as the reciprocal distribution of green areas or the vegetation diversity hosted by a given green area) may also influence bird communities and are of partic-ular importance in estimating the likelihood of finding bird species (Clergeau et al., 2001; Melles et al., 2003). Our re-sults showed that features at both landscape and local scales can explain bird community structures. Although nearly all the analysed bird community parameters, except the dom-inant species, showed a clear inverse relationship with in-creasing urbanization, the influence of urbanization features is not consistent with a negative effect on all the bird species and functional groups (as also revealed by Kark et al., 2007). In fact, the commonest and most widespread species, char-acterised by high ecological amplitude, took advantage of different levels of urbanization, so proving dominant in all the tested communities within all the study sectors and along the rural–urban gradient (i.e. T. merula, S. atricapilla, C.
corone). A similar finding pertains at the functional group
4.2 Local scale
There is a widely observed reduction in species richness from peri-urban areas to the city centre as green areas proximal to the inner city deteriorate in habitat quality and take on a simplified vegetation structure (Clergeau et al., 1998, 2006a; Jokim¨aki and Huhta, 2000; but see McKinney, 2006 for the inverse pattern). Therefore, we could expect to observe a sim-ilar trend in species richness across our urbanization gradi-ent.
In our study, at the point count station scale, bird species richness decreased with increasing urbanization following a unimodal pattern; in other words, the transition from agricul-tural to urbanized land use produces a decrease in the number of bird species with a peak of species richness at the gradient mid-point. The humpbacked relationship is one of the most analysed patterns in ecology (Graham and Duda, 2011). This pattern of a species richness trend along an urbanization gra-dient has been widely investigated in bird community studies (e.g. Blair, 1996, 1999; Blair and Johnson, 2008; Shwartz et al., 2008), this being potentially generated by an intermedi-ate intensity, frequency, or duration of disturbance (interme-diate disturbance hypothesis, – see Wilkinson, 1999) due to a suite of factors linked to urbanization. Alternatively it could be related to different factors, such as an increasing spatial heterogeneity in the middle of the gradient (Roxburgh et al., 2004), which in turn is linked in some way to the interme-diate disturbance hypothesis and relative nonlinearity (Ches-son, 2000). In our study system an increased spatial diversity in the middle of the gradient is clearly mirrored by the higher number of land use typologies found in the central UGRs in respect to those at both peripheral and central ends. However, at this stage we are unable to uniquely distinguish between these non-mutually exclusive hypotheses.
The species richness was positively influenced by natu-ral land use when the old villas (the green areas represented mainly by human modified land use) are not considered. This could be explained by the fact that the old villas, by support-ing a high number of bird species, likely reduced the gap be-tween urban and natural land use categories as far as species richness is concerned. The distribution of land use among the study sectors influenced the species richness-natural land uses relationship. This effect is likely explained by a non-homogeneous distribution of green areas (especially old vil-las are widespread in three out four sectors) among sectors.
Moreover, when all the land use typologies were taken into consideration together, species richness did not show a sig-nificant trend according to either the distance from the city centre or land use categories, but only became significant when the distance interacted with land use and when the old villas were removed from the analysis. In other words, the expected species richness decreased along with the dis-tance from the periphery to the centre of the city (a crude and simplistic representation of the gradient) was disregarded
by the peculiar habitat quality and distribution of large (>50 hectares) historical villas within Rome.
4.3 Landscape scale
4.3.1 Urbanization gradient rings (UGRs)
The species richness estimated at the landscape scale showed no trend when correlated to the distance to the city cen-tre, whereas this parameter was negatively affected by the urbanization gradient. The number of bird species was sig-nificantly influenced by both distance and urban gradient, showing a negative trend, when old villas were not consid-ered in the analyses. Indeed, the location of large-sized rem-nant green areas dispersed along the studied gradient influ-ences the bird species richness but not evenness or number of dominant species. These historical remnant fragments are widespread in inner Rome (from ring six to ring eight) and are usually managed with a view to conserving a section with centenary trees, while keeping smaller areas in a “wild” state with woods and Mediterranean maquis and shrubs (Sorace, 2001). The presence of a mixture of micro-habitats in ur-ban parks enhances the richness and diversity of available resources. This allows a high species richness and bird den-sity, so ensuring biodiversity “hot spots” within cities, par-ticularly in the inner neighbourhoods where no other natural large-sized patches have been maintained due to urbanization (Blair, 1996; Fern´andez-Juricic, 2000; Croci et al., 2008; see Vignoli et al., 2009 for herpetofauna).
In contrast with species richness, the other community pa-rameters showed significant links to both distance and the urbanization gradient, being negative for evenness and pos-itive for the number of dominant species. Along urbaniza-tion gradients an alteraurbaniza-tion has often been observed, in terms of a simplification of the vegetation structure and stratifica-tion in most of the remnant patches with a cascade effect on bird assemblages: (i) loss of sensitive species (see below for functional groups), (ii) abundance decrease of non-generalist species due to elective habitat reduction, (iii) abundance in-crease of generalist species (urban exploiters), which become dominant in the assemblages (Clergeau et al., 2006a; Sorace and Gustin, 2009).
4.3.2 Functional groups
L. Vignoli et al.: Rural–urban gradient and land use in a millenary metropolis 63
“ground nesters” (Lancaster and Rees, 1979; Beissinger and Osborne, 1982; Mills et al., 1989; Allen and O’Conner, 2000; Jokim¨aki et al., 2005; Chace and Walsh, 2006; Clergeau et al., 2006a). According to our analysis of nesting functional groups, the increased urbanization level clearly represents a detriment for the species nesting on the ground, this be-ing likely due to nest predation and decreasbe-ing habitat qual-ity and availabilqual-ity (Jokim¨aki et al., 2005). Ground nesting species are particularly sensitive to urbanization because, even if predation pressure by raptors is reduced in towns, they are likely affected by carrion crows (Corvus corone), a dominant species in urbanized habitats and a major avian nest predator (Andr´en, 1992). Moreover, there are many gen-eralist nest predators linked to human activities such as dogs, foxes and cats that may negatively affect the nesting op-portunities for these species (Osborne and Osborne, 1980; Clergeau et al., 2006a; Sorace and Gustin, 2009). The ben-eficiaries of this situation are the artificial cavity breeders, which take advantage by colonizing patches in the inner city. In this regard, an important consideration is that the prox-imity of the buildings surrounding the green areas might favour species linked to these structures through nesting sites and perching opportunities rather than intrinsic characteris-tics of the patch itself (Clergeau et al., 2006a). The analy-sis of the habitat functional groups revealed that species re-lated to open habitats sensu lato (intensive cereal cultivations, semi-natural pastures and bushy meadows) showed a clear reduction in total relative frequencies from external to inter-nal UGRs. Also, two out of three open habitat sub-functiointer-nal groups presented the same trend, evidencing an overall sim-ilar response to the degree of urbanization by functional groups with specific requirements in physionomic-structural features. Interestingly, the two functional groups linked to forested habitat showed two opposite trends: (i) a decrease in total frequency of species associated to open forest habitat and (ii) an increase in those linked to close forested habitats from external to internal urbanization rings. We interpreted both the observed trends as related to the property and the extent of the habitats surrounding the wooded areas within the fragment. In the city outskirts, green areas are typically urban-agricultural parks with wooded patches surrounded by wide cultivated fields or pasture. While in the city centre, in the patches with significant forest cover, the open-land habitats only border wide patches of woodland. Indeed, the wooded fragments sited at the periphery of the town likely match the ecological requirements for the species linked to open forest, whereas the species associated to closed for-est find their elective habitat in the wooded patches in the inner city. As far as the feeding functional groups are con-cerned, we found two contrasting patterns shown by granivo-rous and predator groups on one side and omnivogranivo-rous species on the other, the urbanization degree affecting the former functional groups negatively and the latter positively. Insec-tivorous species abundance did not correlate with the increas-ing urbanization. While for predators we have no comparable
results coming from other studies, what was observed for the granivorous feeding group is opposite to the trend observed in previous studies (Kark et al., 2007; Blair and Johnson, 2008; Shwartz et al., 2008). In a real rural–urban gradient, as in our own study, it should not be surprising that the den-sity of seed feeders decreases with the decline of cultivated fields, cereal cultures and non-intensive farming. As for in-sect feeders, our results apparently contrast with the signif-icant decline with increasing urbanization previously been found by other authors (Chace and Walsh, 2006; Kark et al., 2007; Blair and Johnson, 2008; Shwartz et al., 2008), but match with the findings of Evans et al. (2011). It is likely that in the inner rings, the rich vegetation sheltered by the old villas provides a food resource for insectivorous species whose diet is based on ground and aerial insects.
Overall, different ecological bird categories (see Root, 1967) appear to be affected by urbanization in different ways. Birds of Rome appear to fall into three broad groups: ur-ban avoiders (ground nesters, open habitat and open forest dweller species, predators and seed feeders), suburban adapt-able (forest dweller species) and urban exploiters (artificial cavity nester and omnivorous species).
Moreover, our results showed that urban-rural gradients can be complex due to the interaction among various an-thropogenic factors and between anan-thropogenic and natural variables. Although some of these interactions can be as-sessed qualitatively and quantitatively, additive and syner-gic effects are very difficult to detect or estimate (McDon-nel and Pickett, 1990). Indeed, even if the environment is or-dered in space (urbanization gradient) and the communities respond with variations in structure and composition (“gra-dient paradigm”; Whittaker, 1967), not all community pa-rameters are affected in the same way or, indeed, may not be affected at all. Hence, for a comprehensive and thorough interpretation of these complex patterns, the use of multi-community-parameter analyses is due.
4.3.3 Land use categories
assemblages and conserve the species-specific key structure (Tews et al., 2004). Moreover, the influence of land use cat-egories on avian community structure also revealed within-habitat type variations along the urban gradient, with specific land use categories showing different patterns as for the com-munity parameters: (i) natural habitats showed increasing dominant species and decreasing species richness with in-creasing urbanization and (ii) agricultural habitats presented a decreased evenness in the communities closed to the city centre. Hostetler and Knowles-Yanez (2002) found that land use did not correlate with bird community parameters for most of their studied species; they concluded, based on pre-vious studies, that land cover is a better proxy for bird abun-dance than land use (for the different meanings of land cover and land use see the review by Comber, 2008). In fact, the study by Hostetler and Knowles-Yanez (2002) investigated the bird communities in a single town (Phoenix, Arizona, USA) and their results cannot be generalised. Since other re-cent papers have demonstrated the relationship between bird abundance and land use (Ortega- ´Alvarez and MacGregor-Fors, 2009; MacGregor-Fors et al., 2010; Suarez-Rubio et al., 2011; Siriwardena et al., 2012), our results contribute to the discovering of more generalizable patterns regarding the effect of land use on bird diversity.
4.4 Conservation implications
Our study is one of the few attempts in avian community ecology to combine the effect of urbanization gradient with that of specific land use typologies on bird assemblages and functional groups together. Our results suggest that the rural– urban gradient plays a major role in structuring bird com-munities (Clergeau et al., 2006a; McKinney, 2006). It is not the only factor affecting community parameters, however. The extent and distribution of land use categories along the rural–urban gradient is another factor influencing avian as-semblages. The presence of historical villas also influences bird assemblage distribution, composition and richness, mak-ing it possible to preserve a high bird diversity even in in-ner city areas. Therefore, to guarantee bird conservation it is crucial to preserve the status of the large-sized green ar-eas and to re-establish and/or enhance the habitat hetero-geneity in those smaller remnant patches (natural or artifi-cial) whose vegetation structure (stratification, tree species diversity) has been impoverished by anthropogenic factors (recreational use, commercial activity exploitation). The re-sponse to urbanization is functional group-specific (Kark et al., 2007); therefore, to understand the processes involved in community assembly and to propose the appropriate and ef-fective conservation measures it is essential to identify the specific bird traits associated with sensitivity to urbanization (see Ewers and Didham, 2006).
Indeed, in the urban landscape, the green areas, particu-larly the largest patches, should serve as important compo-nents of local conservation strategies. Moreover, the key role
played by the old villas in maintaining high biodiversity lev-els in the inner-city must be taken in account when it comes to regulating human use of these green areas, whether for recreation, sport or public entertainment. Overall, our results suggest that urbanized landscapes can support highly diverse bird assemblages and therefore support the efforts aimed at preserving the remaining patches in areas of high human population density (Pautasso et al., 2010).
Acknowledgements. We sincerely thank C. Battisti and L. Luiselli for suggestions on earlier drafts and two anonymous referees for their comments. We are indebted to Martin Bennet and Roger Federer (and of course to Federer’s brilliant and promising scion Grigor Dimitrov) for the English revision of the final draft. L. Vignoli dedicates this paper to his friend Young Django (the “D” is silent), who tragically died during a very fatigue field session.
Edited by: J. Stadler
Reviewed by: two anonymous referees
References
Alberti, M.: The effects of urban patterns on ecosystem function, Int. Regional Sci. Rev., 28, 168–192, 2005.
Aldrich, J. W. and Coffin, R. W.: Breeding bird populations from forest to suburbia after thirty-seven years, Amer. Birds, 34, 3–7, 1980.
Alldredge, M. W., Simons, T. R., and Pollock, K. H.: A field evalua-tion of distance measurement error in auditory avian point count surveys, J. Wildlife Manage., 71, 2759–2766, 2007.
Allen, A. P. and O’Conner, R. J: Hierarchical correlates of bird as-semblage structure on northeastern USA lakes, Environ. Monit. Assess., 62, 15–35, 2000.
Andr´en, H.: Corvid Density and Nest Predation in Relation to Forest Fragmentation: A Landscape Perspective, Ecology, 73, 794–804, 1992.
Barker, R. J. and Sauer, J. R.: Statistical aspects of point count sam-pling, in: Monitoring Bird Populations by Point Counts, edited by: Ralph, C. J., Sauer, J. R., and Droege, S., General Techni-cal Report PSW-GTR-149, Pacific Southwest Research Station, Forest Service, US Department of Agriculture, Albany, CA, 125– 130, 1995.
Beissinger, S. R. and Osborne, D. R: Effects of urbanization on avian community organization, Condor, 84, 75–83, 1982. Berland, A: Long-term urbanization effects on tree canopy cover
along an urban–rural gradient, Urban Ecosys., 15, 721–738, doi:10.1007/s11252-012-0224-9, 2012.
Bibby, C. J. and Burgess, N. D.: Bird Census Techniques, Academic Press, London, 1992.
Blair, R. B: Land use and avian species diversity along an urban gradient, Ecol. Appl., 6, 506–519, 1996.
Blair, R. B.: Birds and butterflies along an urban gradient: surrogate taxa for assessing biodiversity?, Ecol. Appl., 9, 164–170, 1999. Blair, R. B. and Johnson, E. M.: Suburban habitats and their role for
L. Vignoli et al.: Rural–urban gradient and land use in a millenary metropolis 65
Blair, R. B. and Launer, A. E.: Butterfly diversity and human land use: species assemblages along an urban gradient, Biol. Conserv., 80, 113–125, 1997.
Blasi, C., Capotorti, G., Celesti-Grapow, L., Ercole, S., Filesi, L., Lattanzi, E., Michetti, L., Paolanti, M., and Tilia, A.: Land use types and vegetation maps of the Rome Municipality 1 : 50,000, Comune di Roma, Roma, 2001.
Bogosian, V., Hellgren, E. C., and Moody, R. W.: Assemblages of Amphibians, Reptiles, and Mammals on an Urban Military Base in Oklahoma, Southw. Natur, 57, 277–284, 2012.
Bolger, D. T., Scott, T. A., and Rotenberry, J. T.: Breeding bird abundance in an urbanizing landscape in coastal southern Cal-ifornia, Conserv. Biol., 11, 406–421, 1997.
Buckland, S. T., Anderson, D. R., Burnham, K. P., Laake, J. L., Borchers, D. L., and Thomas, L.: Introduction to distance sam-pling, Oxford University Press, Oxford, 2001.
Burnham, K. P.: Summarizing remarks: Environmental influences, in: Estimating numbers of terrestrial birds, edited by: Ralph, C. J. and Scott, J. M., Stud. Avian Biol., 6, 324–325, 1981. Cam, E., Nichols, J. D., Sauer, J. R., Hines, J. E., and Flather,
C. H.: Relative species richness and community completeness: birds and urbanization in the mid-Atlantic states, Ecol. Appl., 10, 1196–1210, 2000.
Celesti Grapow, L.: Atlante della Flora di Roma (Atlas of the flora of Rome), Argos, Comune di Roma, Roma, 1995.
Chace, J. F. and Walsh, J. J.: Urban effects on native avifauna: a review, Landscape Urban Plan., 74, 46–69, 2006.
Chesson, P.: Mechanisms of maintenance of species diversity, Annu. Rev. Ecol. Syst., 31, 343–366, 2000.
Cignini, B. and Zapparoli, M.: Atlante degli uccelli nidificanti a Roma (Atlas of the breeding birds of Rome), Fratelli Palombi Editori, Roma, 1996.
Clergeau, P., Savard, J. P. L., Mennechez, G., and Falardeau, G.: Bird abundance and diversity along an urban–rural gradient: a comparative study between two cities on different continents, Condor, 100, 413–425, 1998.
Clergeau, P., Jokimaki, J., and Savard, J. P. L.: Are urban bird com-munities influenced by the bird diversity of adjacent landscapes?, J. Appl. Ecol., 38, 1122–1135, 2001.
Clergeau, P., Croci, S., Jokim¨aki, J., Kaisanlahti-Jokim¨aki, M. L., and Dinetti, M.: Avifauna homogenisation by urbanisation: Anal-ysis at different European latitudes, Biol. Conserv., 127, 336– 344, 2006a.
Clergeau, P., Jokim¨aki, J., and Snep, R.: Using hierarchical levels for urban ecology, Trends Ecol. Evol., 21, 660–661, 2006b. Comber, A. J.: Land Cover or Land Use?, J. Land Use Sci., 3, 199–
201, 2008.
Cramp, S.: The complete birds of the western Palaearctic, Optime-dia, Oxford Univ. Press, Oxford, 1998.
Croci, S., Butet, A., Georges, A., Aguejdad, R., and Clergeau, P.: Small urban woodlands as biodiversity conservation hot-spot: a multi-taxon approach, Lands. Ecol., 23, 1171–1186, 2008. Crooks, K. R., Suarez, A. V., and Bolger, D. T.: Avian assemblages
along a gradient of urbanization in a highly fragmented land-scape, Biol. Conserv., 115, 451–462, 2004.
D´ıaz, S. and Cabido, M.: Vive la diff´erence: plant functional di-versity matters to ecosystem processes, Trends Ecol. Evol., 16, 646–655, 2001.
Du Toit, M. J. and Cilliers, S. S.: Aspects influencing the selection of representative urbanization measures to quantify urban-rural gradients, Lands. Ecol., 26, 169–181, 2011.
Evans, K. L., Chamberlain, D. E., Hatchwell, B. J., Gregory, R. D., and Gaston, K. J.: What makes an urban bird?, Glob. Change Biol., 17, 32–44, doi:10.1111/j.1365-2486.2010.02247.x, 2011. Ewers, R. M. and Didham, R. K.: Confounding factors in the
detec-tion of species responses to habitat fragmentadetec-tion, Biol. Rev., 81, 117–142, 2006.
Faeth, S. H., Saari, S., and Bang, C.: Urban Biodiversity: Patterns, Processes and Implications for Conservation, eLS 2012, John Wiley & Sons Ltd, Chichester, 2012.
Fern´andez-Juricic, E.: Bird community composition patterns in ur-ban parks of Madrid: the role of age, size and isolation, Ecol. Res., 15, 373–383, 2000.
Fraterrigo, J. M. and Wiens, J. A.: Bird communities of the Col-orado Rocky Mountains along a gradient of exurban develop-ment, Lands. Urban Plan., 71, 263–275, 2005.
French, D. D. and Picozzi, N.: “Functional groups” of bird species, biodiversity and landscapes in Scotland, J. Biogeogr., 29, 231– 259, 2002.
Fuller, R. J. and Langslow, D. R.: Estimating numbers of birds by point counts: how long should counts last?, Bird Study, 31, 195– 202, 1984.
Gagn´e, S. A. and Fahrig, L.: Do birds and beetles show similar re-sponses to urbanization?, Ecol. Appl., 21, 2297–2312, 2011. Garaffa, P. I., Filloy, J., and Bellocq, M. I.: Bird community
re-sponses along urban–rural gradients: Does the size of the urban-ized area matter?, Lands. Urban Plan., 90, 33–41, 2009. Gotelli, N. J. and Entsminger G. L.: EcoSim: Null models
software for ecology. Version 7.0. Acquired Intelligence Inc. & Kesey-Bear, http://homepages.together.net/∼gentsmin/ecosim.
htm, 2001.
Graham, J. H. and Duda, J. J.: The humpbacked species richness-curve: a contingent rule for community ecology, Int. J. Ecol., 2011, 1–15, doi:10.1155/2011/868426, 2011.
Hostetler, M. and Knowles-Yanez, K.: Land use, scale, and bird dis-tributions in the Phoenix metropolitan area, Lands. Urban Plan., 62, 55–68, 2002.
Johnson, D. H.: In defense of indices: the case of bird surveys, J. Wildlife Manage., 72, 857–868, 2008.
Jokim¨aki, J. and Huhta, E.: Artificial nest predation and abundance of birds along an urban gradient, Condor, 102, 838–847, 2000. Jokim¨aki, J., Kaisanlahti-Jokim¨aki, M. L., Sorace, A., Fern´andez
Juricic, E., Rodriguez Prieto, I., and Jimenez, M. D.: Evaluation of the “safe-nesting zone” hypothesis across an urban gradient: a multi-scale study, Ecography, 28, 59–70, 2005.
Kark, S., Iwaniuk, A., Schalimtzek, A., and Banke, E.: Living in the city: can anyone become an “urban exploiter”?, J. Biogeogr., 34, 638–651, 2007.
Lancaster, R. K. and Rees, W. E.: Bird communities and the struc-ture of urban habitats, Canad. J. Zool., 57, 2358–2368, 1979. Llop, E., Pinho, P., Matos, P., Pereira M. J., and Branquinho, C.:
The use of lichen functional groups as indicators of air quality in a Mediterranean urban environment, Ecol. Indic., 13, 215–221, 2012.