Vol.6 (2016) No. 4
ISSN: 2088-5334
Supervisory Fertigation System Using Interactive Graphical
Supervisory Control and Data Acquisition System
Fadhli Dzul Mohd Fauzi
#1, Tatang Mulyana
*, Zairi Ismael Rizman
#2, Mohamad Taib Miskon
#3, Wan
Ahmad Khusairi Wan Chek
#4, Mohamad Huzaimy Jusoh
###
Faculty of Electrical Engineering, Universiti Teknologi MARA, 23000 Dungun, Terengganu, Malaysia
E-mail: [email protected], [email protected], [email protected], [email protected]
* Faculty of Electrical Engineering and Electronic Engineering, Universiti Tun Hussein Onn, 86400 Batu Pahat, Johor, Malaysia E-mail: [email protected]
##
Faculty of Electrical Engineering, Universiti Teknologi MARA, 40450 Shah Alam, Selangor, Malaysia E-mail: [email protected]
Abstract— Mostly, farmers spent most of their time to supervise wide area of planting and it exhausted. The objective of this project is
to develop an advanced monitoring system. In this paper, an attempt has been made by using Interactive Graphical Supervisory Control and Data Acquisition (SCADA) System (IGSS) software and Programmable Logic Controller (PLC) which integrate with a fertigation system to solve the problem. The SCADA monitoring system is built based on Graphical User Interface (GUI) by using IGSS software. As a result, the project is able to control and supervise the fertigation system prototype process smoothly. The project operates in two conditions which indicate the water level in tank and detect the humidity in the soil, thus the user can supervise their plant without perforce to the site of planting area. It can support two ways communication system, which is the main uniqueness and the special features of the project compared to today’s technology. The project can be improved by using the analog type device, where user can see a real time data on screen through supervised mode. The idea of making current project to online is also one of the improvements that can be made.
Keywords— IGSS; GUI; supervisory; fertigation system
I. INTRODUCTION
Supervisory Fertigation System by using Interactive Graphical SCADA System (IGSS) is a project that produces a system that can be controlled by a user at control place. Supervisory is a process of observing and direct the execution of a task or activity. In other words, it monitors some of network activities from beginning to finish [1]. Fertigation is a process of adding liquid fertilizer to irrigation water is an efficient method of delivering fertilizer. Supervisory Control and Data Acquisition (SCADA) systems are typically used to perform data collection and control at the supervisory level [2]. The term of SCADA is usually refers to centralized systems which monitor and control entire sites, or complexes of systems which spread out over large areas [3]. The project is based on the monitoring process in fertigation system, and it produces two ways communication by using IGSS.
The objectives of the project are: (1) To design and construct hardware and software of the supervisory fertigation system by using IGSS; (2) To solve the agricultural problem which mainly to fertilizer plant.
The scopes of the project will be divided into two parts. The first part is hardware development. The project is a prototype which includes tanks, irrigation pipes, dripper and pump. Besides that, it also consists of water level indicator and water detector circuit. Both circuits will be activated when the water is detected. A simple of two conductors are used where it bridged by the water to operate as a sensor when detected.
IGSS control via laptop is a brain of the project. It is where the overall of the system is controlled by the SCADA system. The detected circuit acts as the input while in automatic condition and IGSS will be the input when in manual condition, where the user can control the system via laptop. The function of the PLC in the project is as intercession between IGSS and detector circuit. The PLC will process the input data from both parts either from detector circuit or IGSS and perform necessary tasks to fulfil user requirements [12].
The second part is software development. For the software, a program must be developed for the supervisory fertigation system by using the graphical user interface (GUI). The GUI software that will be used is IGSS 7.0.
II. METHODOLOGY
The system consists of two main parts, namely hardware part and software part. For hardware part, it has water detector and water level indicator circuit, pump and interfacing of the PLC. Fig. 1 shows the general diagram of the project.
Fig. 1 Block diagram of the project
A. Hardware Design
The hardware design is very important to the project. Without the hardware, it cannot be able to perform the water detection task. Fig. 2 shows the hardware part of the project.
Fig. 2 Block diagram of general concept for hardware part
1) Water Sensor
The sensor of the project will be functioning as a switch. When water is detected, a point between each plate and LED on the sensor is shorted. Then, the circuit will be operated and send signal to Integrated Circuit (IC). The sensor is developing with the gap between conductors and wide of conductor is 2mm and 1mm respectively [4]. The sensor was constructed by printed circuit board (PCB). Fig. 3 shows the construction of the sensor for humidity detector and Fig. 4 shows the construction of the sensor for water level indicator unit.
Fig. 3 Sensors for water detection unit
Fig. 4 Sensors for water level indicator unit
2) Injection Pump
The pump is used to control the water flow in the tank. In the project, two pumps are used which one for the water detector and another for the water level indicator. A 12V relay is used as a switch on the pump.
3) Relay Interfaces
The relay is used to connect between PLC and circuit. Process to active the circuit or to make the PLC detects a signal from circuit must be constructed as shown in Fig. 5.
Fig. 5 Interface circuit for relay
4) Programmable Logic Control (PLC)
PLC and PLC based controllers are the most important and useful control systems [5]. PLC is a computer base solid state device that controls industrial equipment and process [6]. It was designed to perform the logic function which executed by relays, drum switches and mechanical timer/counters. The function of the PLC is to control automatically the industrial systems. For the project development, OMRON CQM1H (refer Fig. 6) is selected due to its suitable criteria and features.
B. Software Setup 1) IGSS (Version 7.0)
IGSS software consists of a number of supporting programs, where each with its own specific purpose. The programs are categorized into two main user types, which are system designers and operators [7].
In the project, there are two main programs that be used in developing and designing the GUI of IGSS system. They are System Configuration and Definition.
The System Configuration program acts as a backbone for the overall of the SCADA system. Due to its function and purpose, the first step in developing the IGSS system is to run the program.
IGSS Definition is the main program which be used by the system designer. From the program, system designers can build a model of the monitored process by using process diagrams (mimic diagrams). In process plant, there are 2 types of physical components namely analog devices and digital devices [8]. To enable the process diagrams to be active and functional in IGSS system, it must be connected between the IGSS and the physical components by specifying their unique PLC addresses.
2) CX-Programmer
For the project, software to create a PLC program is CX programmer version 5.0. The software provides ladder language to make ease of the user. Fig. 7 shows the workspace windows for developing the program using ladder diagram.
Fig. 7 Window for developing a program by using ladder diagram
A ladder diagram is a graphical view of a PLC program and is concerned with power-flow. In the diagram, power flows from the left bus bar to the green right bus-bar. A ladder rung is a logical connection between the left and right bus bars. These rungs are executed by the PLC (i.e. from top to bottom) [8].
When on-line to the PLC and monitoring, it is possible to see the power-flow executing. The parts of the diagram where power is present are shown with a thick line of the power-flow color. The user must create a program off line (locally on a computer), then go online and transfer it into the PLC memory [9], [10].
III.RESULT AND DISCUSSION
A. Hardware Part
The testing of each circuit was carried out individually after each circuit was constructed. These circuits are water level indicator circuit, water detector circuit and PLC interface circuit.
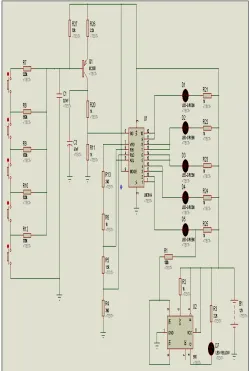
1) Water Level Indicator Circuit
A water level indicator circuit uses 6 units LED to indicate the level of water in a tank. First LED is red LED which shows the empty tank and the other 5 units LED indicate the percentage of water level in the tank.
Fig. 9 Water level indicator
Fig. 8 indicates the water level indicator schematic circuit that used in the project, and Fig. 9 shows the water level indicator for the project. The analysis of the circuit has been summarized in Table 1.
TABLEI
VOLTAGE IN SENSOR UNIT OF WATER LEVEL INDICATOR CIRCUIT
Level LED On Simulation Voltage (V)
Measured Voltage (V)
Empty LED 1 12 9
20% LED 2 9.8 7.2
40% LED 2,3 9.16 6.8
60% LED 2,3,4 8.5 6.4
80% LED 2,3,4,5 7.81 5.4
100% LED 2,3,4,5,6 6.49 5.0
2) Water Detector Circuit
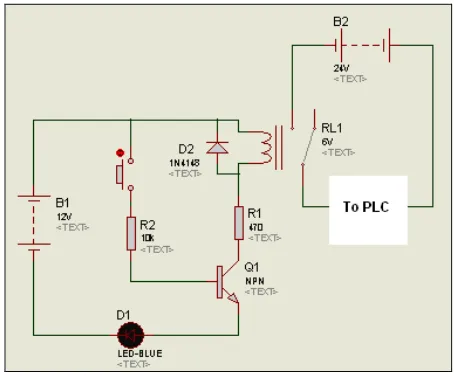
The water detector circuit uses simple components to operate with water pump. In the schematic circuit, the push button is used to replace the function of the water sensor unit. Besides that, LED and battery will be functioning as a water pump. Fig. 10 shows the water detector schematic circuit which used in the project.
Fig. 10 Water sensor detector circuit
When water sensor unit detects any humidity or water, the transistor will be detected small base current and functioning to allow the current flow through it. The relay will operate and it will turn on the pump. The transistor application is called a Darlington pair.
A diode must be connected across the load to protect the transistor from the high voltage which produced when the
load is switched off. The diagram shows how a protection diode is connected backwards across the load, in the case a relay coil.
Fig. 11 Water detector unit
Sensor unit for water detector will be buried in the soil (refer Fig. 11). The analysis of the circuit has been summarized in Table 2.
TABLEII
VOLTAGE AT RELAY COIL OF WATER DETECTOR CIRCUIT
Soil Condition Voltage (V) Pump
Very dry 0 On
Dry 1 On
Normal 4 On/Off
Moist 6 Off
Wet 7.6 Off
Water 8 Off
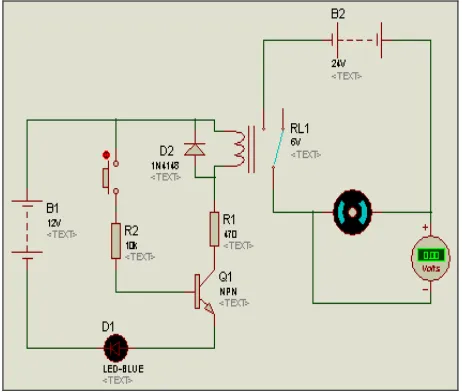
3) PLC Interface Circuit
Input PLC cannot support less than 24V signal from another device. So, to connect the circuit with PLC, the interface circuit must be used. To show in reality situation by using sensor unit, push button is used in the simulation. DC motor also be used in the simulation to indicate whether PLC receives the signal or not. Fig. 12 shows the PLC interface circuit.
B. Software Part
For the project, PLC is used as a Remote Terminal Unit (RTU) and IGSS as a monitor display. The PLC will control the operation of the process and interfacing with SCADA as a GUI for user/operator display [11].
1) IGSS (Ver 7.0)
The SCADA system consists of 3 main screens. The first screen is the cover page and the second screen is for control room which includes automatic mode operation and manual mode operation. The third screen is for fertigation part operation view.
On the first screen display (refer Fig. 13), the title of the project is present and the designer name is also introduced. Besides that, two buttons are also included in the screen to view other two screens.
Fig. 13 First screen (diagram A)
For the second screen (refer Fig. 14), the control panel is shown. The panel includes automated mode operation and manual mode operation. From the screen, users will control the full process for the fertigation system from the control room.
Fig. 14 Second screen (diagram B)
The operation displays for the project are controlled from the diagram or screen. The diagram shows a real device and real time process, including the supervision mode operation. The diagram is used to design any picture which consists a button to display, a piping arrangement and also another layout which called embedded diagram.
Fig. 15 Third screen (diagram C)
For the third screen (refer Fig. 15), the fertigation operations diagram is represented. From the screen, users can see the operation that happens in the real fertigation area. The screen shows two processes which are water flow from outside tank into the tank and water flow from the tank to the plant area.
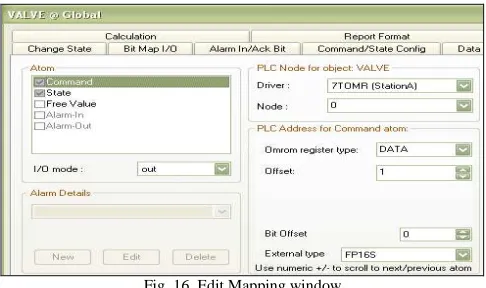
To connect between PLC and personal computer (PC), the address in each point that user used must be defined in the Edit Mapping window. It is very important to make communication for both devices. Fig. 16 shows the Edit Mapping window for IGSS.
Fig. 16 Edit Mapping window
In the window, each value is very important in accomplishing connection with PLC. Table 3 shows the setting for Edit Mapping window that project used.
TABLEIII
PLCADDRESSANDVALUEFOREDITMAPPING
PLC Address Item Valve Pump
Command
Register Data Data
Offset 1 0
Bit offset 0 0
State
Register IR IR
Offset 100 100
Bit offset 1 0
In IGSS definition part, the button is created for the user to control the system operation. The button must be connected to the device symbol to join it in one command. The user must be creative when develops the GUI system to make the graphical diagram look like real situation when it operated. Fig. 17 shows the connect descriptor for the button.
Symbol in IGSS definition can be operated as an alarm. The color can be changed, whether it function as online or offline.
2) CX-Programmer
In PLC part, ladder diagram can divide by two parts which are manual and automatic. In manual part, operation just uses a normal ladder diagram where PLC uses only for the interface between the circuit and PC (IGSS). In automatic part, the operation is for triggering the process from sensor circuit that attached at fertigation system. Fig. 18 shows the ladder diagram of the project.
Fig. 18 Ladder diagram for connecting with IGSS
The objective of the project is to produce the system that can control the fertigation system which mainly in fertilizer process. The system consists of two parts such as hardware and software part. From the obtained result, the application of GUI has been considered achieves the objectives.
In circuit part, it does not have any problem except when it involves the interface between the circuit and PLC. For the interface of both parts, many methods have been already used. But, the most appropriate technique is the use of relay. The problem when using additional circuit for component relay is the consideration of power supply to switch the relay. When develop a PLC program (ladder diagram), there is also problem occurred. It must have two different systems which are for IGSS operation and other one is for sensor circuit. However, the entire problem has been solved and all operations in each part are successfully functioning.
IV.CONCLUSIONS AND RECOMMENDATIONS
In conclusion, the SCADA is able to operate as expected, user friendly and easy to understand. These have directly shown that SCADA is able to control the fertigation system prototype process smoothly. Even though, the project still
needs to be upgraded to obtain a better result and also provide more interactive GUI [12].
In the project, PC has been integrated into the SCADA system as a client. The system is easily programmable according to the process needs, and also easy to understand in supervising mode operation. SCADA offers great features to the user/operator due to its simple process that makes easy to maintain. It also can reduce maintenance and worker cost. Automatic control of the project ensures the system run smoothly without any error. If any problems occur, SCADA will display and troubleshooting is done through the SCADA before heading directly to the plant.
Implementation of analog type devices in the system can produce high accurate data and GUI presentation is more interactive. User can see a real data on screen since supervise mode and data will take with the specific measurement setting in the IGSS SCADA device properties. High consideration should be taken before designer uses analog devices. The IGSS SCADA setting for analog type needs a lot of data to show proper operation of devices.
Next, the idea of making the current SCADA online will be a breakthrough. It can be done through the Internet Display Computer (IDC) plus with the server. The system should be able to be monitored from a remote control.
REFERENCES
[1] A. A. Bakar, “Graphical User Interface (GUI) for Supervisory Control of Computer Integrated Manufacturing (CIM-70A) using SCADA,” M. Eng. thesis, Universiti Tun Hussein Onn Malaysia, Batu Pahat, Johor, May 2007.
[2] D. Bailey and E. Wright, Practical SCADA for Industry, 1st ed., V. Mehra, Ed. Boston, USA: Newnes, 2003.
[3] J. Park and S. Mackay, Practical Data Acquisition for Instrumentation and Control Systems, 1st ed., V. Mehra, Ed. Boston, USA: Newnes, 2003.
[4] Electronic-Circuits-Diagrams.com. (2015) Rain alarm. [Online]. Available: http://www.electronic-circuits-diagrams.com/rain-alarm-circuit/.
[5] J. Stereson, Fundamentals of Programmable Logic Controllers: Sensors and Communication, 3rd ed., New Jersey, USA: Prentice Hall, 2004.
[6] Schneider Electric. (2010) Getting started with IGSS. [Online]. Available: http://www.igss.com/Files/Doc-Help/getting-started-v10.pdf.
[7] P. Wild, Industrial Sensors and Applications for Condition Monitoring, London, England: Mechanical Engineering Publications; 1994.
[8] Omron Corporation. (2001) SYSMAC CS series CS1G/H-CPU_H programmable controllers operation manual. [Online]. Available: http://www.omronkft.hu/nostree/pdfs/plc/cs1_cj1/w339-e1-17+cs-series+operationmanual.pdf.
[9] B. Rooholahi and P.L. Reddy, “Concept and application of PID control and implementation of continuous PID controller in Siemens PLCs,” Indian J. Sci. Technol., vol. 8, pp. 1-9, Dec. 2015.
[10] A. Ikhlef, M. Kihel, B. Boukhezzar, N. Mansouri, and F. Hobar, “Online PID control of tank level system,” in Proc. EDUCON’16, 2016, p. 281.
[11] H. Yenginer, C. Cetiz, and E. Dursun, “A review of energy management systems for smart grids,” in Proc. ICSG’15, 2015, p. 1. [12] N. Kumaresan, “GUI based implementation and Performance
comparison of certain DAQ systems using arm processors with wireless protocols,” Ph.D thesis, Anna University, Chennai, India, Mar. 2015.
[13] R. Pereira, J. Figueiredo, R. Melicio, V. M. F. Mendes, J. Martins, and J. C. Quadrado, “Consumer energy management system with integration of smart meters,” Energ Rep., vol. 1, pp. 22-29, Nov. 2015.
Manual