http://ejplantbreeding.com
165
Assessment of variability in water lily (Nymphaea spp.)
Tincy Tom, K. T. Presannakumari and S. Krishnan.
Department of Plant Breeding and Genetics,
College of Horticulture, Kerala Agricultural University, Thrissur, Kerala- 680 656.
E- mail: [email protected]
(Received: June 2015 ; Accepted: September 2015)
Abstract
Twelve accessions of water lily (Nymphaea spp.) differing in flower colour and opening time were selected from diverse locations of the water lily growing tracts of Thrissur district. These accessions were evaluated based on the width as well as length of leaf lamina, length of notch on lamina, length of mature flower bud, circumference of mature flower bud, diameter of fully opened flower, number of petals and number of stigmatic appendages in the flower. The study revealed that there was significant variability among the accessions for all the characters evaluated. DMRT was carried out and the accessions were grouped taking diameter of fully opened flower as well as the size of mature flower bud as the decisive characters for grouping. Significant correlations were observed between flower size and leaf size as well as flower size and length of mature flower bud. Hence, leaf size can be taken as an indicator of the flower size of the accession. Selection programmes based on length of lamina will be effective in improving the population, since PCV, GCV, H2 and GG were the highest for this character.
Keywords: Variability, Nymphaea, Water lily
Nymphaea, commonly known as water lily, is the largest and most diverse genus in the family Nymphaeaceae. There are about seventy species in this genus and are distributed in all the continents except Antarctica (Lohne et al., 2008). Water lily, important in aquatic landscaping, is ornamentally valued and economically viable as a vegetable as also a source of medicinal compounds (Huang et al., 1997). The members of this genus are aquatic perennials with erect or horizontal underground stems. They are also characterized by the presence of floating, elliptic to orbicular leaf blades with a saggitate base. The solitary flowers are emergent with many sepals, petals, stamens and carpels. Anthesis is diurnal or nocturnal depending on the species (Lima et al., 2012). A combination of characters like flower bud size, flower size, flower colour, frequency of flowering and periodicity of flowering are considered to be decisive in the selection of water lily as an ornamental plant (Dassanayake, 1996). It was in this background the present study was undertaken to assess the variability among twelve accessions of water lily.
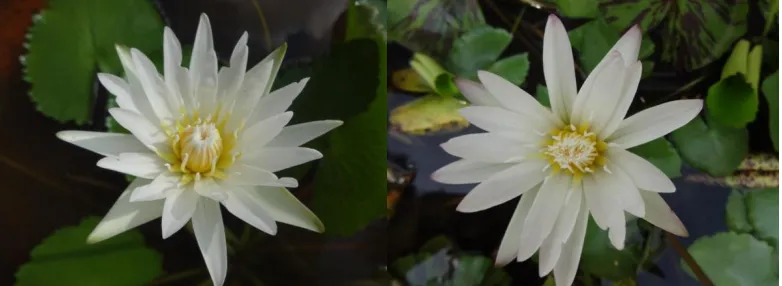
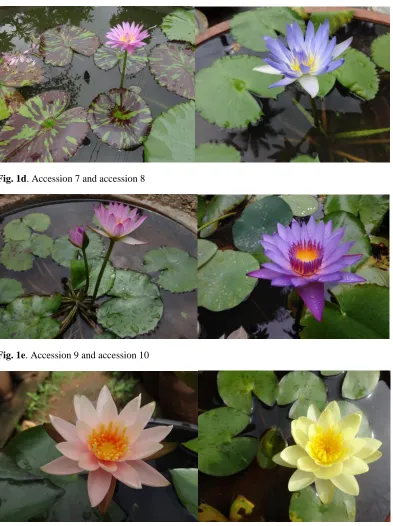
Twelve accessions of water lily (Nymphaea spp.) differing in flower colour and opening time, collected from diverse locations of the water lily growing tracts of Thrissur district (Fig 1a to 1f) formed the material for the study. All the selected accessions were grown
in cement tanks of uniform size. Uniform water level was also maintained in all the tanks. The experiment was carried out in completely randomized design (CRD) with five replications each. These accessions were evaluated based on leaf and floral characters. The width as well as length of lamina and length of notch on the lamina were the leaf characters considered for evaluation. The leaf width was measured at the widest point of lamina across the notch. The leaf length was taken as the length from the notch to the tip of leaf. The floral characters considered for evaluation were length of mature flower bud, circumference of mature flower bud, diameter of fully opened flower, number of petals and number of stigmatic appendages. Observations on the various biometric characters of leaf were taken from five fully developed leaves in each replication of each accession. Five flower buds from each replication of each accession were observed for recording floral characters.
http://ejplantbreeding.com
166
character based on the formula developed by Allard(1960).
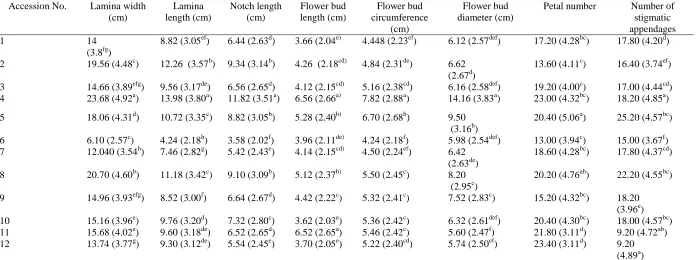
The analysis of variance was done for each of the characters observed in different accessions. The post hoc test viz., Duncan’s Multiple Range Test (DMRT) was also carried out and the subgroups obtained for the different characters are presented in Table 1. From Table 1, it is evident that the accessions differed significantly for all the characters evaluated. A character wise review reveals that the subgroups for the different characters under study were more or less uniform as regards their composition.
Grouping of the accessions were done based on the results of the post hoc test, DMRT, for the two most decisive characters of water lily in ornamental gardening i.e. diameter of fully opened flower as well as the size of mature flower bud as indicated by its length and circumference. With these decisive characters, a rationale for the exclusive identification and reconstruction of the subgroups without overlapping was achieved. Whenever there was an ambiguity regarding the assignment of an accession into a particular subgroup i.e., when the same fell in another subgroup also, assignment was made with respect to the remaining characters. The groups formed in such a way, along with the accessions falling in each subgroup, are presented in Table 2. The groups I and II included only one accession each. The group IV was the biggest one with six members. The summary statistics viz., range, mean, standard deviation and coefficient of variation (CV) were computed group wise and the results are presented in Tables 3a to 3h.
The flower size as indicated by the mean diameter of the flower was the highest in group I and the lowest in group V. The mean diameter of the flowers ranged from 12 to 15 cm with a standard deviation of 1.26 cm in group I and the same decreased to a range of 5 to 6.1 cm with a respective standard deviation of 0.36 cm in group V (Table 3a). The length of flower bud ranged from 6.20 to 7.00 cm in group I with a mean value of 6.56 cm and 3.10 to 6.70 cm in group V with a mean value of 5.11 cm (Table 3b). The circumference of flower bud was ranging from 7.20 to 8.20 cm in group I. The range was the lowest in group II (6.50 to 7.00 cm). The intra group variability for length of flower bud was the highest (29.5%) in group V (Table 3b).
With respect to circumference of flower bud, the highest intra group variability (10.7%) was exhibited by group IV (Table 3c). The group I recorded the highest mean petal number of 23 and group IV recorded the lowest value of 17 (Table 3d). The mean number of stigmatic appendages was the highest in group II and the lowest in group V (Table 3e). The highest intra group variability for number of petals was exhibited by group III and for number of stigmatic appendages was exhibited by group II (Table 3e).
The width of lamina ranged from 22.40 to 25.00 cm in group I, 17.70 to 18.70 in group II, 14.40 to 21.20 cm in group III, 5.60 to 21.00 cm in group IV and 12.10 to 16.40 in group V (Table 3f). The length of lamina showed a range of 13.20 to 14.50 cm in group I, 9.50 to11.40 cm in group II, 8.20 to12.00 cm in group III, 4.20 to 13.20 cm in group IV and 7.80 to 10.50 cm in group V with the highest mean value in group I (Table 3g). The width and length of lamina were the highest in group I and the lowest in group IV (Table 3f and 3g). The range observed for notch length was 11.00 to 12.40 cm in group I, 8.00 to 9.50cm in group II, 6.50 to 9.30 cm in group III, 3.30 to 10.50 cm in group IV and 5.00-6.60 cm in group V. The notch length was the highest in Group I and the lowest in group V (Table 3h). The intra group variability for width and length of lamina as well as length of notch were the highest in group IV.
The ratio of flower diameter to length of mature flower bud as well as circumference of mature flower bud in the five different groups is presented in Table 4. There was a steady decline in the flower diameter : bud length ratio from group I to group V. Similar pattern was observed in the ratio of flower diameter to width as well as length of lamina (Table 5). From the results it can be seen that there is correlation between leaf size (width and length of lamina) and flower size as well as flower bud length and flower size. This points to the fact that lamina size is indicative of flower size in water lily.
http://ejplantbreeding.com
167
can be safely exercised. PCV and GCV were high forthe character lamina length. Moderate PCV and GCV were observed for lamina width, notch length, diameter of flower and number of stigmatic appendages. The circumference of bud and petal number exhibited low PCV and GCV. The bud length recorded moderate PCV and low GCV. Genetic gain was high for the characters like lamina width, lamina length, notch length, diameter of flower bud and number of stigmatic appendages. Moderate genetic gain was observed for the characters bud length, circumference of bud and number of petals. Among
the characters considered for evaluation, length of lamina showed the highest GCV (28.53%), heritability (99%) and genetic gain (58.55%) indicating its scope in selection programmes (Table 6). This can bring about more than 50% improvement in the population.
Acknowledgement
Thefinancial assistance given by Kerala Agricultural University in the form of junior fellowship to the first author is acknowledged.
References
Allard, R.W .1960. Principles of Plant Breeding. John Willey and Sons, New York. 485 pp.
Burton, G. W.and de Vane E. H.1953. Estimating heritability in Tall Fescue (Festuca-arundinacea) from replicated clonal material. Agron. J., 45: 481-487.
Dassanayake, M. D. 1996. Nymphaeceae. In: Dassanayake, M. D and Clayton, W. D.(eds), A Revised Handbook to the Flora of Ceylon Oxford and IBH publishing Co. Pvt. Ltd., New Delhi, 434p.
Huang, G. Z., Deng, H. Q., Li, Z. X. and Li, G. 1997. Water Lily. China For., 1–4.
Johnson, H.W., Robinson, H. P. and Comstoc, R.E. 1955. Estimation of genetic and environmental variability in soybeans. Agron. J., 47: 314-318. Lima, C. T., Giulietti, A. M. and Santos, F.A.R. 2012. Flora
da Bahia: Nymphaeaceae. Sitientibus. Serie Ciencias Biologicas, 12(1): 69–82.
Lohne, C., Borsch, T., Jacobs, S.W. L., Hellquist, C. B. and Wiersema, J. H. 2008. Nuclear and plastid DNA sequences reveal complex reticulate patterns in Australian water-lilies (Nymphaea subgenus Anecphya, Nymphaeaceae). Aust. Syst. Bot., 21: 229–50.
Singh R. K and B. D Chaudhary.1977. Biometrical Methods in Quantitative Genetic Analysis. Kalyani Publishers, New Delhi, 318 pp.
http://ejplantbreeding.com
168
Table 1. Mean values of various characters in different accessions of water lily Accession No. Lamina width
(cm)
Lamina length (cm)
Notch length (cm)
Flower bud length (cm)
Flower bud circumference
(cm)
Flower bud diameter (cm)
Petal number Number of stigmatic appendages
1 14
(3.8fg)
8.82 (3.05ef) 6.44 (2.63d) 3.66 (2.04e) 4.448 (2.23ef) 6.12 (2.57def) 17.20 (4.28bc) 17.80 (4.20d)
2 19.56 (4.48c) 12.26 (3.57b) 9.34 (3.14b) 4.26 (2.18cd) 4.84 (2.31de) 6.62 (2.67d)
13.60 (4.11c) 16.40 (3.74ef)
3 14.66 (3.89efg) 9.56 (3.17de) 6.56 (2.65d) 4.12 (2.15cd) 5.16 (2.38cd) 6.16 (2.58def) 19.20 (4.00c) 17.00 (4.44cd) 4 23.68 (4.92a) 13.98 (3.80a) 11.82 (3.51a) 6.56 (2.66a) 7.82 (2.88a) 14.16 (3.83a) 23.00 (4.32bc) 18.20 (4.85a)
5 18.06 (4.31d) 10.72 (3.35c) 8.82 (3.05b) 5.28 (2.40b) 6.70 (2.68b) 9.50 (3.16b)
20.40 (5.06a) 25.20 (4.57bc)
6 6.10 (2.57c) 4.24 (2.18h) 3.58 (2.02f) 3.96 (2.11de) 4.24 (2.18f) 5.98 (2.54def) 13.00 (3.94c) 15.00 (3.67f) 7 12.040 (3.54h) 7.46 (2.82g) 5.42 (2.43e) 4.14 (2.15cd) 4.50 (2.24ef) 6.42
(2.63de)
18.60 (4.28bc) 17.80 (4.37cd)
8 20.70 (4.60b) 11.18 (3.42c) 9.10 (3.09b) 5.12 (2.37b) 5.50 (2.45c) 8.20 (2.95c)
20.20 (4.76ab) 22.20 (4.55bc)
9 14.96 (3.93efg) 8.52 (3.00f) 6.64 (2.67d) 4.42 (2.22c) 5.32 (2.41c) 7.52 (2.83c) 15.20 (4.32bc) 18.20 (3.96e) 10 15.16 (3.96e) 9.76 (3.20d) 7.32 (2.80c) 3.62 (2.03e) 5.36 (2.42c) 6.32 (2.61def) 20.40 (4.30bc) 18.00 (4.57bc) 11 15.68 (4.02e) 9.60 (3.18de) 6.52 (2.65d) 6.52 (2.65a) 5.46 (2.42c) 5.60 (2.47f) 21.80 (3.11d) 9.20 (4.72ab) 12 13.74 (3.77g) 9.30 (3.12de) 5.54 (2.45e) 3.70 (2.05e) 5.22 (2.40cd) 5.74 (2.50ef) 23.40 (3.11d) 9.20
http://ejplantbreeding.com
169
Table 2. Groups obtained and members in each group
Groups Accessions
Group I Accession 4
Group II Accession 5
Group III Accession 8, Accession 9
Group IV Accession1, Accession 2, Accession 3, Accession
6, Accession 7, Accession 10
Group V Accession 11, Accession12
Table 3a. Descriptive statistics for flower diameter in different groups of water lily
Groups Range
(cm)
Mean (cm) Standard deviation
(cm)
CV (%)
Minimum Maximum
Group I 12.00 15.00 14.16 1.26 8.90
Group II 8.00 10.00 9.50 0.87 9.10
Group III 7.30 8.60 7.86 0.42 5.30
Group IV 5.00 7.50 6.27 0.55 8.80
http://ejplantbreeding.com
170
Table 3b. Descriptive statistics for length of flower bud in different groups of water lily
Table 3c.
Descriptive statistics for circumference of flower bud in different groups of water lily
Groups Range
(cm)
Mean (cm)
Standard deviation
(cm)
CV (%)
Minimum Maximum
Group I 7.20 8.20 7.82 0.41 5.24
Group II 6.50 7.00 6.70 0.19 2.83
Group III 5.00 6.00 5.41 0.28 5.20
Group IV 3.90 5.60 4.76 0.51 10.70
Group V 5.10 5.90 5.34 0.22 4.10
Groups Range
(cm)
Mean (cm)
Standard deviation
(cm)
CV (%)
Minimum Maximum
Group I 6.20 7.00 6.56 0.33 5.00
Group II 5.10 5.50 5.28 0.16 3.00
Group III
4.10 5.40 4.77 0.46 9.60
Group IV
3.20 4.70 3.96 0.37 9.30
http://ejplantbreeding.com
171
Table 3d. Descriptive statistics for petal number in different groups of water lily
Groups Range Mean Standard
deviation
CV (%)
Minimum Maximum
Group I 22 24 23 1.00 4.30
Group II 17 24 20.4 2.51 12.50
Group III 13 21 17.70 2.79 15.70
Group IV 12 22 17 0.32 1.90
Group V 20 24 22.60 1.51 6.70
Table 3e. Descriptive statistics for number of stigmatic appendages in different groups of water lily
Groups Range Mean Standard
deviation
CV
(%)
Minimum Maximum
Group I 16 19 18.20 1.30 7.10
Group II 19 28 25.20 3.70 14.70
Group III 16 23 20.20 2.53 12.50
Group IV 15 22 17.63 2.04 11.60
http://ejplantbreeding.com
172
Table 3f. Descriptive statistics for lamina width in different groups of water lily
Groups Range
(cm)
Mean
(cm)
Standard
deviation
(cm)
CV
(%)
Minimum Maximum
Group I 22.44 25.00 23.68 1.08 4.56
Group II 17.70 18.70 18.06 0.39 2.20
Group III 14.40 21.20 17.83 3.05 17.10
Group IV 5.60 21.00 13.59 4.17 30.70
Group V 12.10 16.40 14.71 1.43 9.72
Table 3g. Descriptive statistics for lamina length in different groups of water lily
Groups Range
(cm)
Mean
(cm)
Standard
deviation
(cm)
CV
(%)
Minimum Maximum
Group I 13.20 14.50 13.98 0.60 4.30
Group II 9.50 11.40 10.72 0.74 6.90
Group III 8.20 12.00 9.85 1.46 16.20
Group IV 4.20 13.20 8.68 2.54 29.30
http://ejplantbreeding.com
173
Table 3h. Descriptive statistics for notch length in different groups of water lily
Table 4. Ratio of flower diameter to bud length and circumference in different groups
Groups D/BL ratio D/BC ratio
Group I 2.16 1.81
Group II 1.80 1.42
Group III 1.65 1.45
Group IV 1.58 1.31
Group V 1.11 1.06
D - Diameter of flower BL - Bud length BC – Circumference of bud
Groups Range
(cm)
Mean
(cm)
Standard
deviation
(cm)
CV
(%)
Minimum Maximum
Group I 11.00 12.40 11.82 0.60 5.10
Group II 8.00 9.50 8.82 0.61 6.90
Group III 6.50 9.30 7.87 1.31 16.60
Group IV 3.30 10.50 6.44 1.84 28.60
http://ejplantbreeding.com
174
Table 5. Ratio of flower diameter to width and length of lamina in different groups
Groups D/WL D/LL
Group I 0.60 1.01
Group II 0.53 0.89
Group III 0.44 0.80
Group IV 0.46 0.72
Group V 0.39 0.60
D - Diameter of flower WL – Width of lamina LL – Length of lamina
Table 6. Descriptive statistics for various characters of water lily accessions
Character Mean Range SD PCV
(%)
GCV (%)
H2 (%)
GG (%)
Minimum Maximum
Lamina width (cm) 3.98 2.57 4.92 0.58 15.12 14.91 97 30.25
Lamina length (cm) 3.16 2.18 3.81 0.40 28.67 28.53 99 58.55
Notch length (cm) 2.76 2.02 3.51 0.39 14.54 14.17 95 28.37
Length of flower bud (cm) 2.25 2.03 2.66 0.22 10.23 9.83 93 19.49
Circumference of flower bud (cm) 2.42 2.18 2.88 0.20 8.47 8.06 91 15.80
Diameter of flower (cm) 2.78 2.47 3.83 0.39 14.34 13.84 93 27.54
Petal number 4.38 3.67 4.89 0.42 9.95 9.07 83 17.07
No. of stigmatic appendages 4.13 3.11 5.06 0.67 16.53 12.93 61 20.81
*PCV & GCV (Sivasubramanian and Menon , 1973) - Low: less than 10%, Moderate: 10-20%, High: more than 20% *H2 (Johnson et al., 1955) - Low: less than 30%, Moderate: 30-60%, High: more than 60%
http://ejplantbreeding.com
175
Fig. 1a. Accession 1 and 2
Fig. 1b. Accession 3 and 4
http://ejplantbreeding.com
176
Fig. 1d. Accession 7 and accession 8
Fig. 1e.Accession 9 and accession 10